INTRODUCTION
PROBLEMS & OBJECTIVES
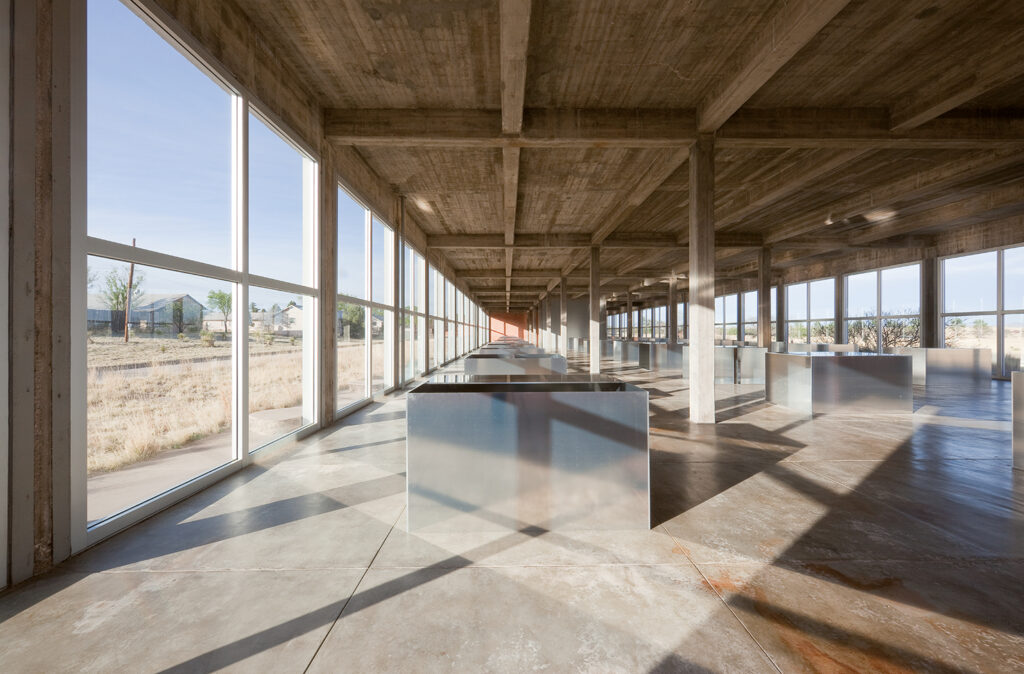
For this project, our team — consisting of myself, Jiyoung Lee, Kate Nadel, and Ting Wang — analyzed the Chinati Foundation’s website activity and original video content from March 2020 to the present (early May 2021). The Chinati Foundation is a nonprofit contemporary art museum located in Marfa, Texas. Founded in 1987 by pioneering sculptor Donald Judd, Chinati embeds large-scale permanent art installations into the landscape of southwest Texas to produce a unique museum experience.
The main problem I identified at the outset of this project is the lack of attention and resources Chinati devotes to analyzing their digital presence. The Chinati Foundation has no designated web development, UX, or digital analytics staff, and only began monitoring their website activity in March 2020 following a major relaunch of their site. As a result, Chinati has a limited understanding of who uses their website, in what ways, and to what ends. Though staff members suspect visitors use their site in different ways based on their location and interests — for instance, to review trip-planning information, browse digital collections, or attend online programming — these beliefs are ultimately more anecdotal than based on a thorough analysis of data.
This gap in user knowledge is particularly urgent given that the Foundation’s physical grounds have been closed to the public for most of the last year, meaning those interested in the Chinati Foundation must engage with them through exclusively digital means.
In order to better understand Chinati’s web presence and the Foundation’s strategic digital goals, our team interviewed Chinati Foundation archivist Hannah Marshall in mid-March. Following our conversation with Hannah, I distilled our notes into several relevant research objectives for us to pursue:
- Audience Profile & Demographics: Define website user groups and determine whether they align with Chinati’s working understanding of their patrons (in regards to age, location, and other demographic factors).
- Behavior & Engagement: Identify common user paths and trends through Chinati’s website in order to better understand key differences in how local and international visitors navigate and engage with this site.
- Vimeo Analysis: Analyze Chinati’s original video content (in regards to engagement, reach, and other metrics of success).
As a team, our goals were to sufficiently address the above research objectives and provide actionable insights and recommendations to strengthen the Chinati Foundation’s understanding of their website users and web activity. I contributed to this stage of the process by preparing questions for Hannah, distilling our meeting notes into relevant research objectives, cleaning up the CSV files provided to us, and charting a few potential directions for further research.
Limitations
Here are the main project limitations I identified early on in this process:
- Scarcity of data: The Chinati Foundation only began implementing Google Analytics in March 2020, in conjunction with the launch of a new website and the onset of the COVID-19 pandemic in America.
- No data from old website: No analytics data was collected on the Chinati Foundation’s old website, and so our team was unable to determine how their new site relates to or differs from it.
- Lack of tracking systems in Google Analytics: Our team quickly found we were unable to answer particular strategic questions (eg, “How does our front page Carousel perform?”) due to the absence of Event Tracking, Site Search Tracking, and other Google Analytics tools on Chinati’s website.
METHODOLOGY / PROCESS
Our team’s process was highly collaborative and iterative. Though we delegated certain tasks to particular team members, we met often to discuss our findings, clarify questions, identify next steps, and construct and revise our dashboards and Evaluation Report. In my view, the majority of the work we completed was done synchronously as a full group.
Following our conversation with Hannah, our team was given access to a year’s worth of Google Analytics data and CSV files containing data on Chinati’s Vimeo account. We were given roughly 6 weeks to analyze this data in light of the above research objectives, synthesize our findings in the form of an evaluation report and interactive dashboard, and present our results and recommendations to our client.
After identifying high-level research objectives, we collectively brainstormed corresponding metrics for each objective (see screenshot below). Identifying specific metrics before delving into Google Analytics and Vimeo data helped provide clarity from the outset and ground our subsequent analysis.
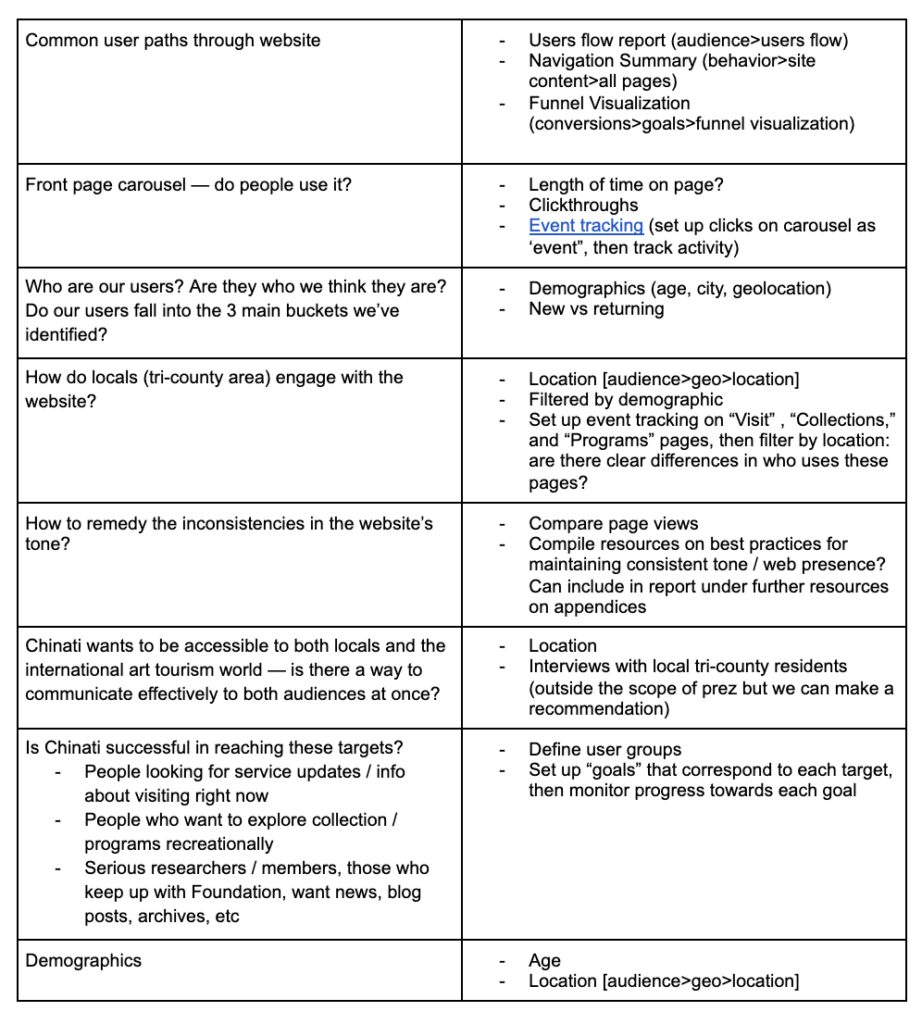
As noted above, relevant metrics include: Users; Sessions; New Users; Returning Users; Unique Pageviews; Bounce Rate; Average Time on Page; and Entrances. Relevant dimensions include: City; Country; Age; Default Channel Grouping; Device Category; Medium; User Type; Month of Year; Landing Page; Page Path (Level 1); Page Title; and Page.
Once suitable metrics were identified, we began diving into Chinati’s Google Analytics account and constructing our dashboard. We quickly decided to construct two separate dashboards, one related to big picture demographic and behavioral trends, and the other to more narrow analysis of specific Chinati web pages. This decision was made in order to highlight both high-level site trends and provide more granular analyses of specific web content, including Chinati’s “Visit,” “Collections,” and “Programs” pages. Work was divided amongst the four of us, and I contributed primarily to the User Demographics and Overall Behavior dashboard (in particular the “Acquisitions” and “Behavior” sections).
Given Hannah’s interest in determining the Chinati website’s distinct user groups, we created filters that enable dashboard customization by User Type, Age, City, Country, and Time Period. These filters allow dashboard users to view website activity in a much more granular sense, thereby answering strategic questions with more precision.
Once our dashboards started coming together, our team began to get a better sense of the Chinati Foundation’s web activity and began formulating tentative responses to the research objectives identified above.
RESULTS / FINDINGS
While our Evaluation Report and Presentation Slides offer a thorough, detailed breakdown of our results, our main findings are listed below grouped by category:
Audience profile & demographics
- New vs. Returning User breakdown: From March 20, 2020 to April 14, 2021, the total number of users is 104,267 and the number of new users is 103,690. The incredibly high rate of new users in unsurprising, given Chinati’s website went live to the public in March 2020.
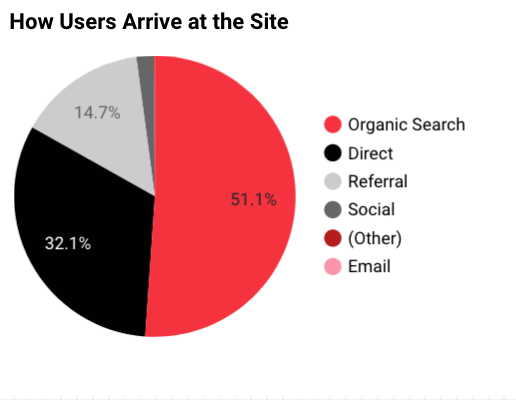
- Acquisition Sources: Most users (51.1%) arrive at the site from organic (unpaid) searches; the second largest segment (32.1%) arrive at the site by typing the website’s URL directly into their web browser. (See “Acquisition Sources” figure below)
- Top Landing Pages: In regards to number of sessions, Chinati’s top landing pages are their homepage (36.62%), artists in residency programs (21.94%) and visit information (6.97%).
Behavior
- Devices Used: A majority of users (63.5%) access Chinati’s website on a desktop device, with 34.3% arriving via a mobile device and the remaining ~2% arriving via tablet.
- New vs. Returning User Behavior: In general, no major behavioral differences were found between these two groups, though “Returning” users spend slightly more time on each page on average (00:01:22) compared to “New” users (00:00:57).
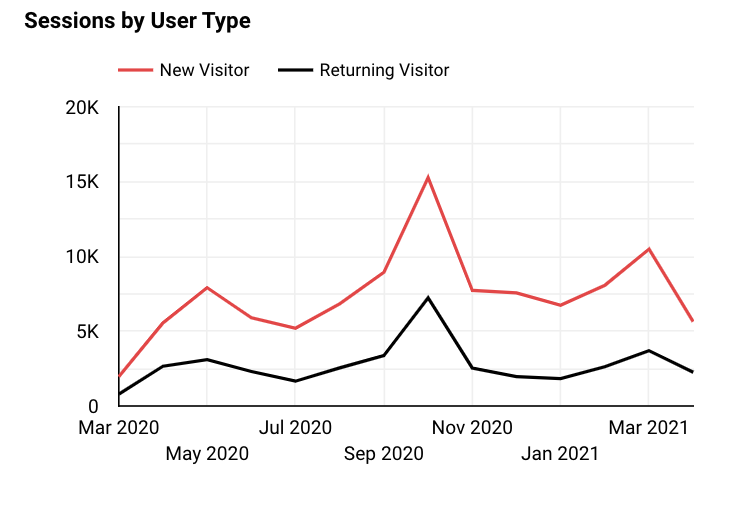
- Sessions Peaked in October 2020: In general, both “New” and “Returning” sessions reached their peak in October 2020, hitting a far greater number of sessions than any other month (see “Sessions by User Type” figure). This surge in sessions likely corresponds with the annual “Chinati Weekend” event.
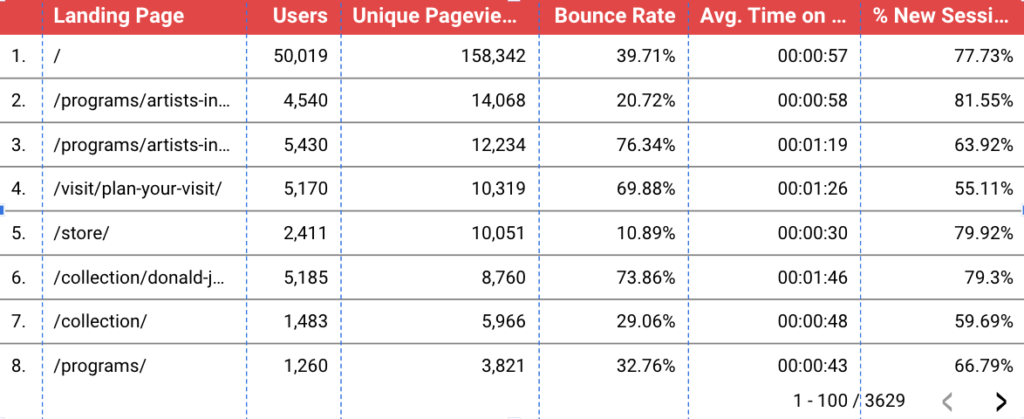
- Landing Page Analysis: The most popular landing page by far is Chinati’s homepage, generating over 50,000 sessions and roughly 158,000 unique pageviews in the past year or so (see “Landing Page Analysis” figure). More significantly, each of the Chinati Foundation’s most visited landing pages have quite high “% New Sessions” rankings; for instance, 78% for Chinati’s homepage, 82% for Chinati’s Artist-in-Residence program, and 80% for Chinati’s “Store” page. Each of these pages, then, attracts a very high rate of users who have never visited Chinati’s website before. Chinati should pay particular attention to pages with Bounce Rates over 60%, as these pages can be better optimized to enhance retention and engagement; this includes the “artists-in-residence,” “plan-your-visit,” and “collection/donald-judd” pages.
Page analysis
- Most Visited Pages: Excluding Chinati’s homepage, the “Programs” and “Collections” pages are the most popular sections of the website overall.
- Website use by Marfa residents: When our dashboard is filtered by “City” to show only users located in Marfa (Figure 6), the most popular section of the site is “Visit,” followed by “Collection.”
- Website use by Texans: When filtered by major cities in Texas (Dallas, Austin, and Houston), “Programs,” “Artist in Residence”, and “Internships” pages are most visited (in descending order).
- Website use by major American cities: When filtered by other major American cities (New York, Los Angeles, London, Chicago, and San Francisco), the most visited section of the page is consistently “Programs.” “Artists in Residence” pages are frequently visited, too.
Vimeo Analysis
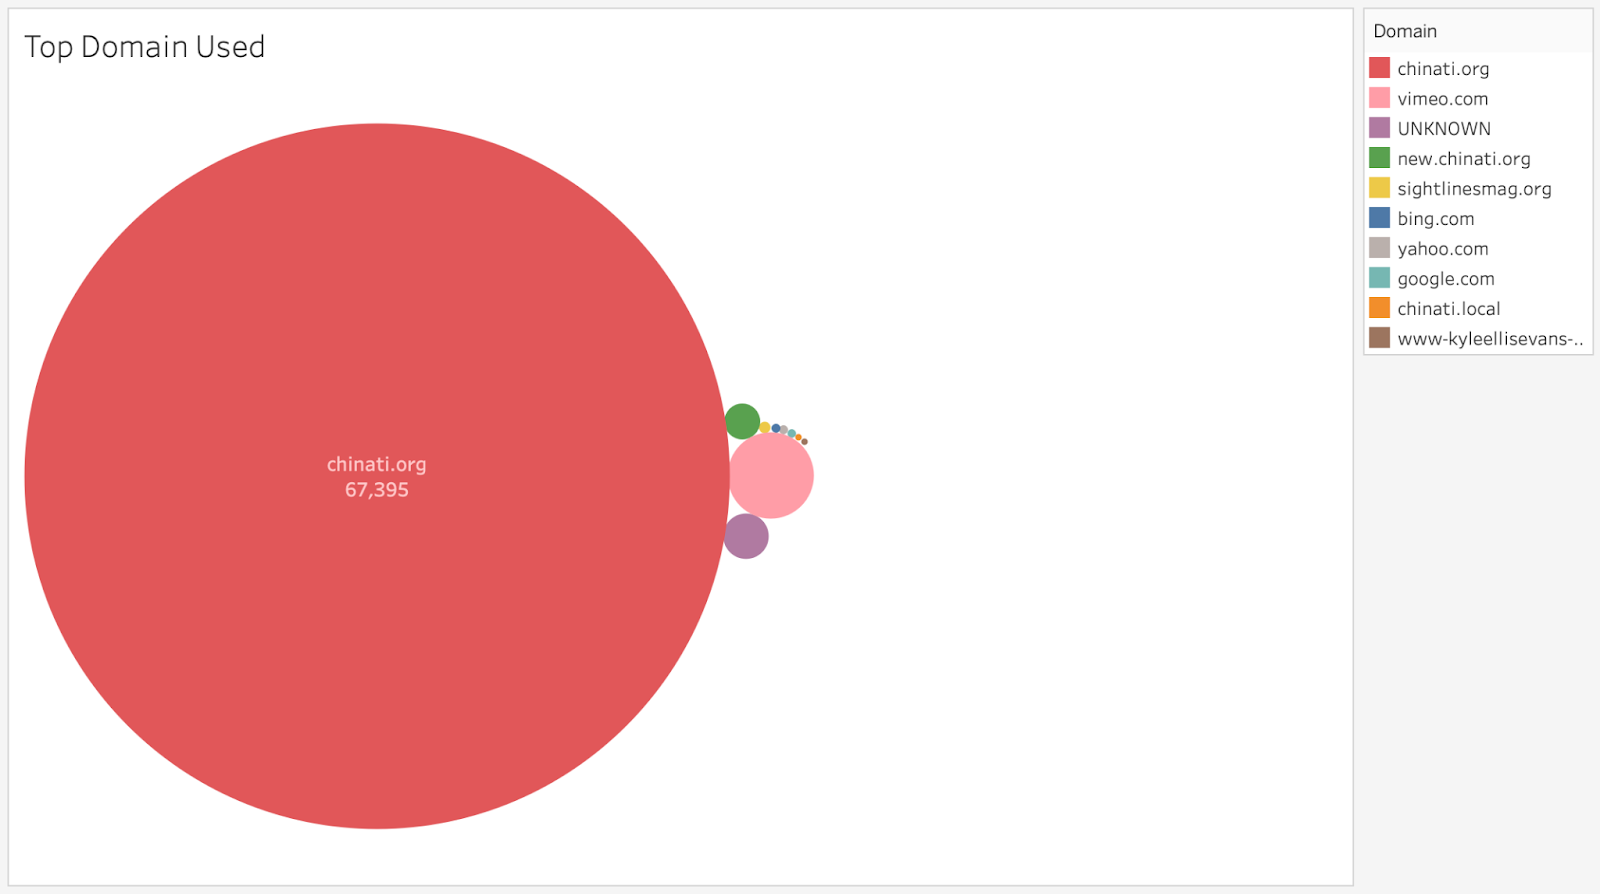
- Top Domain Used: The vast majority (98%) of Chinati’s video views occur through their website, rather than Vimeo account (see “Top Domain Used” figure to the right).
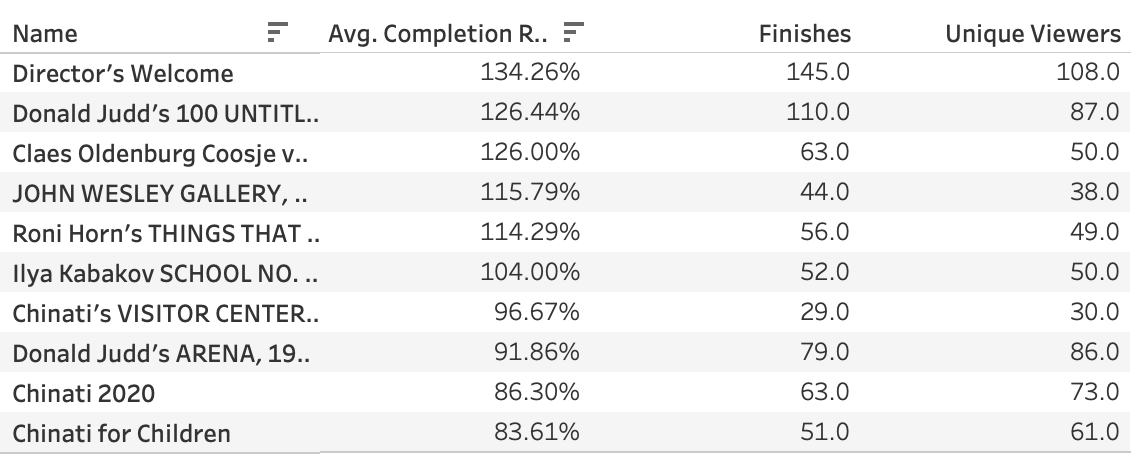
- High Completion Rates, low views: Chinati’s videos with high completion rates frequently have relatively low numbers of viewers. This brings to mind our client’s claim that Chinati strives to maintain a smaller but more loyal audience on their digital platforms. Given this perspective, content with fewer unique viewers but higher average completion rates is still quite successful (see left figure).
- Popular content no longer available to view: Chinati’s most popular video (“Sheds drone footage_Edited” from April 2020) reached an overwhelmingly high view count compared to the rest of their video content. However, this video is no longer available to view on either Chinati’s Vimeo’s video feed or website. Other popular videos include those related to the Chinati Foundation’s annual “Chinati Weekend” event.
RECOMMENDATIONS & CONCLUSION
After reviewing our findings, our team offered the following recommendations, from most strategic and high-level to most granular:
- Establish goals and a digital strategy for each section of the website
- Make video content more searchable and connected to promoted events
- Improve site retention and engagement
- Optimize Google Analytics
Establish goals and a digital strategy for each section of the website
We recommend establishing specific site goals using Google Analytics based on the behavior and needs of users from various locations. This process requires identifying strategic objectives for Chinati’s website, defining corresponding metrics for these objectives, and setting up “Conversion Goals” in Google Analytics.
Make video content more searchable and connected to promoted events
We recommend keeping popular videos public for users to access on Vimeo. We also suggest that the Chinati Foundation continue developing their Chinati Weekend video series, given the overall rate of views for this content is significantly higher than most other videos posted by Chinati. Finally, we also found that some videos currently are located on https://chinati.org/category/video/ which is difficult to navigate and discover; we therefore recommend adding these videos to the “News” section so people can easily access these event related videos.
Improve site retention and engagement
In order to enhance engagement with Chinati’s website, we recommend working to increase user session durations and the number of returning users, and to decrease bounce rate on popular landing pages. In particular, adding buttons on Collection pages to “View Similar Artists” or “View Related Artworks” can help to sustain user attention and engagement on Chinati’s website, as can similar buttons to “View Related Programs” or “View a Random Page.”
Optimize Google Analytics
With current Google Analytics data settings, we were unable to access data related to specific engagement with the carousel on Chinati’s homepage or engagement based on elements “clicked” throughout the website. We recommend that the Chinati Foundation integrate “Event Tracking” as part of their Google Analytics set up. Additionally, we recommend implementing the tracking of search terms on the website. This data can be helpful in identifying places where users have issues with the website or find it challenging to access a piece of data on the site.
Presentation and next steps
These final results were delivered to our client on May 6, 2021 in the form of 2 interactive dashboards, an Evaluation Report, and a short presentation. Our client was extremely enthusiastic about our results, and we met briefly to guide her through our interactive dashboards and final report. Though our client does not have any specific questions for us at the moment, we invited her to review these documents and get back to us with feedback or further questions at any point.
If I were to continue working on this project, I would likely begin by implementing “Event Tracking” and “Site Search Tracking” on Chinati’s Google Analytics account. These are quick and easy wins, and Chinati will start receiving relevant data the moment they are implemented. I would also schedule a follow-up meeting with our client to identify strategic goals and think through the best way to permanently house video content on Chinati’s website.
In regards to takeaways, I found that the limitations previously mentioned — specifically, the lack of data available to us — actually allowed us to hone our analysis and focus only on data of relevance to our team and client. In a sense, less data allowed us to go deeper in our analysis and maintain focus. We were forced to look only at the last year or so, and were barred from making any meaningful comparisons with Chinati’s old website or pre-Covid operations. Though I was curious to pursue these aspects of Chinati’s web presence, I found this limitation removed any “noise” or extraneous data from the process. Finally, Chinati’s relative lack of experience with digital analytics makes me hopeful that our findings and recommendations will be truly useful and actionable to them.
Despite the limitations previously mentioned, I am confident that our analysis, findings, and recommendations will help the Chinati Foundation craft a sustainable, scalable, and successful digital strategy. These recommendations will allow the Chinati Foundation to assess their success in educating their audiences about their collections, communicating with potential visitors about opening status and logistics, and sharing resources with students, Chinati members, and the local and international art community. Going forward, we hope this report provides actionable insights that result in increased engagement and enhanced user experience of the Chinati’s website and original video content.