Abstract: I joined a team of information experience professionals in analyzing digital channel traffic trends for The Henry Ford (THF). Through careful planning and structured processes, we pioneered a way forward for future THF analysts to better monitor the overall social network channels that are converting on their website. By the end of this project, we delivered a series of actionable recommendations and considerations for future data tracking and relevant research.
Introducing the Team: Four MS, IXD Students
Together, myself, Jichen Zhu, Lalita Shripad Chavan, and Işık Ertürk strategized over the most useful information that can be extracted from THF’s two main data sources – Google Analytics and Sprout Social. Currently, each of us are pursuing a MS in Information Experience Design at Pratt School of Information. We communicated remotely throughout the whole project duration, but we are planning our fist NYC in-person meeting soon.
Intro to The Henry Ford and Their Digital Analytics Landscape
The Henry Ford (THF) is a not-for-profit organization that aims to inspire people to learn from America’s traditions of ingenuity, resourcefulness and innovation to help shape a better future. It is a celebrated organization that encompasses four different sites: The Henry Ford Museum of American Innovation, Greenfield Village, Ford Rouge Factory Tour, and the Giant Screen Experience. Our team collaborated with their Head of Analytics & Business Intelligence, Jarell Brown, to learn more about the data that they currently had and their digital platform goals. For this project, they have us access to their Google Analytics account and shared 10 month’s worth of all of their social media data (exported from the social media analytics platform Sprout Social). Jarell explained that they already know that the website is where ecommerce conversions happen online, and therefore the number one goal of social media traffic is to drive audiences to the site, but only Facebook is converting audiences right now. At the outset of this project, there were innumerable questions related to social media channel traffic. For example, the THF collections department would like to know type of artifacts from the digital collection are getting the most likes on the different platforms. Marketing would like to know if there are other social media networks that are worth investing time and money into. They would also like to know how they can get more engagement with their posts, and how they can direct more traffic to the website for conversions… When peering into the depths of social media analytics, there seemed to be a limitless number of answers just waiting to be discovered.
If THF had questions about the viability of relying solely on Facebook for solid social media conversions, we had immediate answers for that, at least. Yes, other platforms should be explored. The demographic on Facebook is not as diverse as a total demographic from more channels could be. Our team also had immediate interest in following-up with the fact that the THF website was the only place digital audience could convert–could that be true? Were there no answers on platforms themselves? None of us had prior experience working with social media data at this level, and did know ourselves. From our team’s perspective, we quickly had two problems: 1, we had a vast about of website data from a well set-up Google Analytics account, tons of raw social media data from more platforms that we could study in the allotted time, and already very skilled analysts leading other areas (Facebook, email, and other digital platforms outside of this study), but not in ours. 2, the questions The Henry Ford brought forth to us were too interesting–we wanted to discover all we could!
Project Background
Tools and Data sources

Sprout Social is a social media management and intelligence platform that The Henry Ford has connected with all of its social media networks. All network data from Jan 1 – Oct 31, 2022 was downloaded and shared via Google Sheets.
Google Analytics tracks all THF website data and Data Studio (Looker Studio) was able to connect to both data sources. We learned that the ability to blend any data source on that platform (via simple table joins on a common metric), is highly recommended for monitoring social conversions side-by-side with website traffic and audience behavior data.
Project goals:
- determine which social media channels are generating the most valuable* traffic to the site
- understand customer engagement across traffic channels and networks
- provide useful and actionable recommendations based on our analysis
- *this is a term that is unique to THF and their digital strategy: “valuable” SM traffic to the site includes Sessions per Post, Session Duration / Bounce Rate, Goal & Ecommerce Conversion Rates, and total Revenue
TARGET digital CHANNELS:
- The Henry Ford website
- YouTube (no recommendations were made for this network due to time constraints and lower priority)
My Analyst Role:
- determine the most valuable traffic from social media to the site
- analyze acquisition, social media network referrals, campaigns, audience behavior data on the website
- connect website findings with social media platform practices and user engagement within the platform, as needed
- determine key traffic metrics and website KPIs
- build traffic, acquisition, behavior, and selected content performance monitoring dashboards for later THF analysts
TIME FRAME:
- 6 weeks (November – December 2022)
Team ACCOMPLISHMENTS:
- gain actionable insights into growing website traffic from viable social media channels
- gain actionable insights into how to improve engagement and click rate on Facebook and Instagram
- provide recommendations on how to improve engagement and traffic to the website from Twitter
- create a useful and sustainable data dashboard on Google Data Studio / Google Looker Studio for future use by THF analysts that tracks, 1) Social Media Overview by network, 2) Selected Content Category SM Overview (engagement stats only for content categorized as Artifacts or their related Events/Exhibits, 3) Overall Website Traffic & Acquisition, and 4) website traffic from social media channels that visits any of the Selected Content categories
Delving Into a Wide-Ranging Scope: Overcoming Common DA Challenges
WE avoided data overload from the amount of raw data that we had at our disposal
We had to try to jump in to analysis a few times before we understood how to divide the workload.
First, we tried to divide analysis roles by social media channel, but that was too much of a disconnect from our overall goals and too abstract for us at an early stage.
For our second initial analysis attempt we broke down the data strategically per team member: one person (me) would get an overall picture of acquisition data on Google Analytics, and the three others would each look for overall patterns on one social media channel per person.
In terms of workflow, understanding our responsibilities to the group and shared end-goal while also having the space to work independently was very helpful for us all. I believe at this stage we developed a stronger sense of trust with each other, which remained essential throughout the collaborative project.
None of us started this project feeling confident in our social media skills but grew to be specialists
Everyone on the team had previously conducted thorough social media engagement analysis. However, prior analyses had much more limited in scope (only one or two platforms, for example), and this DA project involved a more subtle understanding of the user: their goals on each platform, their likes / dislikes, and why they would want to visit the website during their social media session in the first place. We all had the skills: the question was how to best digest all of the data and all of the surrounding questions.
Our established workflow was an effective way to divide close analysis of three social media platforms (Facebook, Instagram, and Twitter) and website traffic data (via Google Analytics) simultaneously. We found the important data easier to combine after each of us became specialists on one specific topic.
For me, this meant temporarily narrowing my focus to Google Analytics reports.
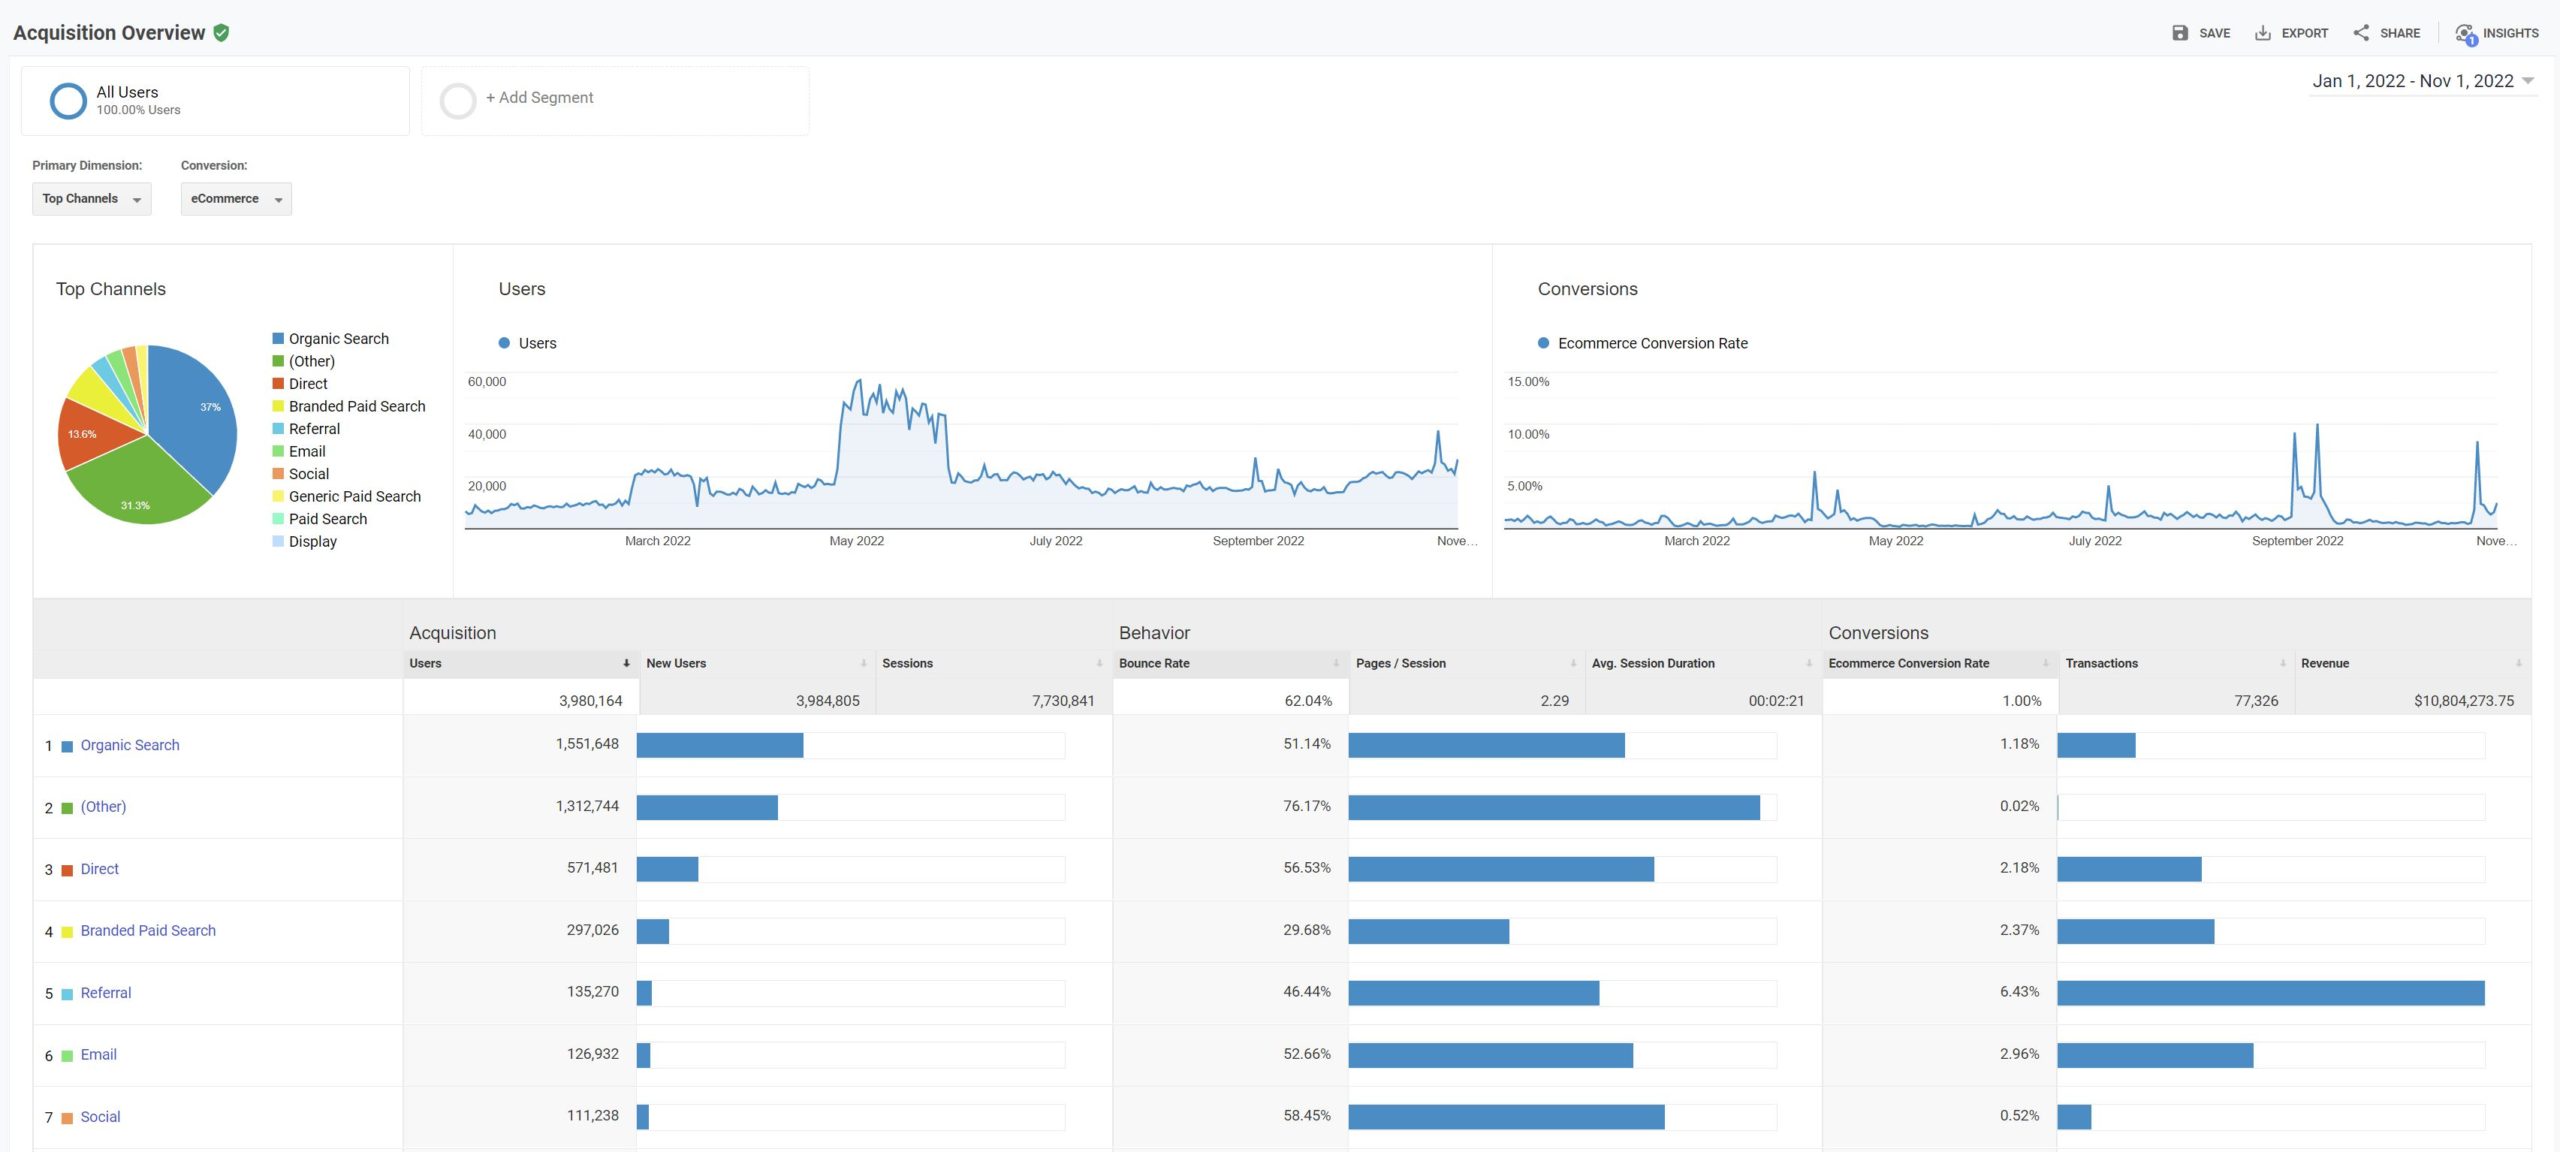
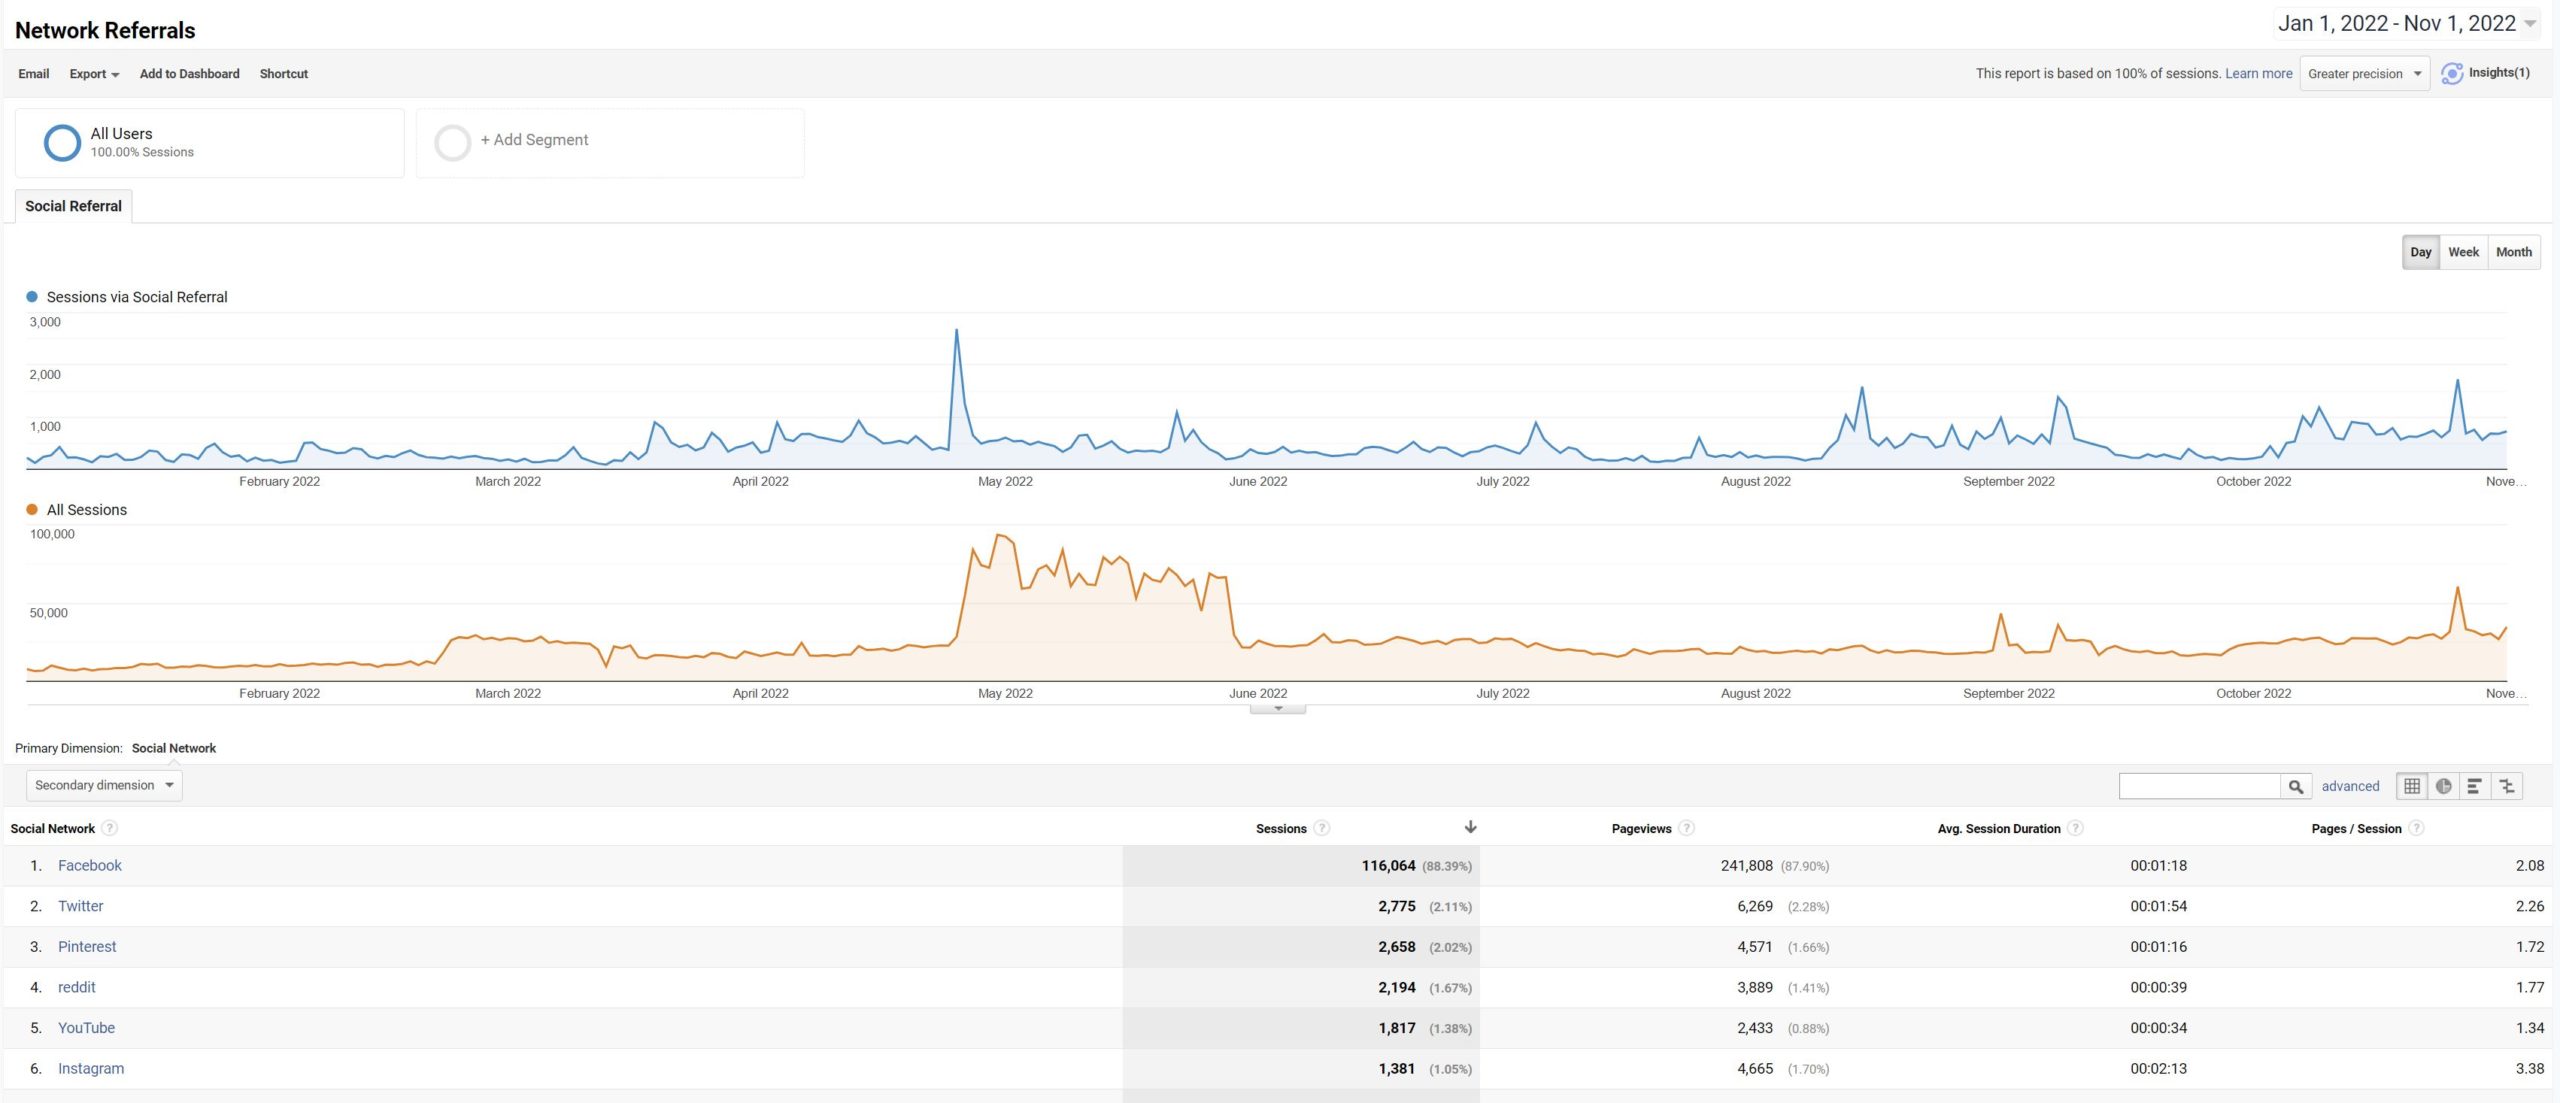
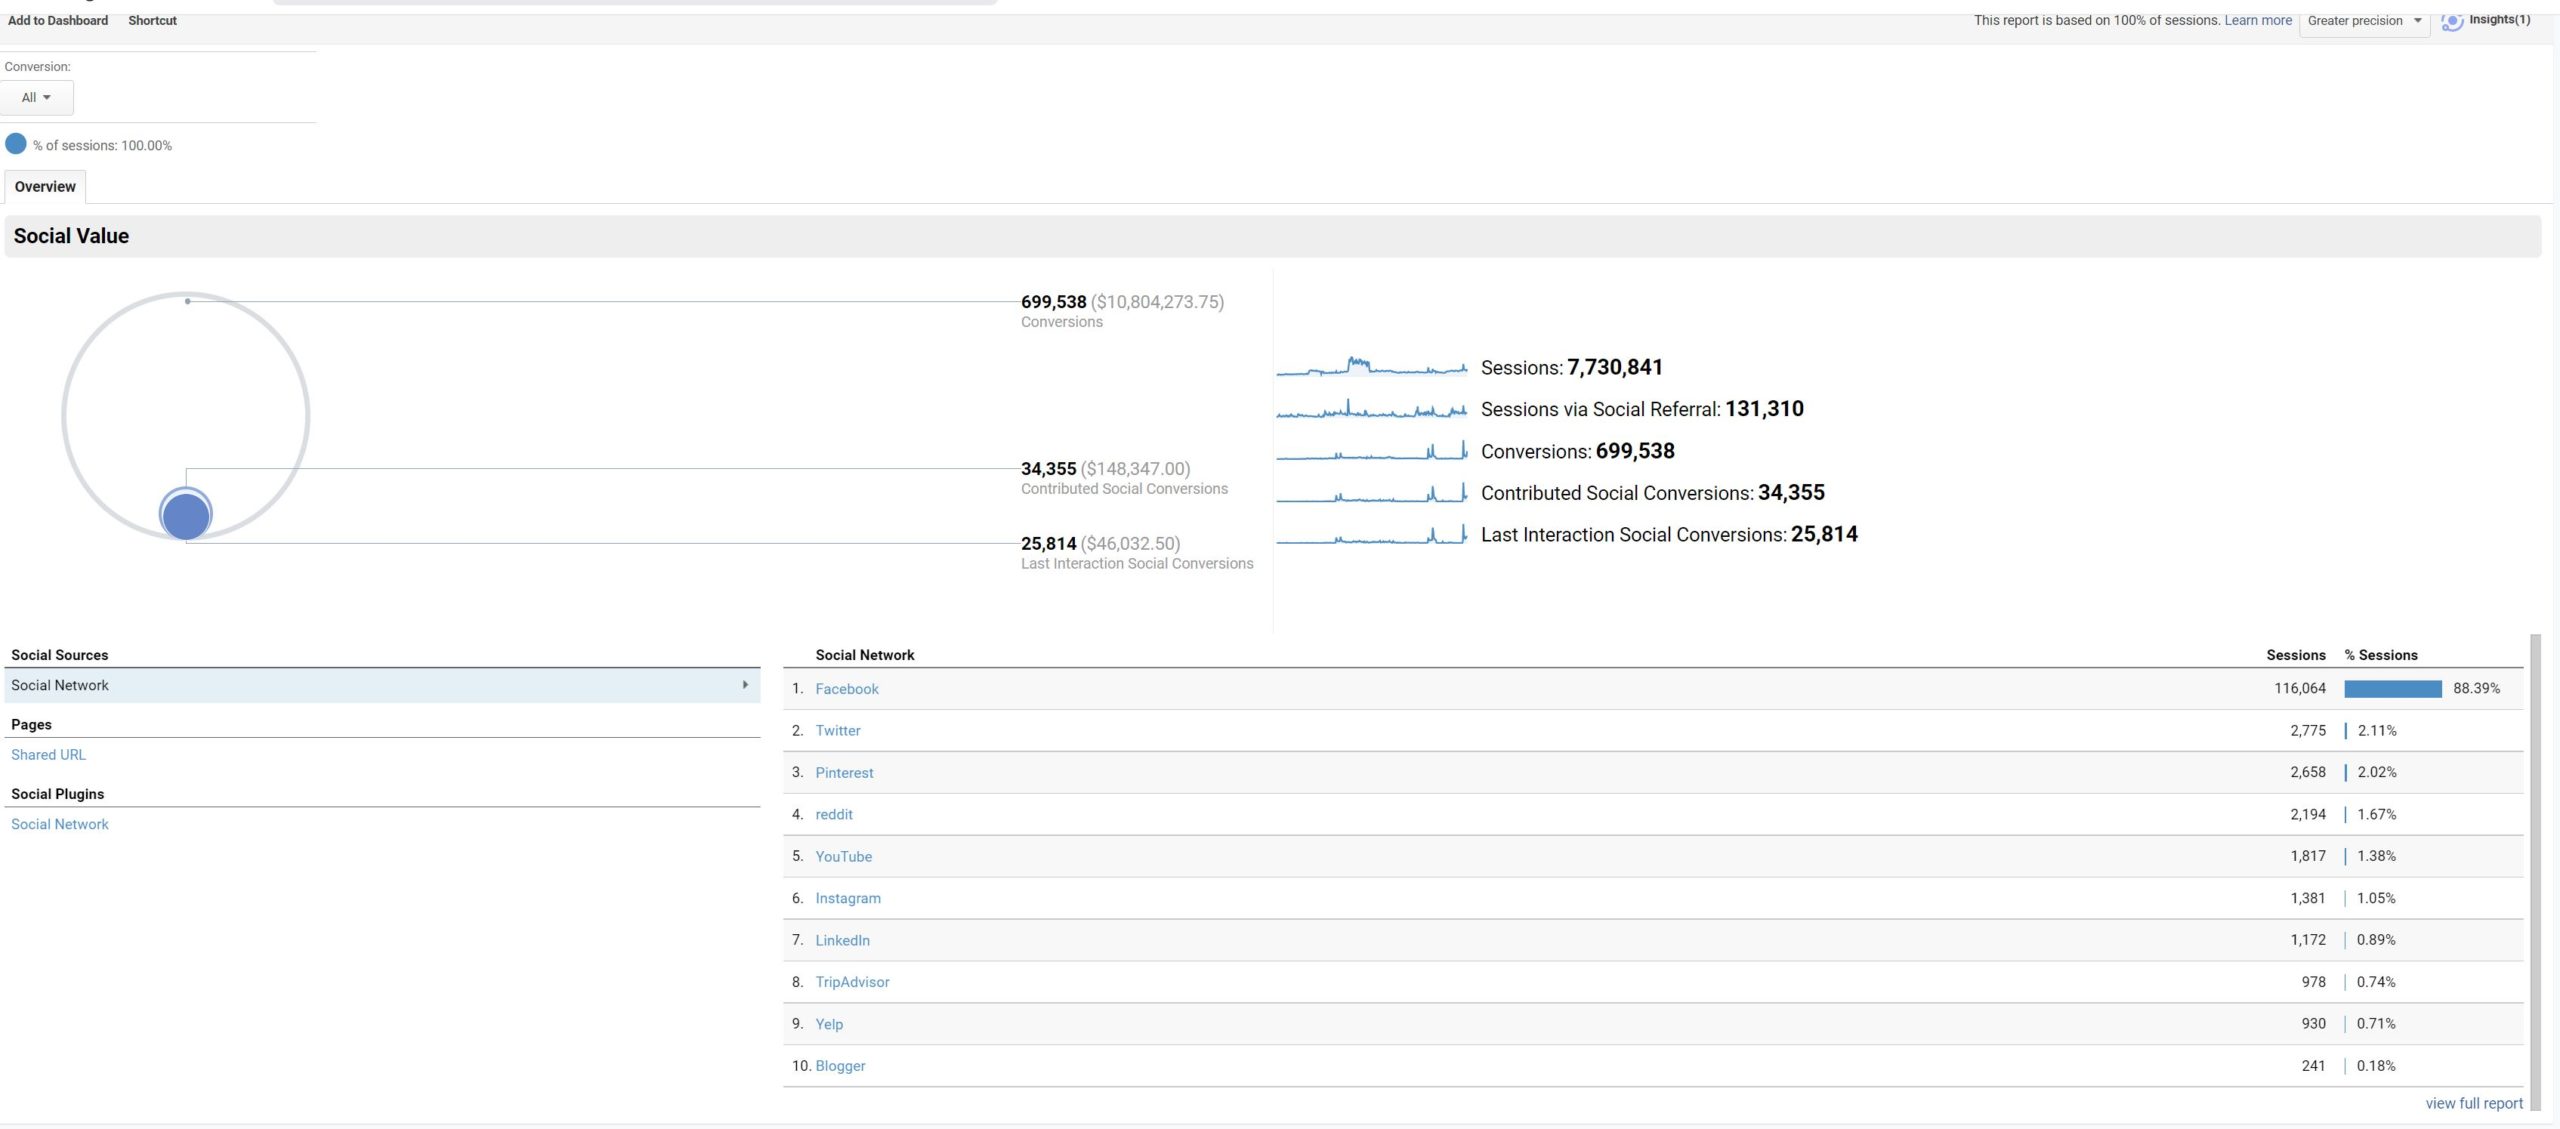
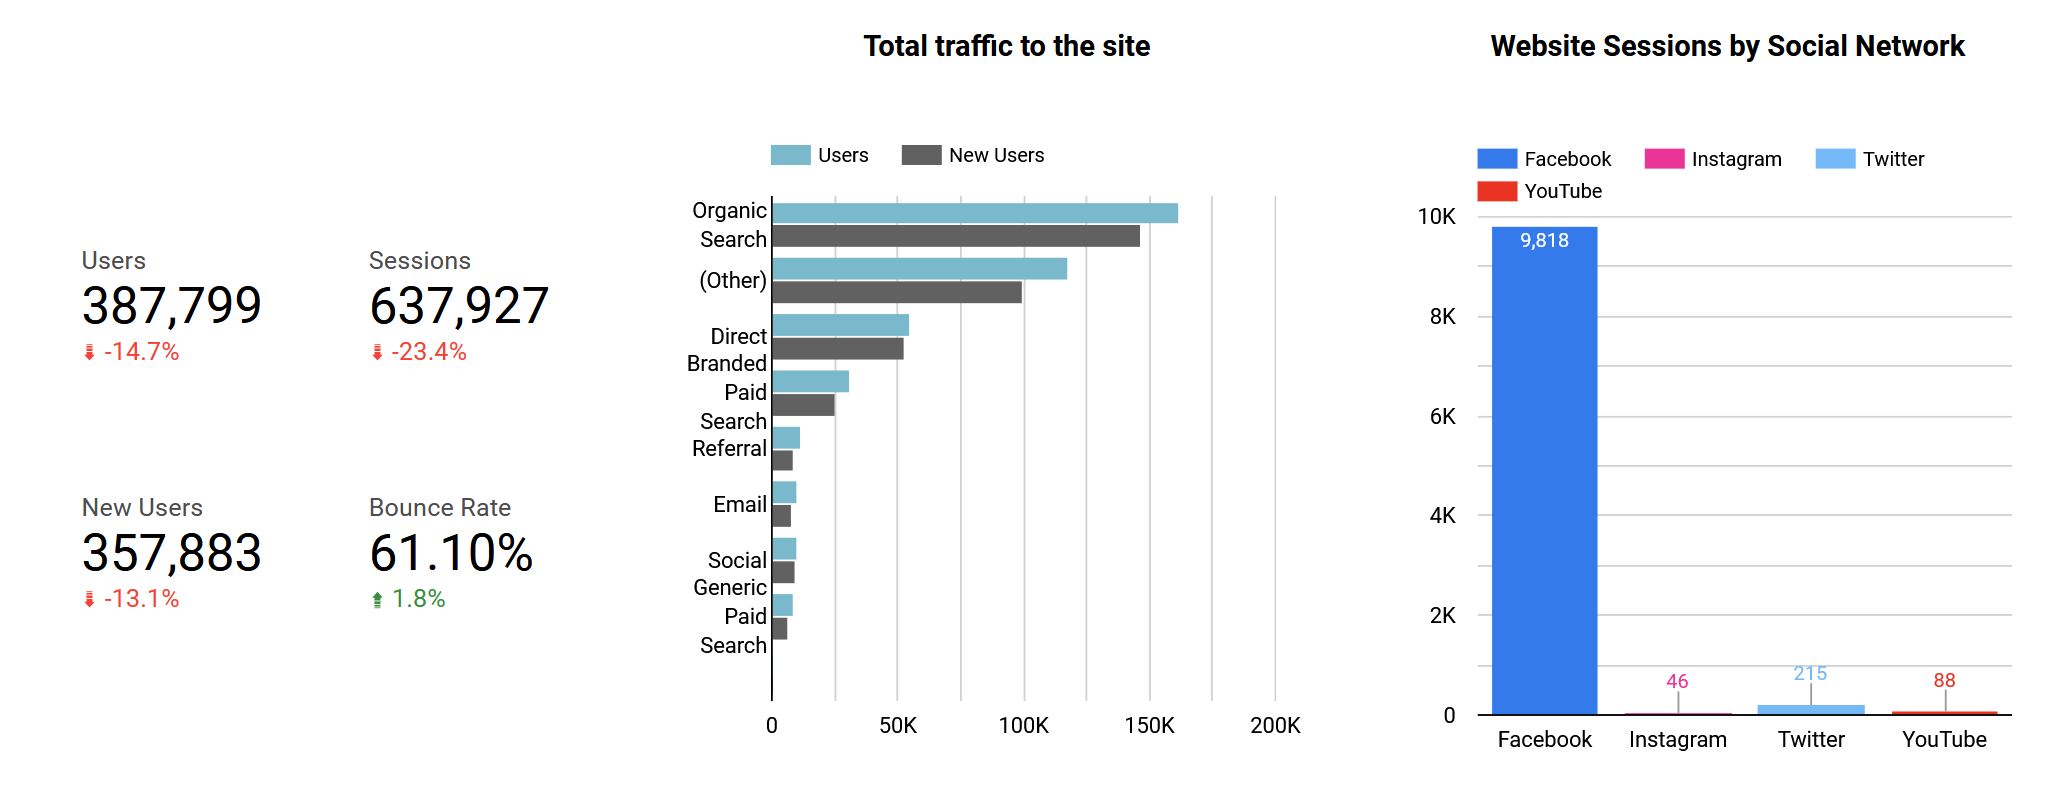
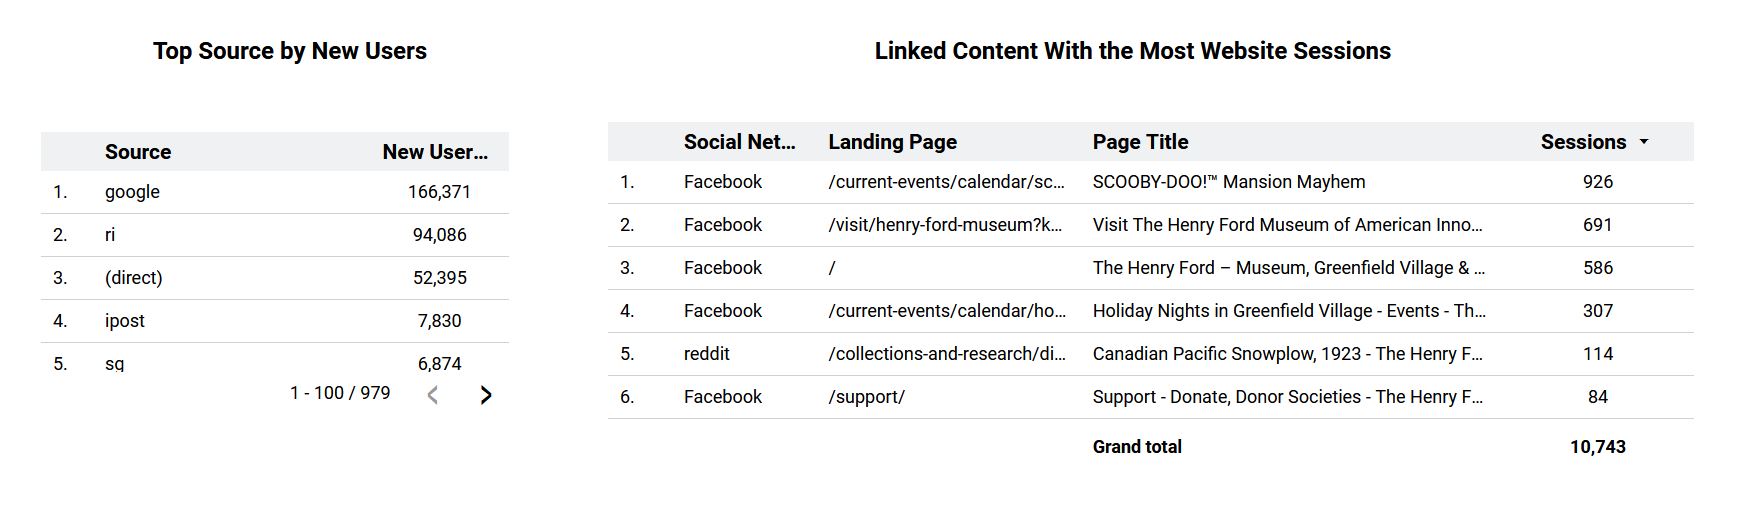
Data from the Acquisition and Social pages gave me a good foundation for our traffic findings: namely, Facebook is essentially the only active contributor to website traffic right now, generating almost 90% of traffic and the majority of network referrals. THF campaigns and referrals launched on Facebook are raising awareness of objects from the collection and get people to buy tickets to the museum and events on the website. However, bringing in a fraction of new website users, social media channel traffic still needs a lot of help if it will contend with organic search traffic. Investing in other platforms may be key.
From here, I was able to start drafting our website channel dashboard on Google Data Studio that would combine with other social media-related traffic reports to continuously provide meaningful reports to analysts at THF.
Learning How to PRESENT DATA HOLISTICALLY, RATHER THAN IN A VACUUM, FOR future content strategy Was A Big Task – And We Did IT
For the first 4 weeks of the project, team mates had delved in to their specific DA categories, and were becoming experts on parts of the whole. In order to bring our analysis to life, we would have to come together not only to share our findings thus far, but also to look into other data sources and empathize with social media users.
For me, this meant uncovering investigating insights into the platform that I saw potential website traffic in – Instagram.
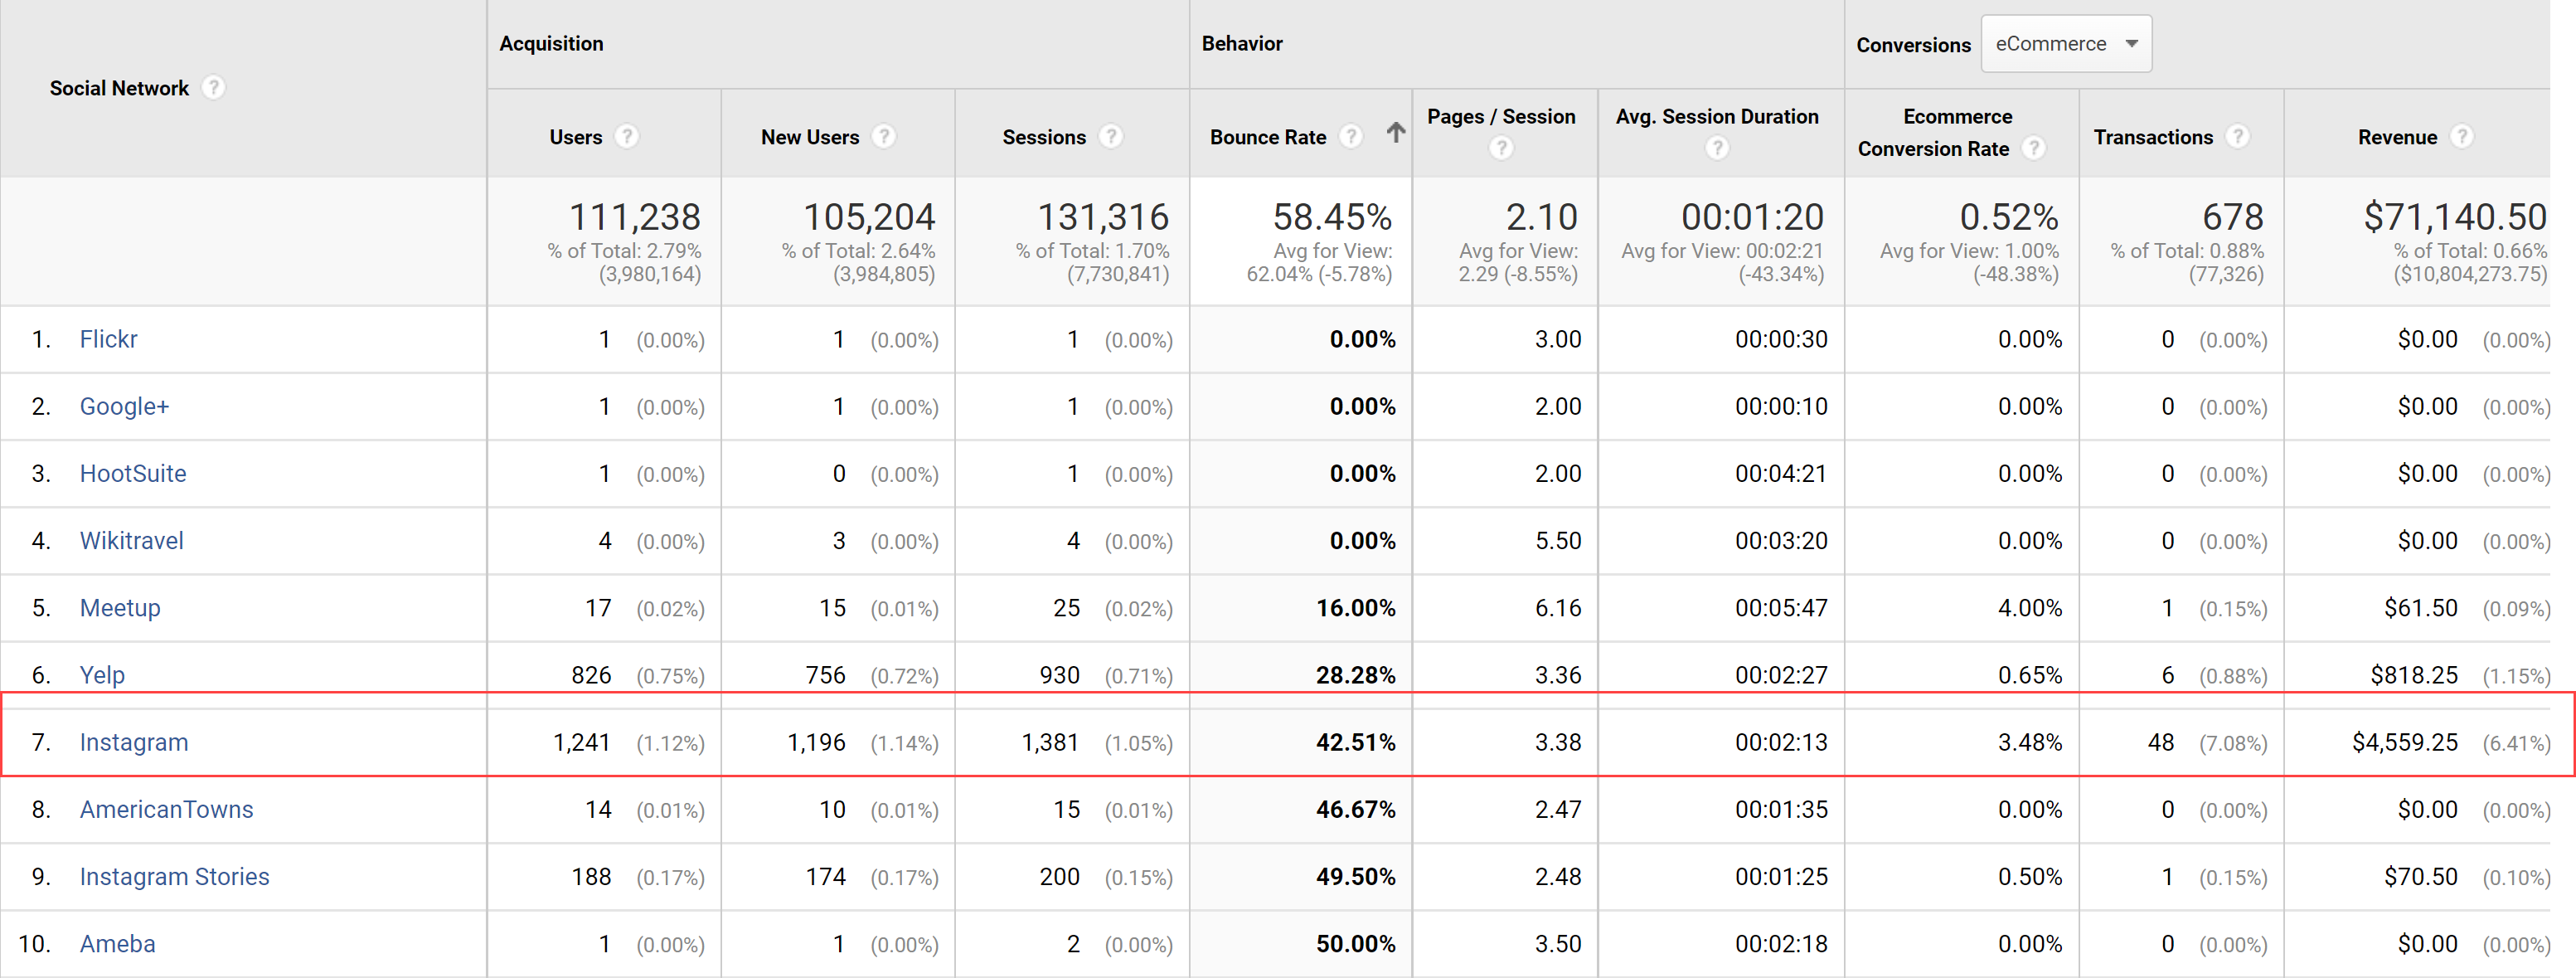
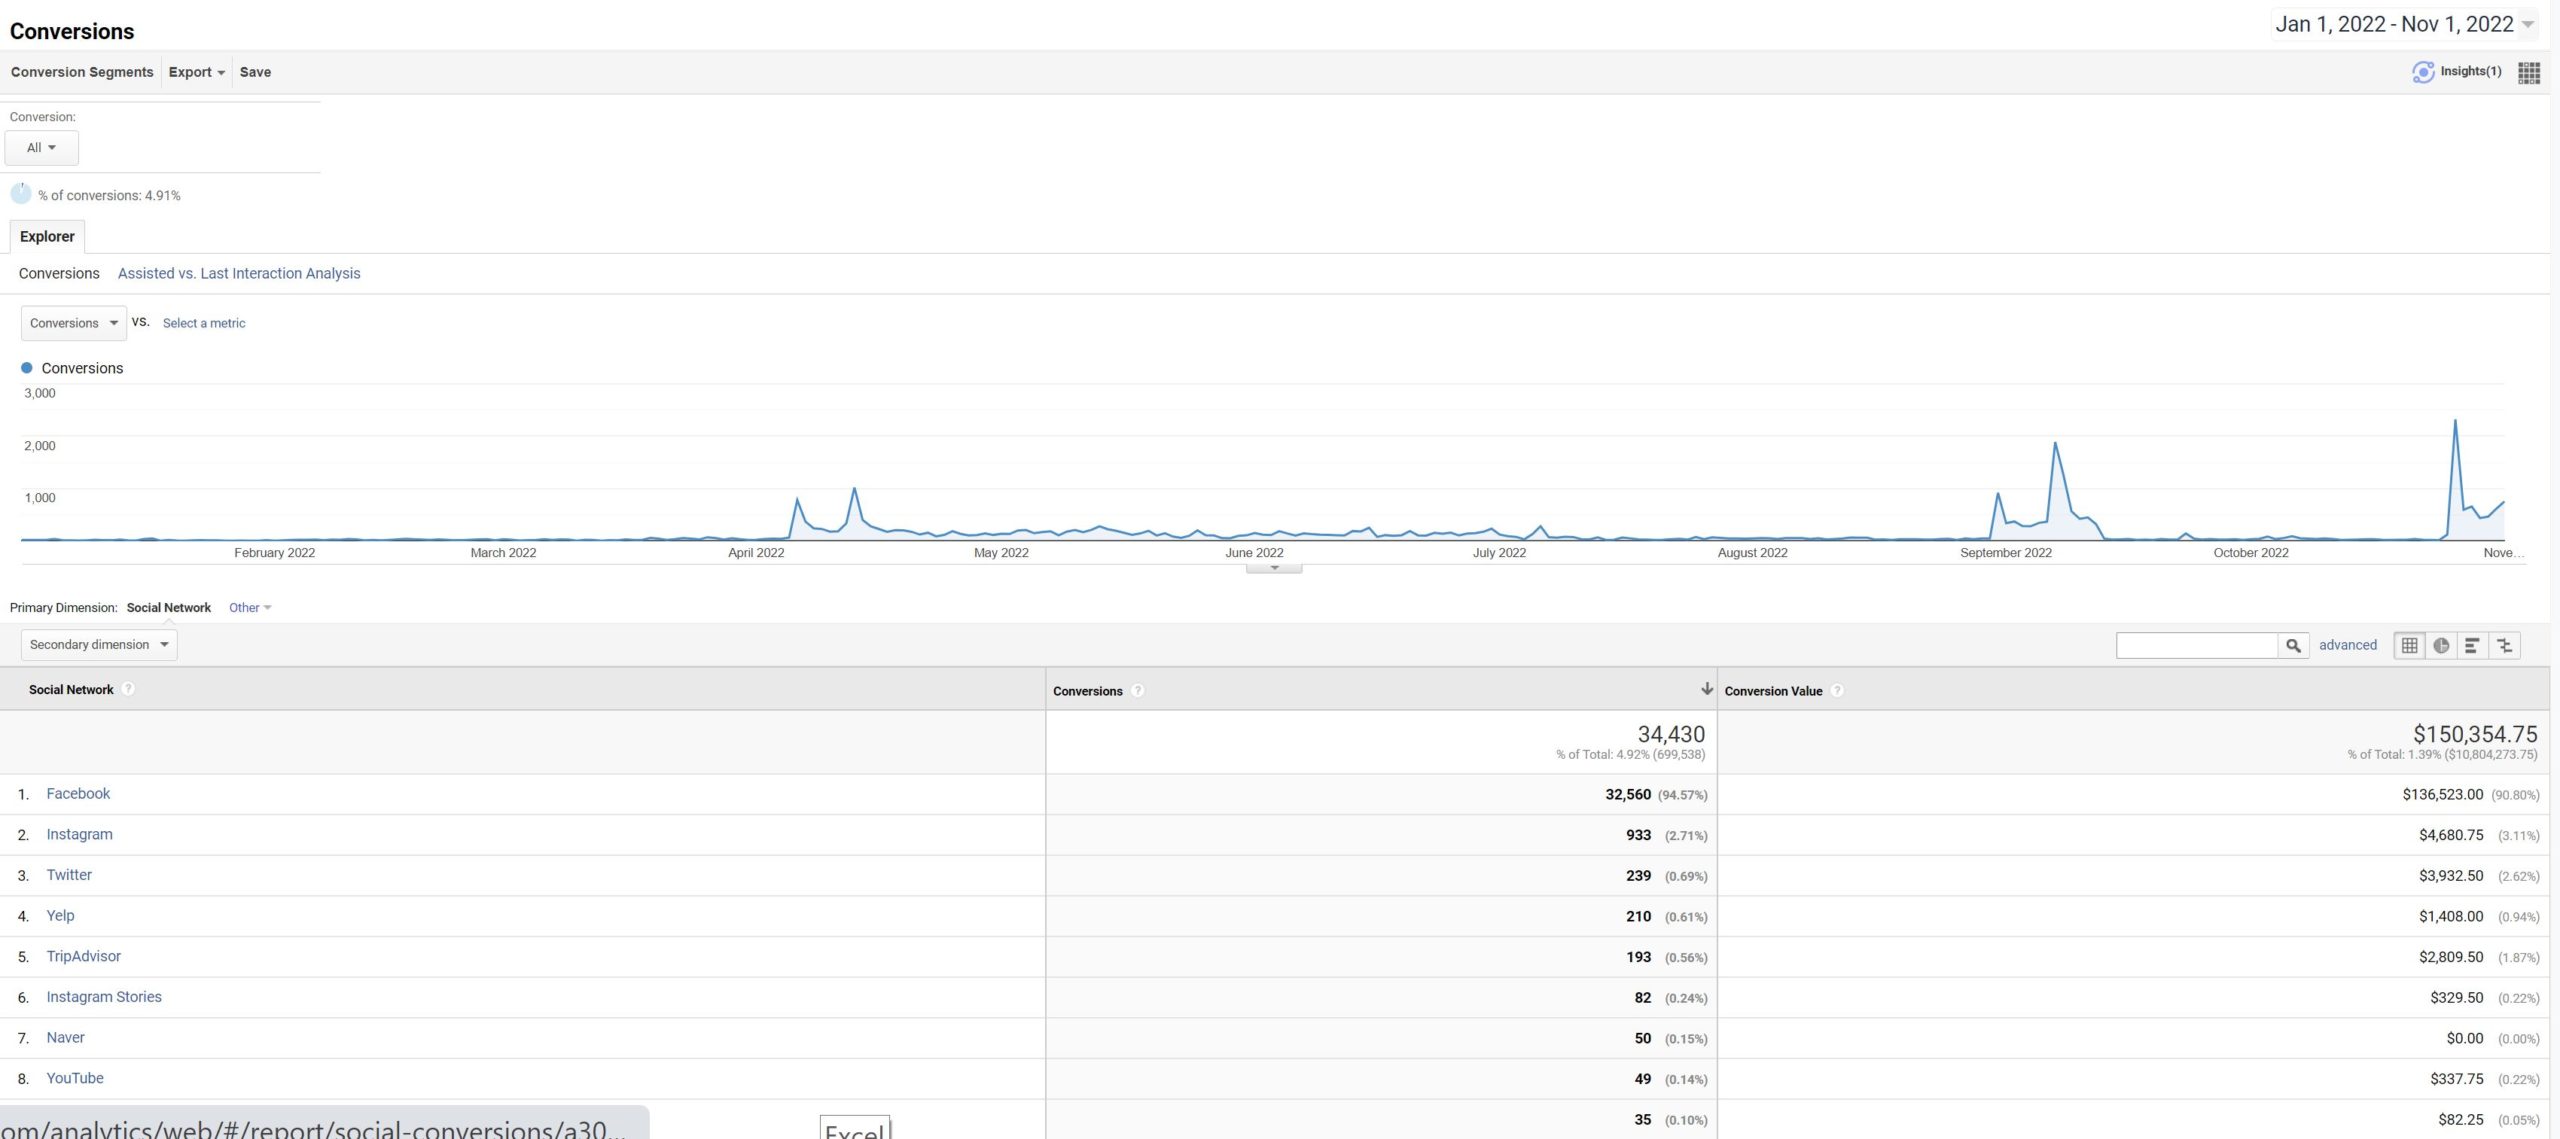
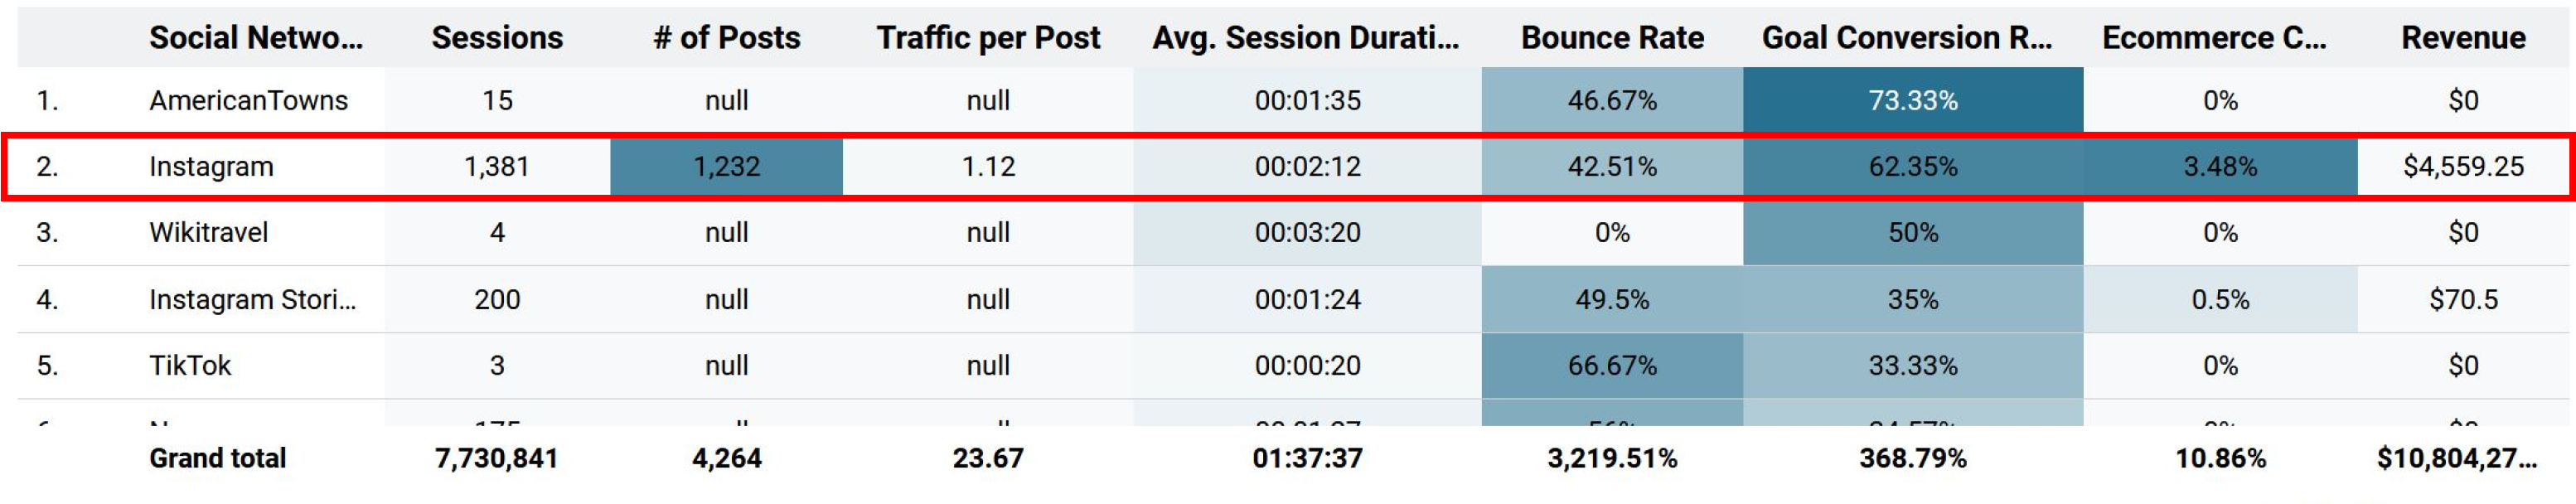
Based on traffic reports, Instagram is the number two provider of the most website sessions from any major social networking channel that THF expressed interest in investing more time and energy into. Behavior reports on GA show that Instagram has the lowest bounce rate of any social media channel, good pages and session statistics, and very high conversion rate. For answers on what type of content is being posted to Instagram versus Facebook, and the two platforms respective reaches, I looked to our Sprout Social data and collated data from teammates:
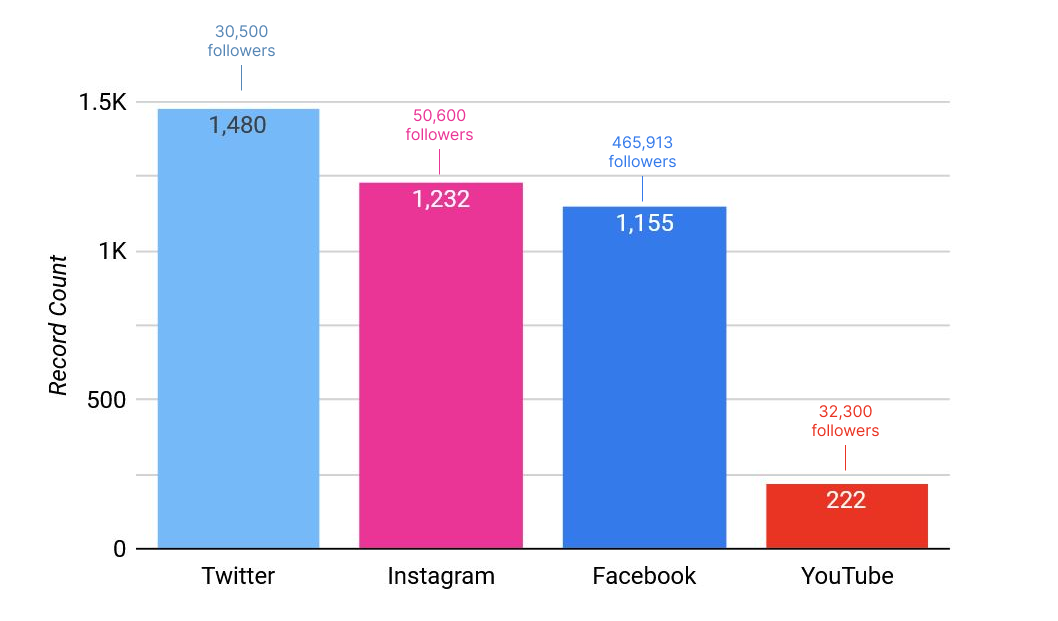
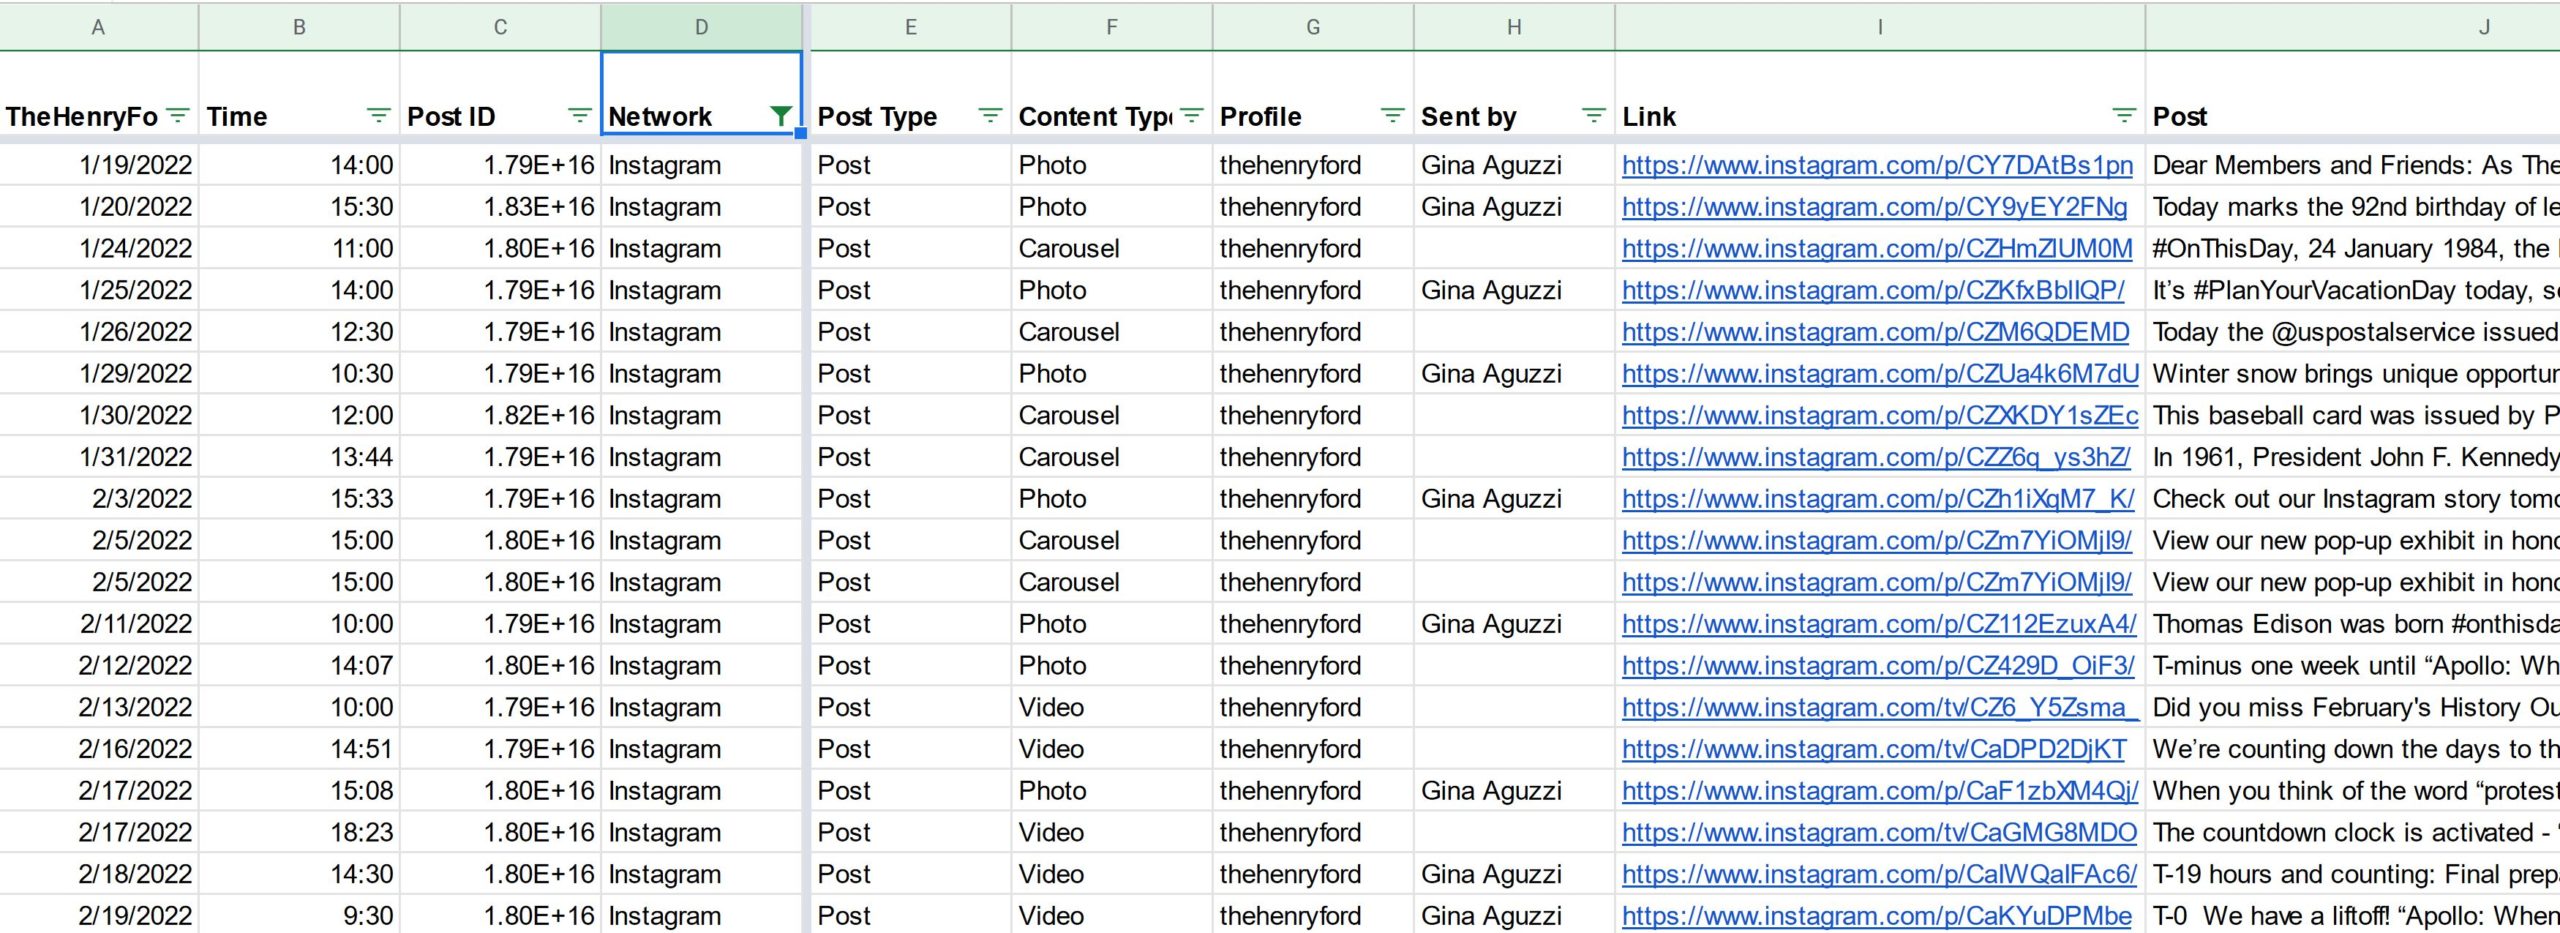
Our Sprout Social exported data showed what type of posts were being sent to Instagram, what captions there were, and all performance data. For our social media dashboard, the team has collated post amounts per network. I added reach numbers (followers) to the chart to get a better idea of each channel was performing in light of 1) the number of posts made in the given time period, and 2) the comparative reach of the each platform. Combining information from both data sources allowed me to create more meaningful widgets for the website traffic dashboard:
From this finding, I recommended to THF that they launch a strategy to increase followers on Instagram, beginning with posting more Reels to target similar audiences to their current followers from organic search and launching more targeted awareness campaigns, similar to those currently targeting Facebook. The Meta (Facebook) algorithm is always shifting where it’s priority lies in terms of what content gets the most promotion, and right now Reels is heavily prioritized in terms of content type options.
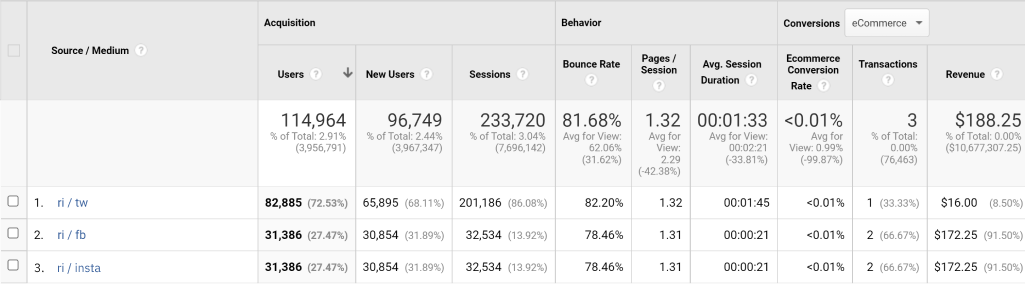
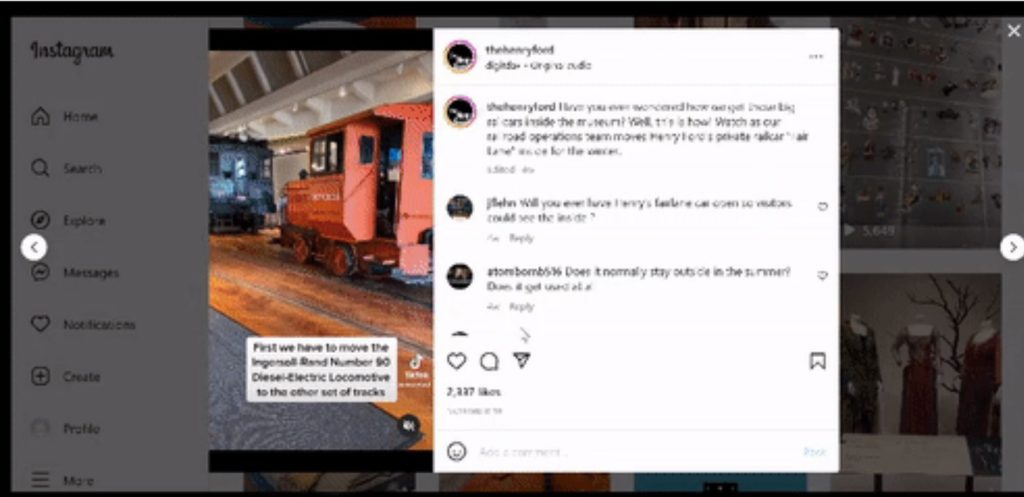
In traffic reports from all social media channels, we also see that Instagram, while sending quality traffic, is not sending much traffic. The ratio of website sessions begun from Facebook traffic, compared to those from Instagram’s, is 100 to 1. For answers to why these numbers could be so low, and yet behavior reports show that Instagram audiences are valuable converters, I looked to the platform itself. I found that Instagram does not provide many access points for audiences to navigate to the website, even if they were open to it. This is a big limitation of the platform itself, as all social media marketers will know. But there are strategic marketing moves that can combat this issue.
My first recommendation here is to consider using a tool that allows users to find links related directly to posts that they like, such as Linkin.bio. Link Tree has a small and finite amount of links that it can provide users, and not all of them will necessarily be able to lead to the website (as in the case of THF, who also has many other opportunities to offer its audience beyond the site and ticket purchasing). Below are two comparison images of LinkTree (THF) and Linkin.Bio (NatGeo) layout and following functionality:
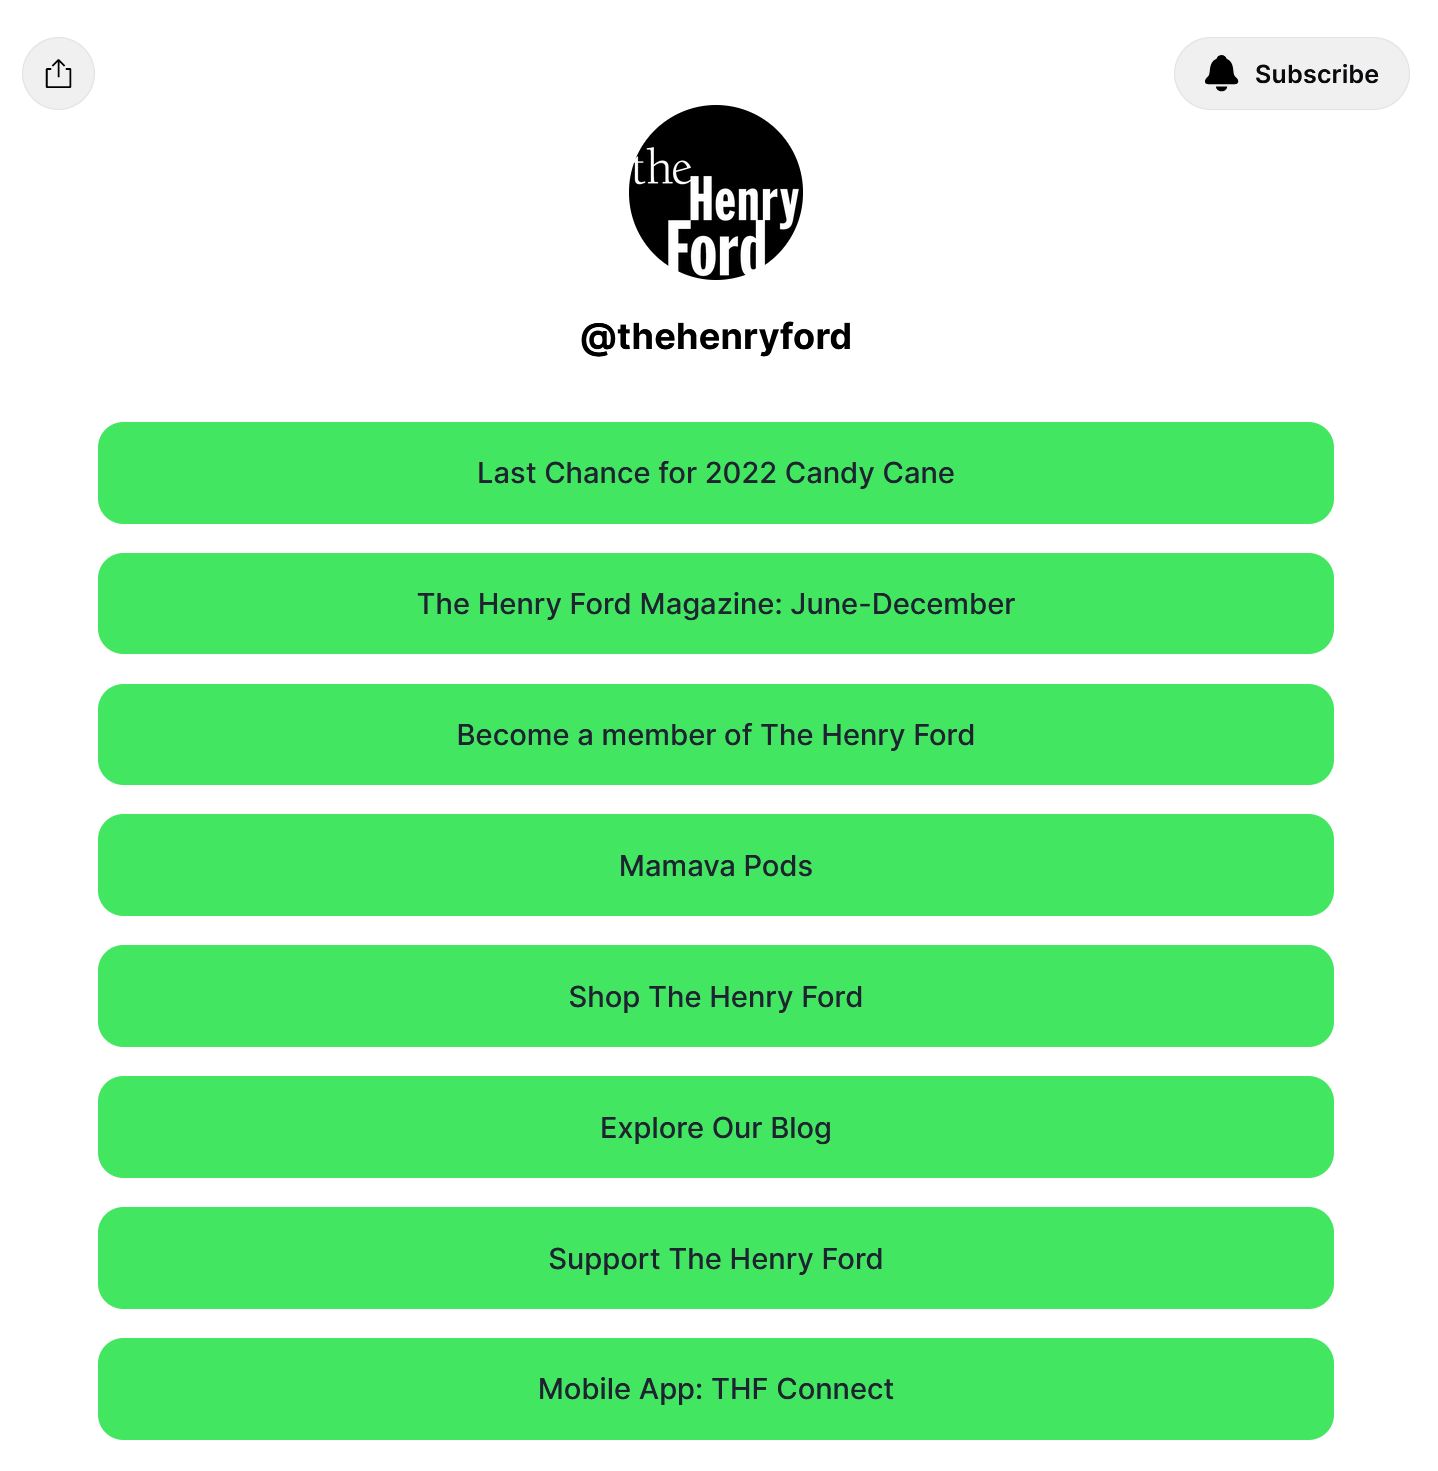
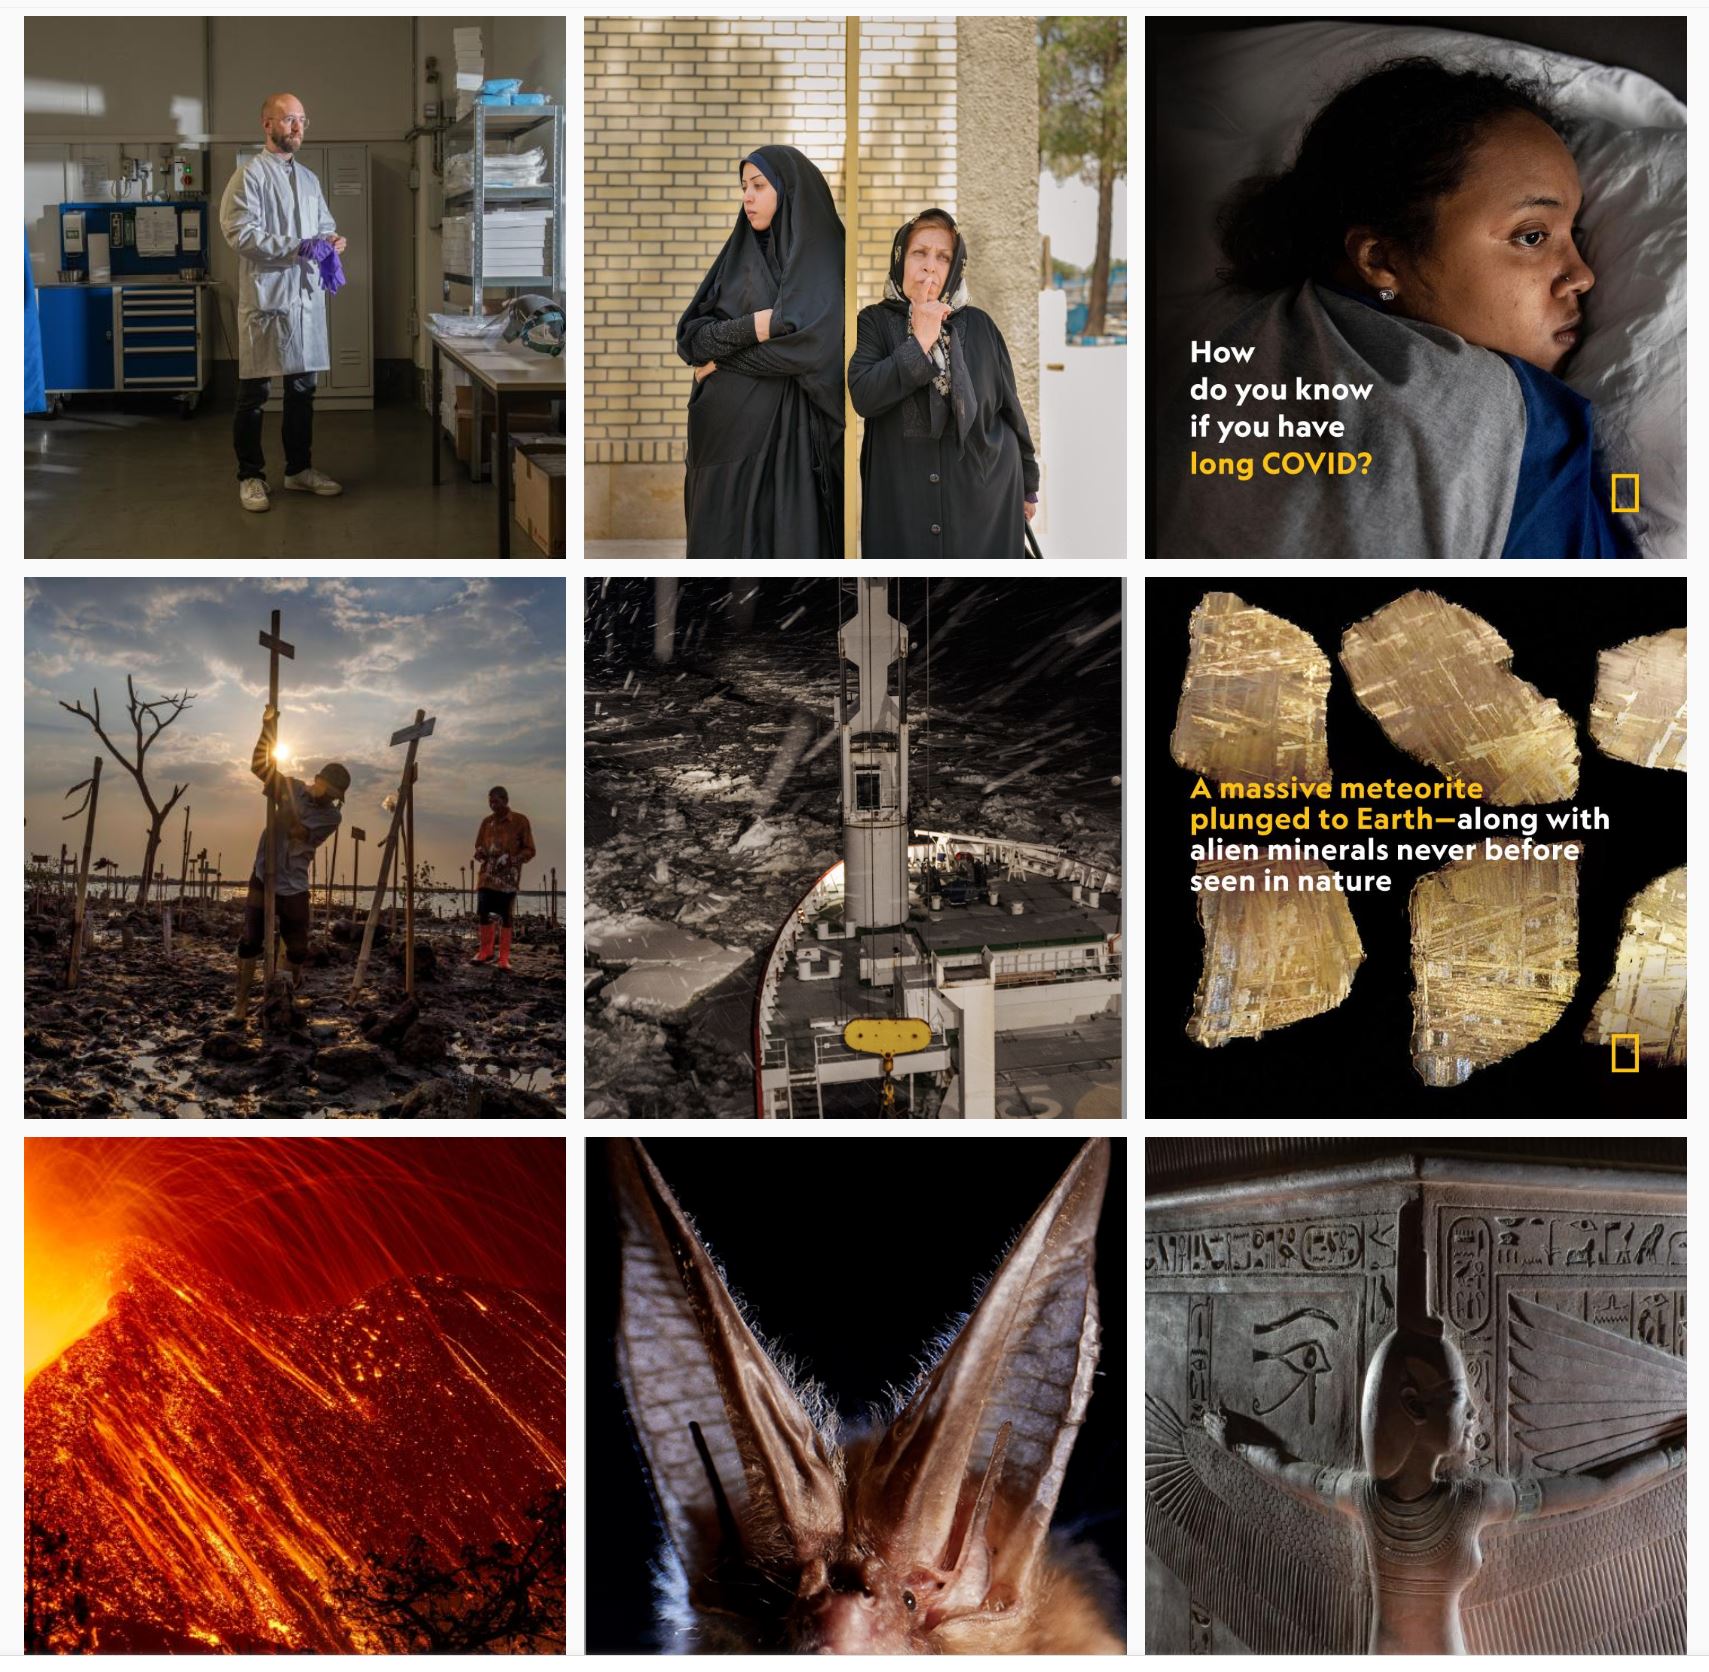
Linkin.Bio by Later designs a page of links that mirrors the channel’s posts. This way, users have the ability to easy find and engage with the content they are most interested in. It is a good tool if there are many different pages that you want users to view. For THF, this means they can better serve their goals of promoting museum ticket pages, individual artifact pages, special event tickets, and more. There is no limit to the amount of links they share.
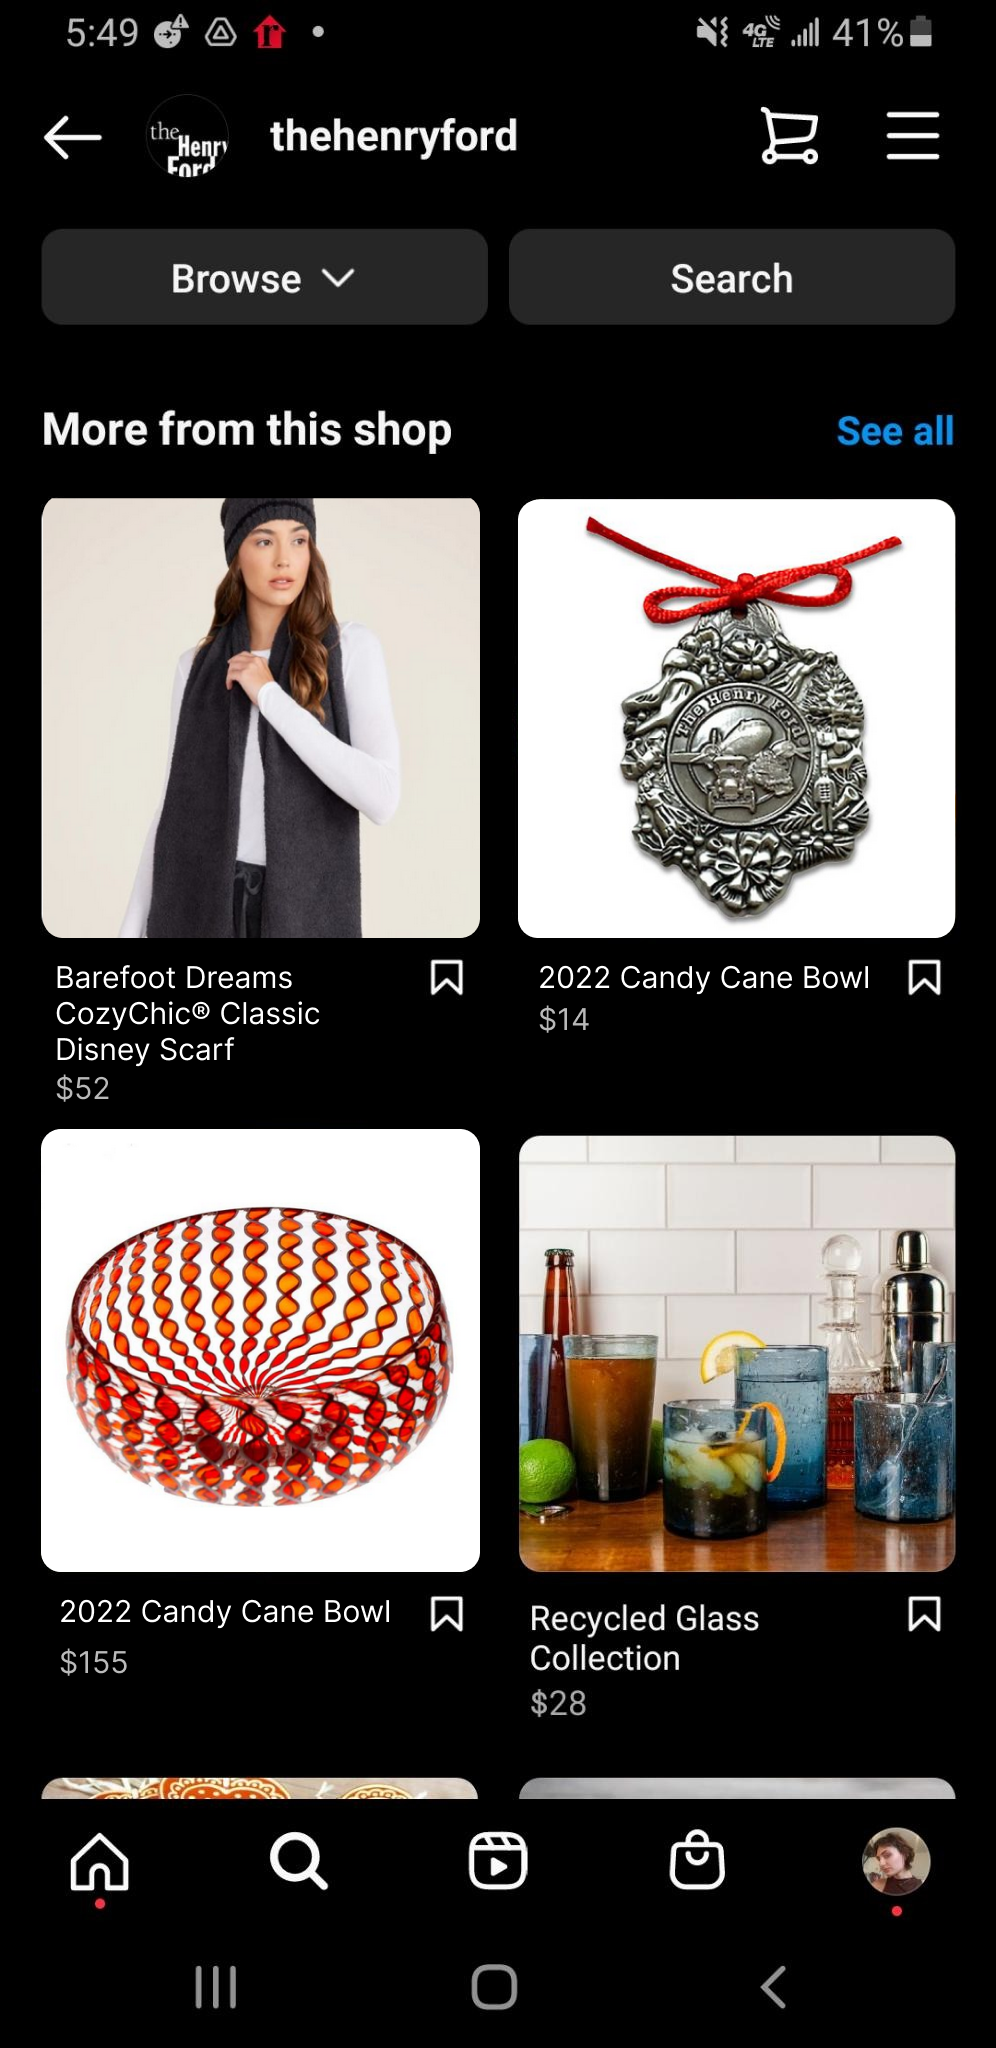
Website traffic can also be directed from Stories (via URLs pasted directly to them – though they expire), and the THF Instagram Shop page. However, when viewing their current and saved Stories, I saw that not many links were shared. And when using the Shop myself, I discovered that three out of four of the first links were expired or the items were sold out. My recommendation to THF here is: give Instagram followers access to more direct links on the website. Post links to the site on Instagram Stories and in the Shop.
We Presented a Much Fuller Picture of Social Media Network Engagement and Their Traffic Patterns to the Website
At the end of this project, we presented three deliverables to The Henry Ford: a full break-down report, a slide deck explaining our methodology, findings and recommendations, and an interactive data dashboard connected to both Google Analytics and Sprout Social for their own future use. Our SM data from Sprout Social was downloaded onto spreadsheets and then connected to Data Studio, so we also recommend that future analysts connect Sprout Social directly to continue accessing the same widgets.
Jarell and team were very happy with the recommendations, and reported interest in following up with our recommendations for both future social media analytics tracking (with combined data on Data Studio and other best practices we recommended to easier track social media engagement), and implentation for improved engagement on the respective platforms and how to direct it to the website.
Next Research Steps We are Curious About
This project marked the first attempt to view THF social media channel traffic data holistically. We only examined data from two sources: the networks themselves (Sprout Social) and the website (Google Analytics). There are other tools and platforms that intersect with the project, but which fell out of scope for this study. If we had another opportunity, or more time, we would examine the following:
- Analyzing LinkTree data to see what traffic is being generated from Instagram through this tool, and how valuable it is
- Exploring TikTok reach and performance for trends (because re-posted TikTok videos tend to make the best Reels, and are for THF)
- Identifying the correlation between YouTube’s relatively high traffic count to the website, high bounce rate on landing on the website, and low user engagement on the platform
- Exploring Pinterest as a viable additional platform to begin strategically posting on (it’s platform seems well suited to posting about collection artifacts, supports an audience that has proven to be more open to ecommerce during SM sessions, and THF website gets a relatively high amount of user sessions from this channel)