The Smithsonian American Art Museum (SAAM) has the nation’s first collection of American art. According to their website, the museum prides itself on their collections that “captures the aspirations, character, and imagination of the American people throughout three centuries.”
SAAM’s mission is dedicated to collecting, understanding, and enjoying American art. As it suggests, the museum has more than art collections to offer. Their national education programs provide distance learning to schools and the public. This includes in-depth professional development programs that focuses on teaching techniques for integrating art across curriculums for educators as well as an array of curriculum resources online.
To allow professional educators and casual browsers to access their educational resources with more ease, SAAM is developing a searchable database for their educational resource, which includes various filters across different categories.
This project aims to work with users to explore how the search page functions and search for any improvements, especially concerning the filter categories, result page layout, and individual detail pages for each educational resource.
Part 1: goals, prototype, and metadata
Client kick off day was on Mar 22, 2023. The meeting lasted about 40 minutes, and Alex Tyson from SAAM went out of her way to fill us in as to where they are with the project. She also revealed crucial information that was not in the project document that they provided us: the educational resource page is not ready. It is still a prototype in Figma, not yet interactive in any shape or form. The client is especially interested in getting feedback from users regarding the filters and course categories they used on the search page. In their words, they are wondering if “the way we model these resources (which include lesson plans, videos, activities, and more) serves the needs of K-12 educators, guardians, and learners.”
Based on the information we had at hand, we met as a team. We decided that in order for us to test their filter, categories, and language, it is important to have the original metadata associated with each educational resource. We drafted an email asking for their metadata file, and encouraged them to create a testing site for the search page before we start user testing, since it will yield better results.
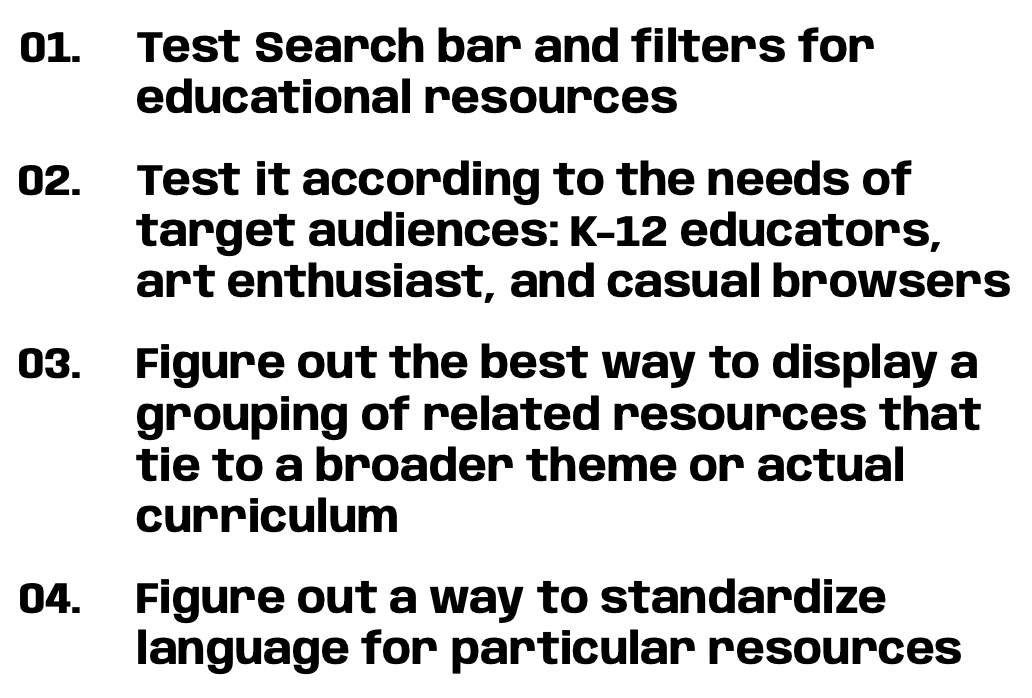
Alex really came through for us by providing the metadata file and a working prototype. We combed through what they already set up for the filters, and detailed resource page. Once we combined our findings with their objectives, we came up with the 4 goals we would love to achieve by the end of the project:
Part 2: methodology, innovation, and team bonding
It is not common for people to test the filters of their website during user testing. For SAAM, this means that they want to make this page to serve their identified user groups: K-12 educators, art enthusiasts, and learners. They want to make the filter intuitive, the language consistent, less jargony, and well organized. For us, as experts in user testing, this means we have to figure out ways to measure how people interact with filters during user interview, see how they associate metadata with different educational resources, and find out how usable their website is.
Our teammate Mehika Singhal and Cici Lin came up with the idea of incorporating card sorting as a part of moderated user testing. Card sorting is a UX research method in which study participants group individual labels written on notecards based on criteria that make sense to them. According to Nielsen Norman Group, this method uncovers how the target audience’s domain knowledge is structured, and it serves to create an information architecture that matches users’ expectations.
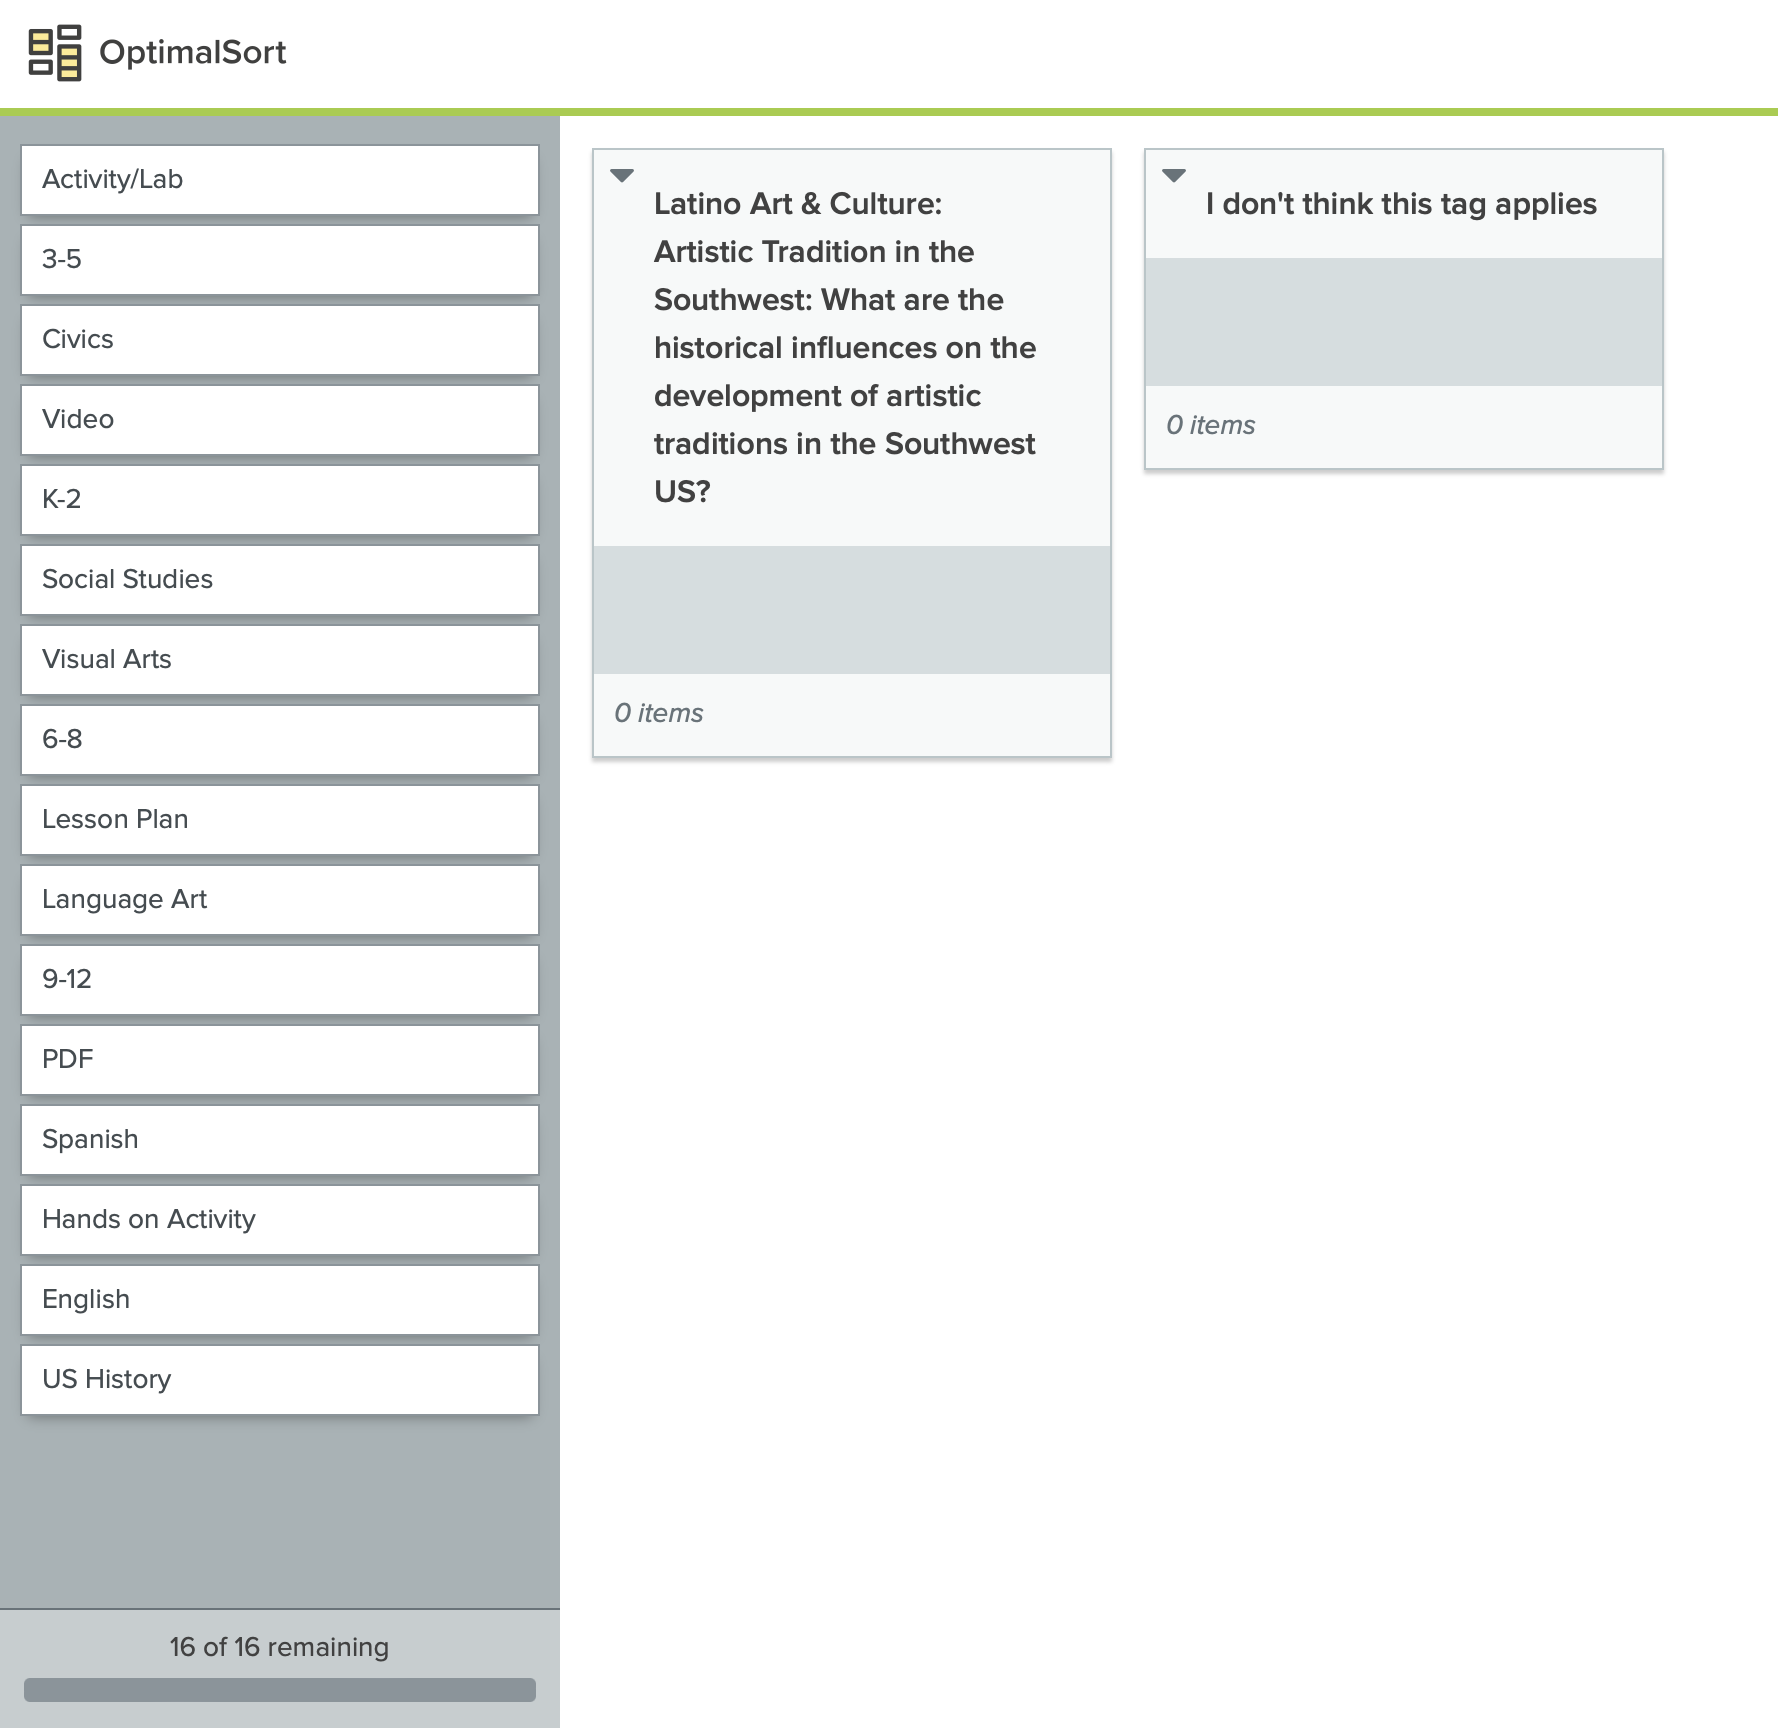
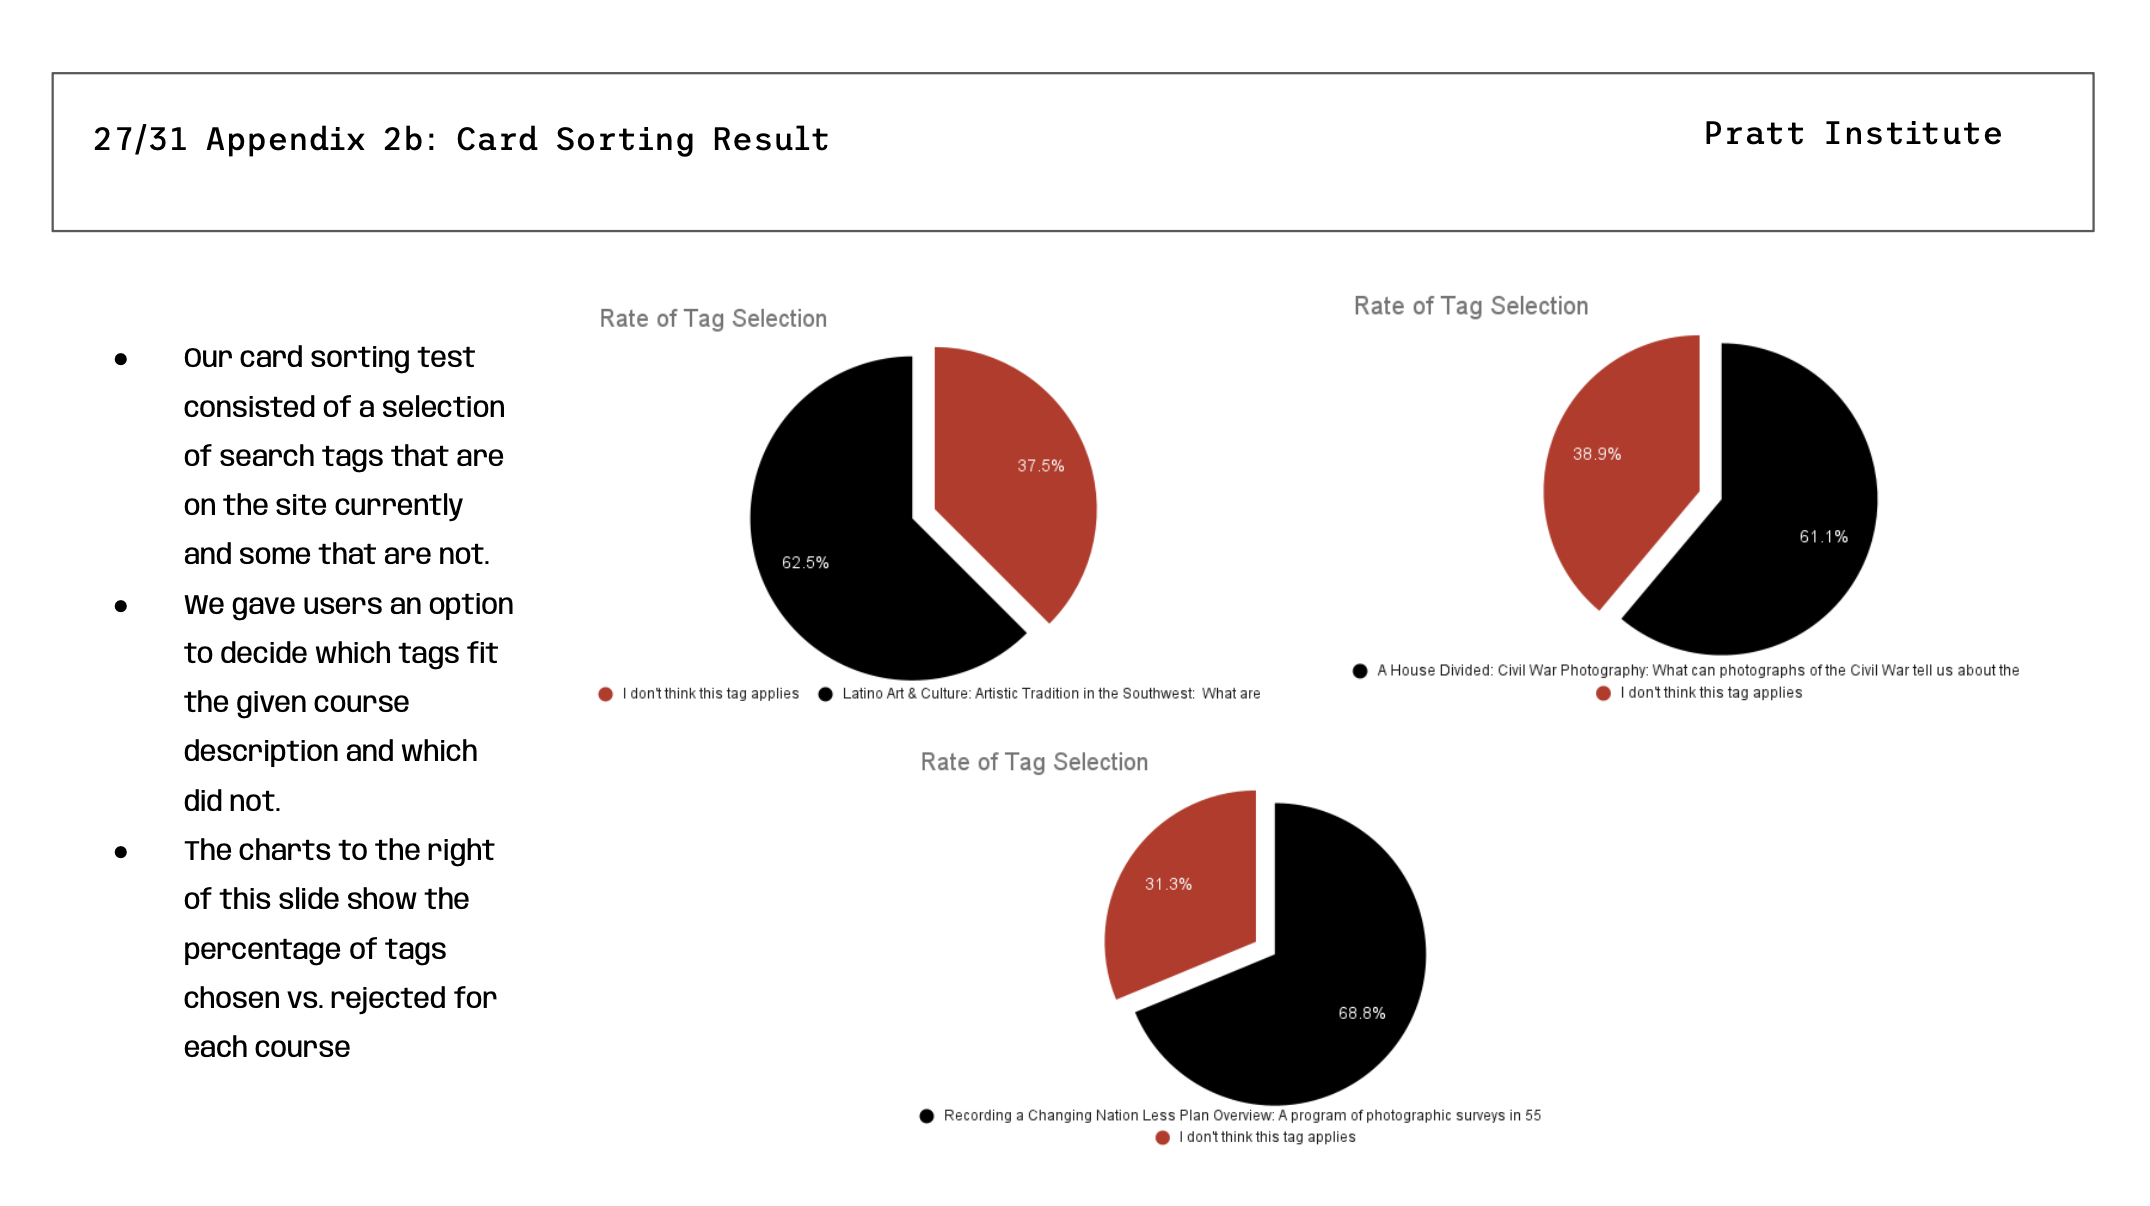
For us, this test is not to have users sort out the entire website layout for us, but rather to see how they associate tags from the metadata to specific educational resources. We pulled filter tags from SAAM’s prototype as well as ones that we thought could be useful from their metadata file to assemble the “notecards.” We then selected 3 different educational resource topics and used OptimalWorkshop to create the carding sorting part of the task.
With this idea in mind, we were able to lay out the master plan for our methodology and tasks.
- Scenario:
- You are interested in art and are looking for a few educational resources on SAAM’s website, particularly in educational background. There are a few filters on the website that you can use to find these resources.
- Task 1 & 2: Card sorting
- Users are being provided with a link to the card sorting activity, along with a short description of the educational resource. Their task is to read the description and drag and drop the filter cards that they think can be associated with the topic. The filters that they find non-relevant can go to the “not relevant” category.
- Task 3 & 4: Testing the actual search page
- Users are given a short description of an educational resource, and they have to find this educational resource using only the filters, without the search bar.
We pilot tested our rough script with a peer during class time. We’ve received very valuable feedback from our classmates and our professor on how to make our task easier to understand and less stressful since our methodologies are pretty innovative, thus making the task a bit more challenging.
This pilot test also got us to reflect on how our group was working as a whole together. Our team has extroverts who love to talk and share, introverts who have ideas but take time to form their thoughts, and people who are new to user experience and out of their comfort zone, including me. We had a 20-minute talk about our concerns about the project and our respective working styles. I think this helped my teammates and I to talk about our observations and feelings to construct a more efficient team.
Part 3: Interviewing, good luck, and bad luck(?)
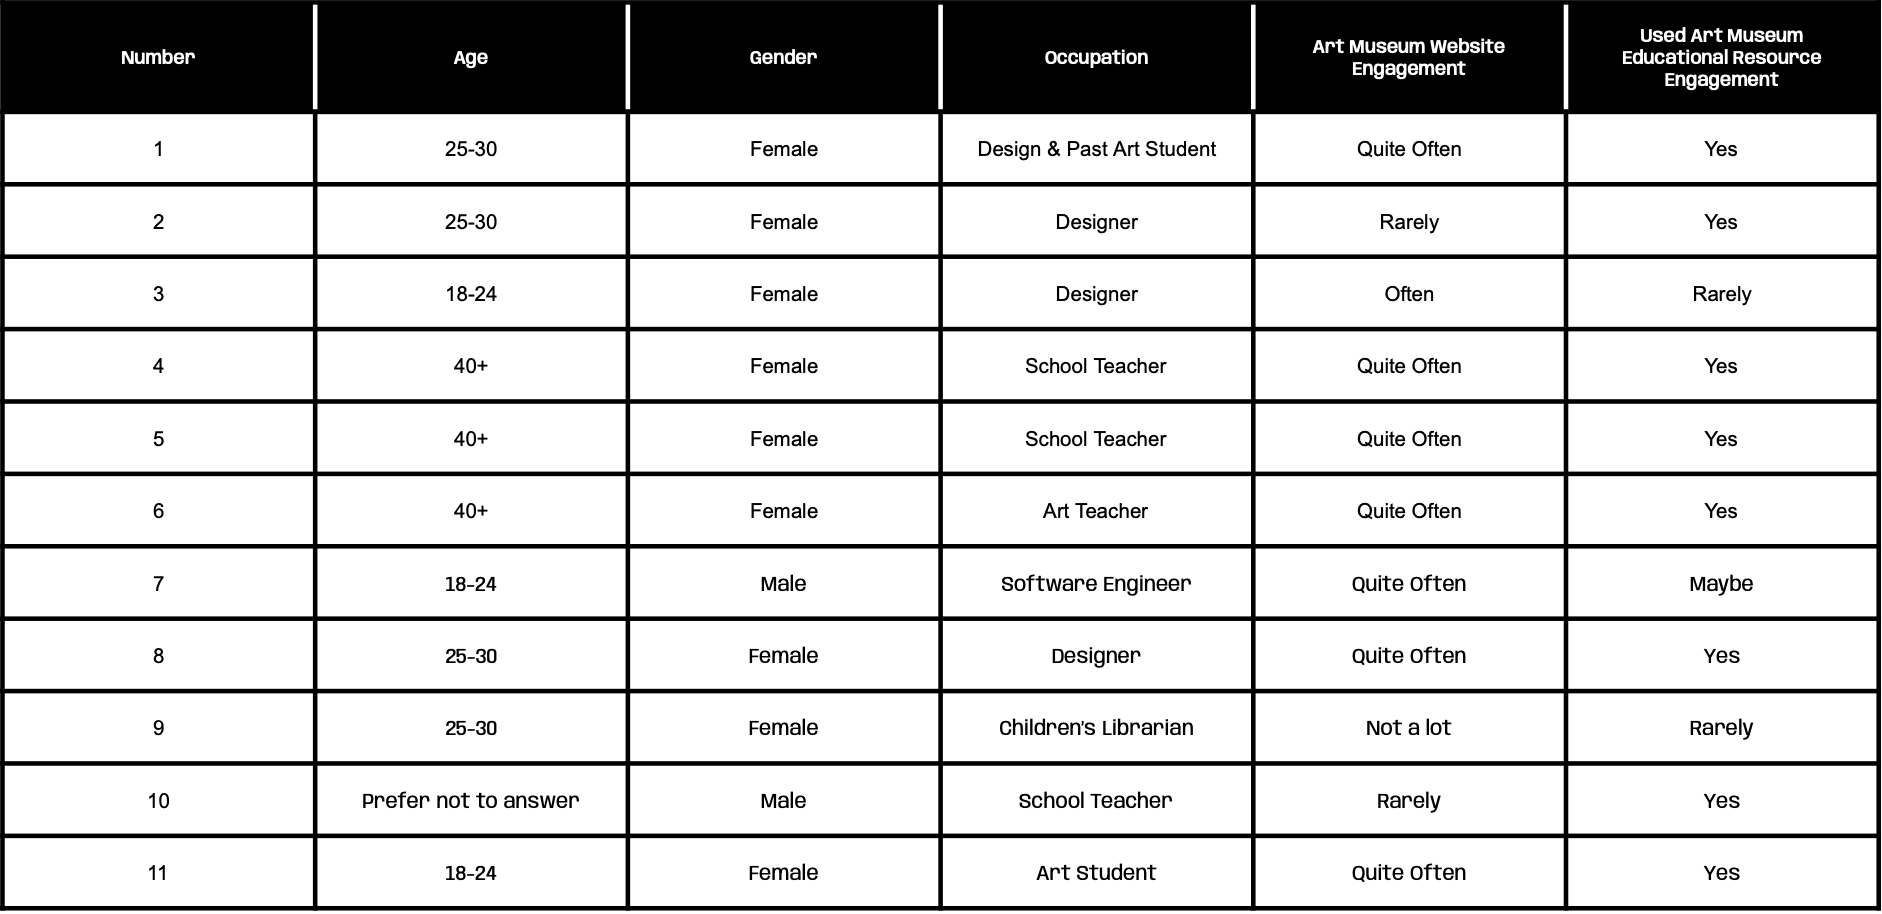
Along with our script, we created and sent out our screening questionnaire to our potential participants. The recruiting process was fast and smooth. Within 3 days we were able to get around 15 responses from the greater Pratt community. Since we asked people if they interacted with museum websites for educational resources, as well as occupation and age, we were able to identify fitting candidates and start scheduling interviews.

Since one of the most important audience types for SAAM is professionals, we wanted to recruit as many teachers as we can. I reached out to a professor with connections to public school teachers and asked him to send out the questionnaire on our behalf; Mehika reached out to Alex and asked her to give the questionnaire to their educational team to distribute. After about a day, we suddenly got an influx of responses with a lot of educators. This really helped us to cover more user types that SAAM has identified and revealed crucial usability issues after the user testing.
What’s really interesting was that of the 5 members of my team, I was the only one who had a hard time doing my interviews. I had 2 no-shows, and the prototype searching page broke down on me when I was doing the second part of the tasks with a teacher. However, I am proud to say that I held up my chin and pushed through and got both of my interviews done.
Part4: Result analysis, presentation, client takeaway
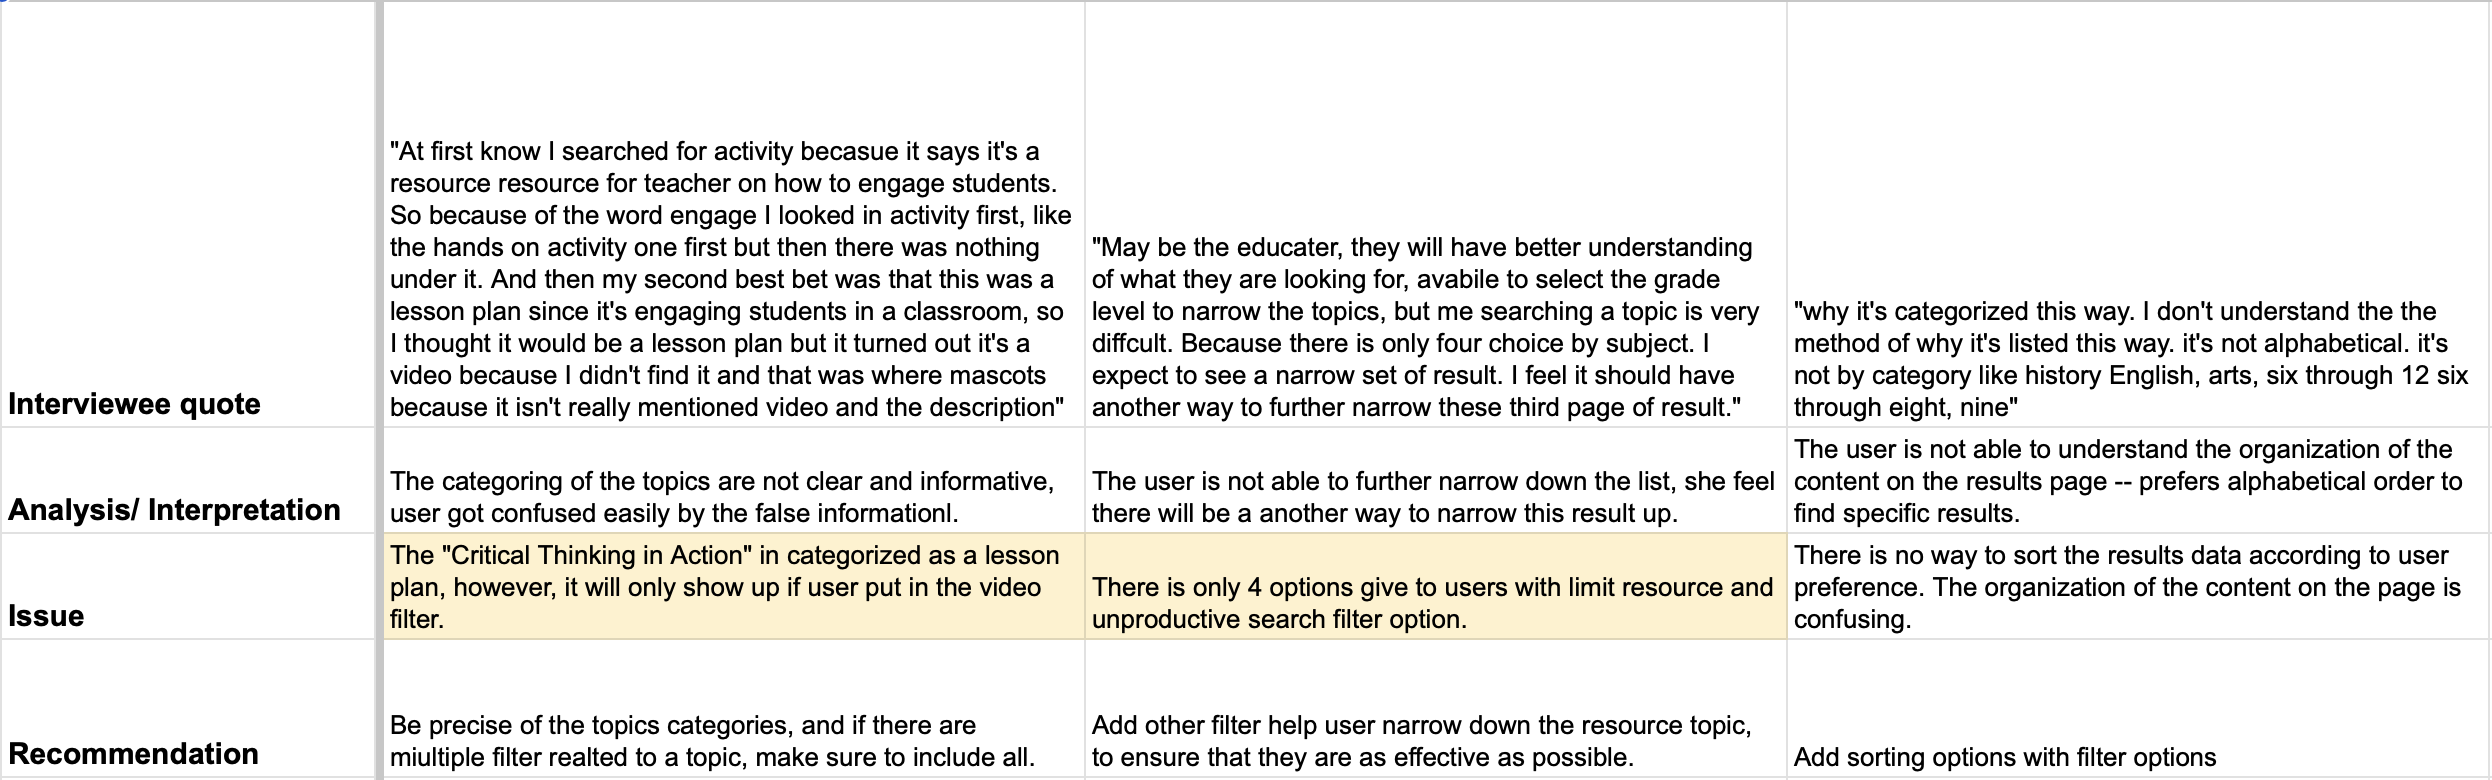
Mehika created an entire excel system for everyone to document and share their findings after the interview. First, we used the Interview Notes to share general information about each of our interviews. This includes the basic information of the subject as well as their answer to each question during the task. Then, we used the Conclusion sheet to put down quotes from interviewees when they encountered or identified an issue during the interview. Finally, we interpreted their quote, stated the issue, and gave our own recommendations on how to resolve the issue.
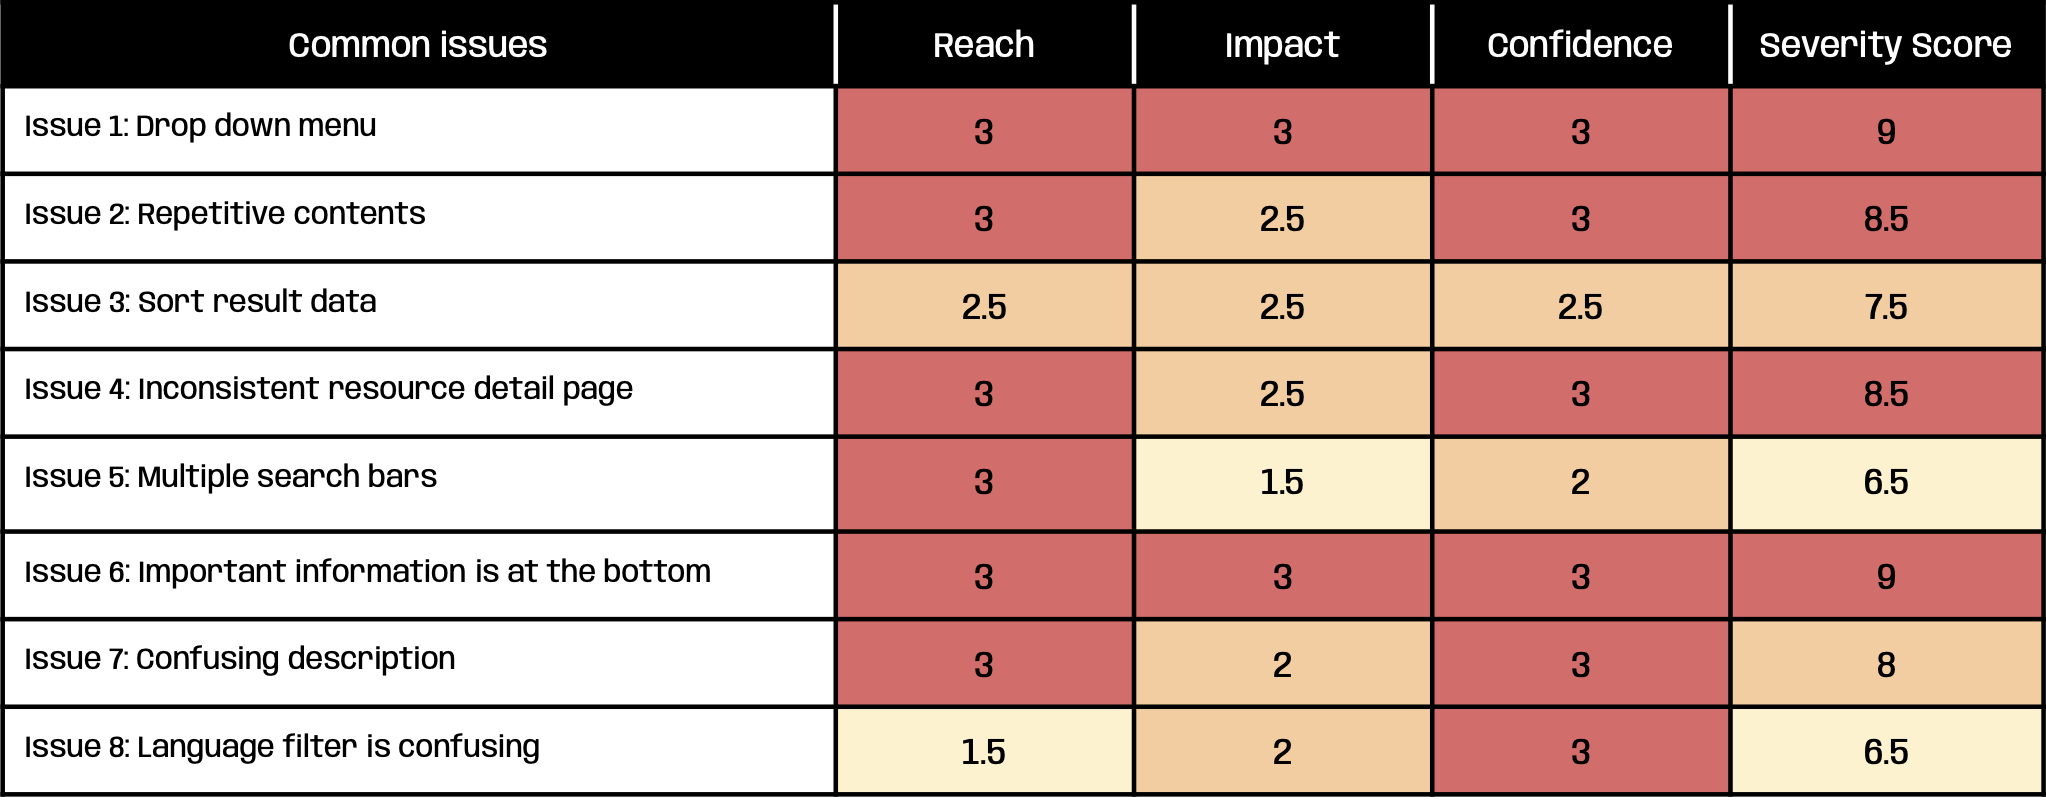
In the end, we debriefed each other on our findings together, identified true issues, and used RIC analysis to give each issue a severity score. RIC stands for reach, impact, and confidence. Adding all three together generates the severity score.
Another important part of result analysis is for our card sorting activity. As a data analytics and visualization student, my teammate, Nathan Smash, and I analyzed the raw data from our card sorting activity. Based on the results, this innovative way of user testing is actually quite helpful. It identified some new recommendations based on the data, and it also helped us confirm some of our issues from the search page tasks.
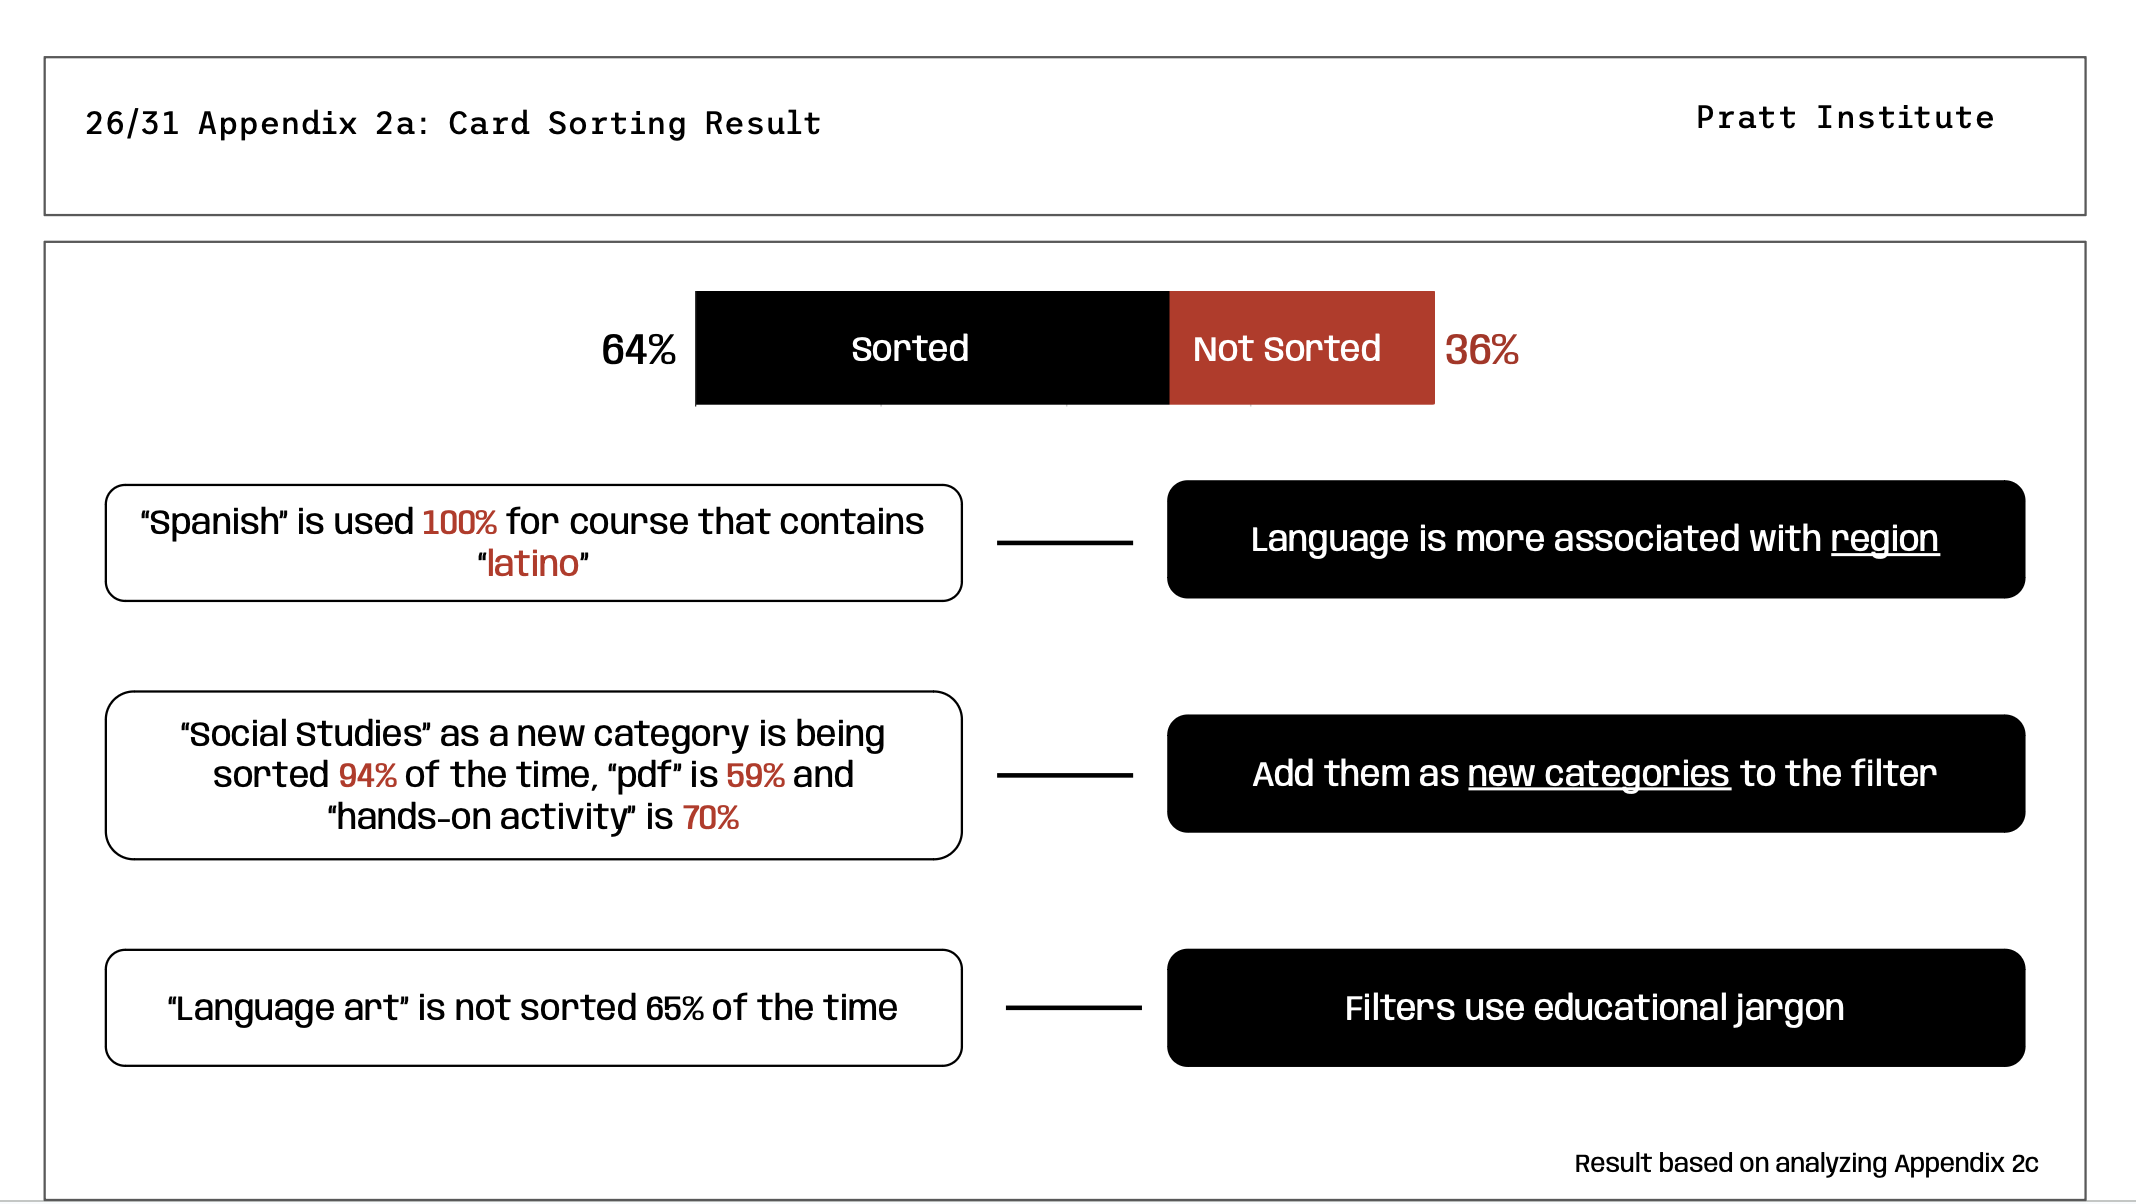
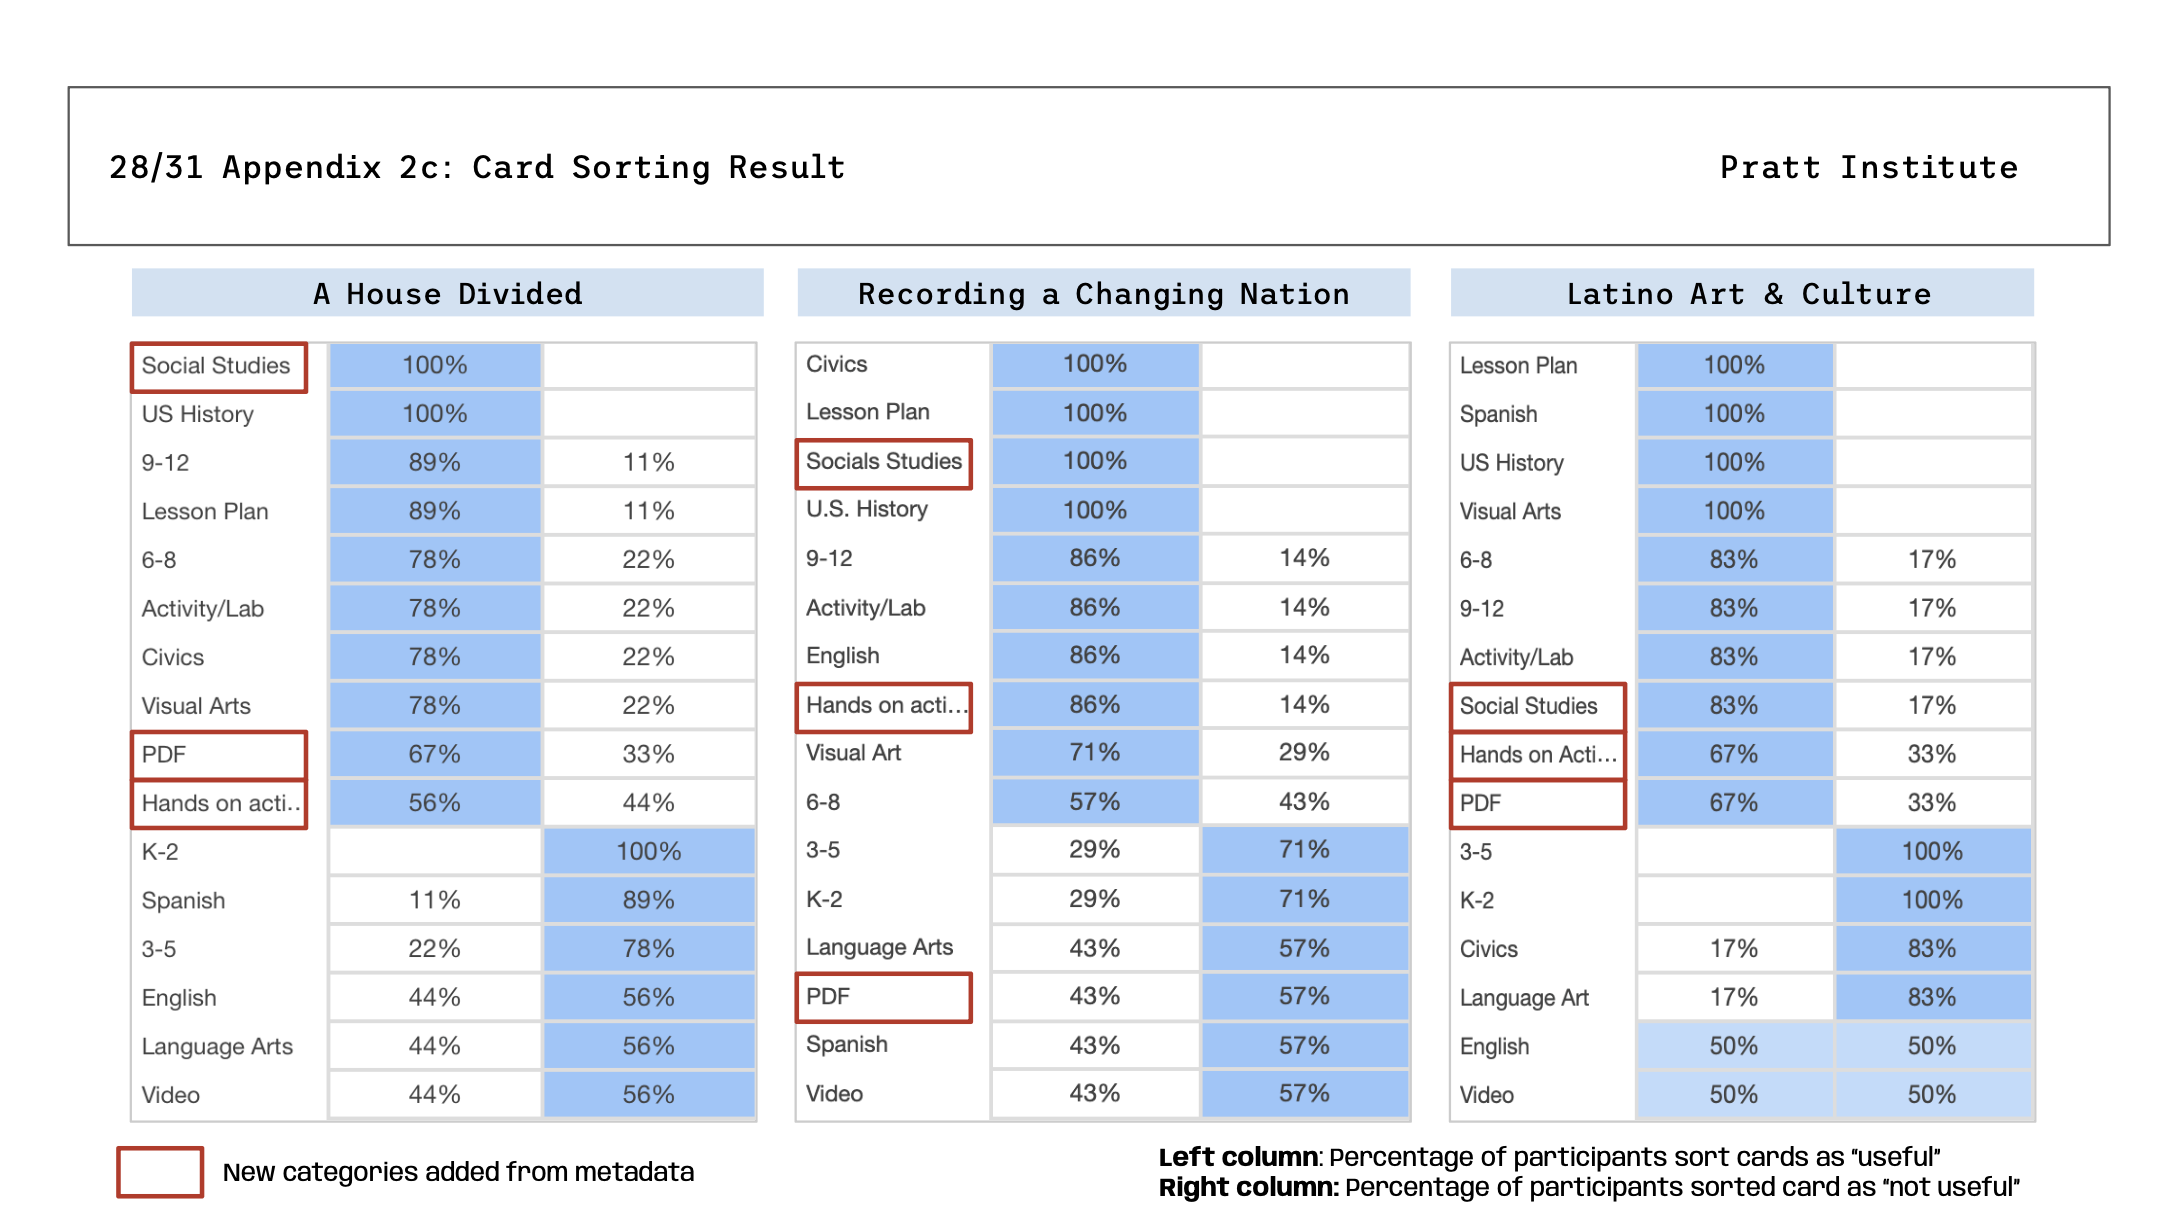
The main conclusion that we had was that SAAM can use filters in a more productive way. This makes their page layouts more consistent and efficient, creating less of a learning curve for users, especially educators.
With all of our issues being identified and recommendations given, we now moved on to creating the presentation. Each one of us claimed a few different slides and started working on them. Mock-ups were created for each recommendation that we discussed using Figma. Our presentation mimicked the style of SAAM’s website for brand consistency. After a trial run in class, we’ve received some feedback to change the layouts, especially for our issues and recommendations slides. It was suggested we make them less chaotic and messy; we also added animation to some of our recommendation slides, and it really helped us highlight the changes that we made. Click here to see our final presentation.
The final presentation with the client went very smoothly. Alex really liked our presentation, and she thinks that we have reached our goals. She was excited to have proof from our results to make some of the changes she initially proposed to her team, especially for recommendation 1. She also really liked how we used the card sorting activity. She even asked for the raw data so she can look deeper into it. We talked a lot more about some of the issues, particularly for issue 4 and 6 since they concern teachers, their primary user type, the most. Based on her interest, we were able to give Alex recommendations from teachers that weren’t in the presentation because the severity score was too low. Her feedback mainly came from the side of copyediting, which is fair because some of our format and phrases we used weren’t very consistent.
Part5: Reflection
I really enjoyed doing this project and I take it as a great learning opportunity. I learned how to work with other people better, especially with someone who has expertise in an area that I don’t . I have become a better learner and listener.
Second of all, I am more confident in doing presentations in a professional setting. This project taught me a lot about how to make good presentations and how to present presentations. Presentations are really all about logic and how do you keep the narrative consistent. I think this skill will go a long way in my future career.
If I were to do this presentation again, I would definitely get more teachers as participants. But other than that, I think me and my team did a great job. A lot of our participants asked when will SAAM launch this search page since they found it really helpful , so I do hope I can see this page on their official website soon.