Project Overview
Creative Capital is a non-profit grant making organization that is dedicated to funding artists in their pursuit of groundbreaking new work, amplifying the impact of their creations, and fostering sustainable artistic careers. For this project, we analyzed Creative Capital’s website and Instagram data between March 2022 and March 2023 to unearth improvements to Creative Capital’s content strategy. Our ultimate goal for this project was to drive more traffic to Creative Capital and increase their overall digital footprint. We worked with Aliza Sena, Director of Editorial and Digital Content, and Priya Gandhi, Manager of Digital and Editorial Content, as our client partners.
The Problem
Creative Capital’s online presence currently reaches a wide audience of artists and grantees, but does not reach the same breadth of donors. Reaching donors is currently a largely interpersonal effort, which is both time consuming and difficult to scale. Creative Capital is therefore seeking a solution to increasing donor engagement through online channels.
The Goal
The primary goal of this project determined by the client is to achieve general growth across Creative Capital’s website and social media channels. Based on the client’s interests, we focused on donation and support pages as well as Creative Capital’s Instagram account.
The Team
Five interdisciplinary Pratt Institute graduate students.
My primary roles include data analysis, report writing/editing, designing mock-ups, and client communication.
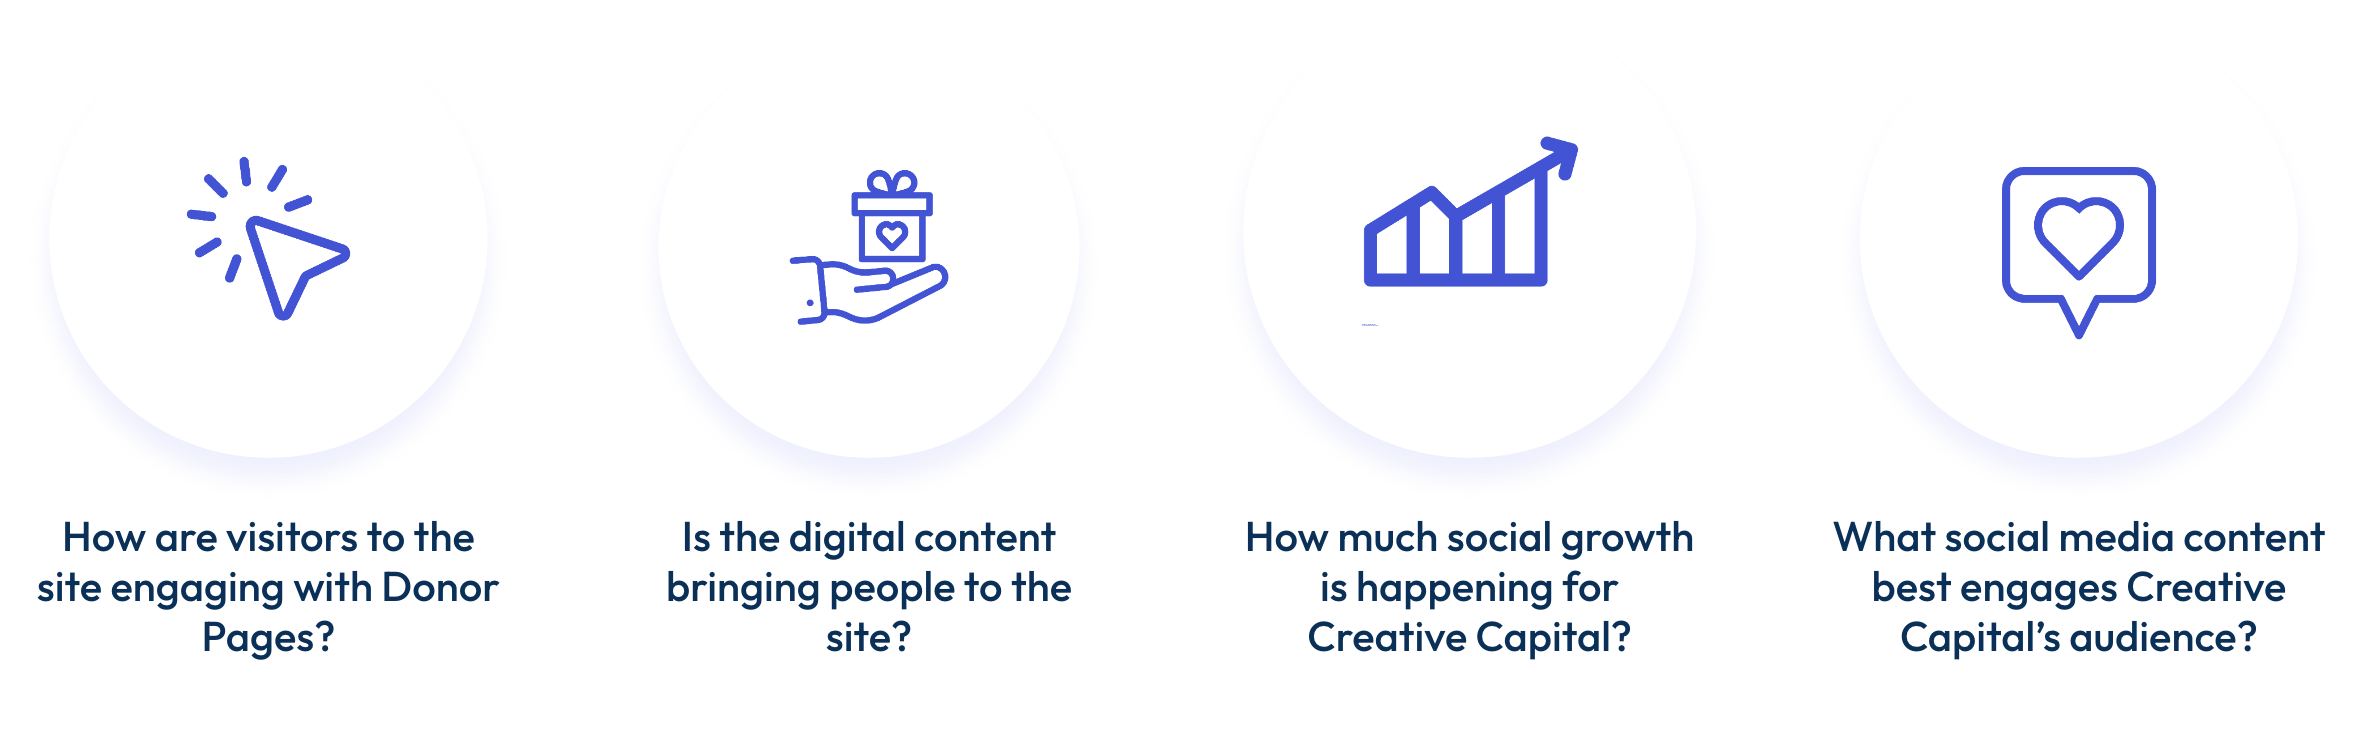
Guiding questions for project goals
Process
This six week project began with a client kick-off meeting and culminated in a final presentation showcasing our top findings and recommendations from our analysis. In addition to the presentation, our deliverables included a report detailing our methodology and a Looker Studio dashboard for the client to retain as a resource for their quarterly reports.
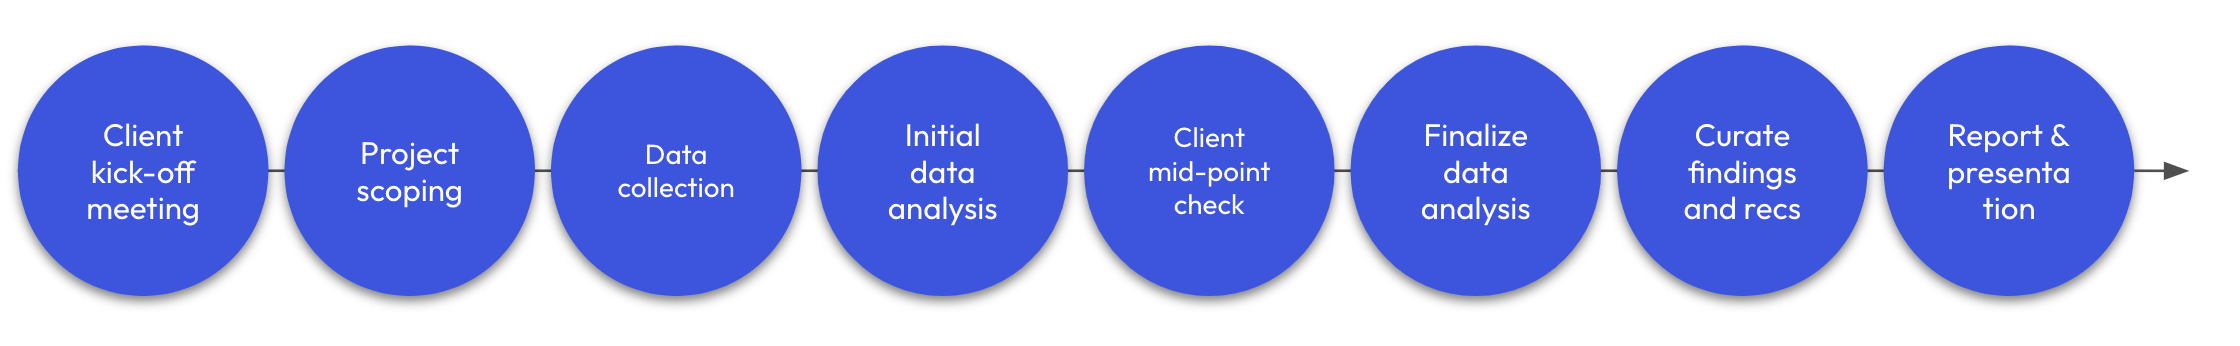
Project timeline
Project Scoping
Following our client kick-off meeting, we determined our project scope based on the data available and bandwidth of the team. We chose to analyze website traffic between March 2022 and March 2023, inclusive, in order to capture the elevated traffic during the months of March when Creative Capital hosts their open call for grant applications. We chose to limit our focus to Instagram and donation related pages rather than the entire website.
Out of scope:
- Newsletter – Creative Capital uses Mailchimp to manage their newsletter; we omitted newsletter sign ups from out scope because this data is not contained within Google Analytics
- Creative Capital Curriculum – The curriculum is still in development and has only been soft-launched, so there was insufficient data to analyze
- SEO – The client completed their own SEO audit in May 2022
- Twitter & Facebook – Creative Capital uses Instagram as their primary social media, so we left other platforms out of scope
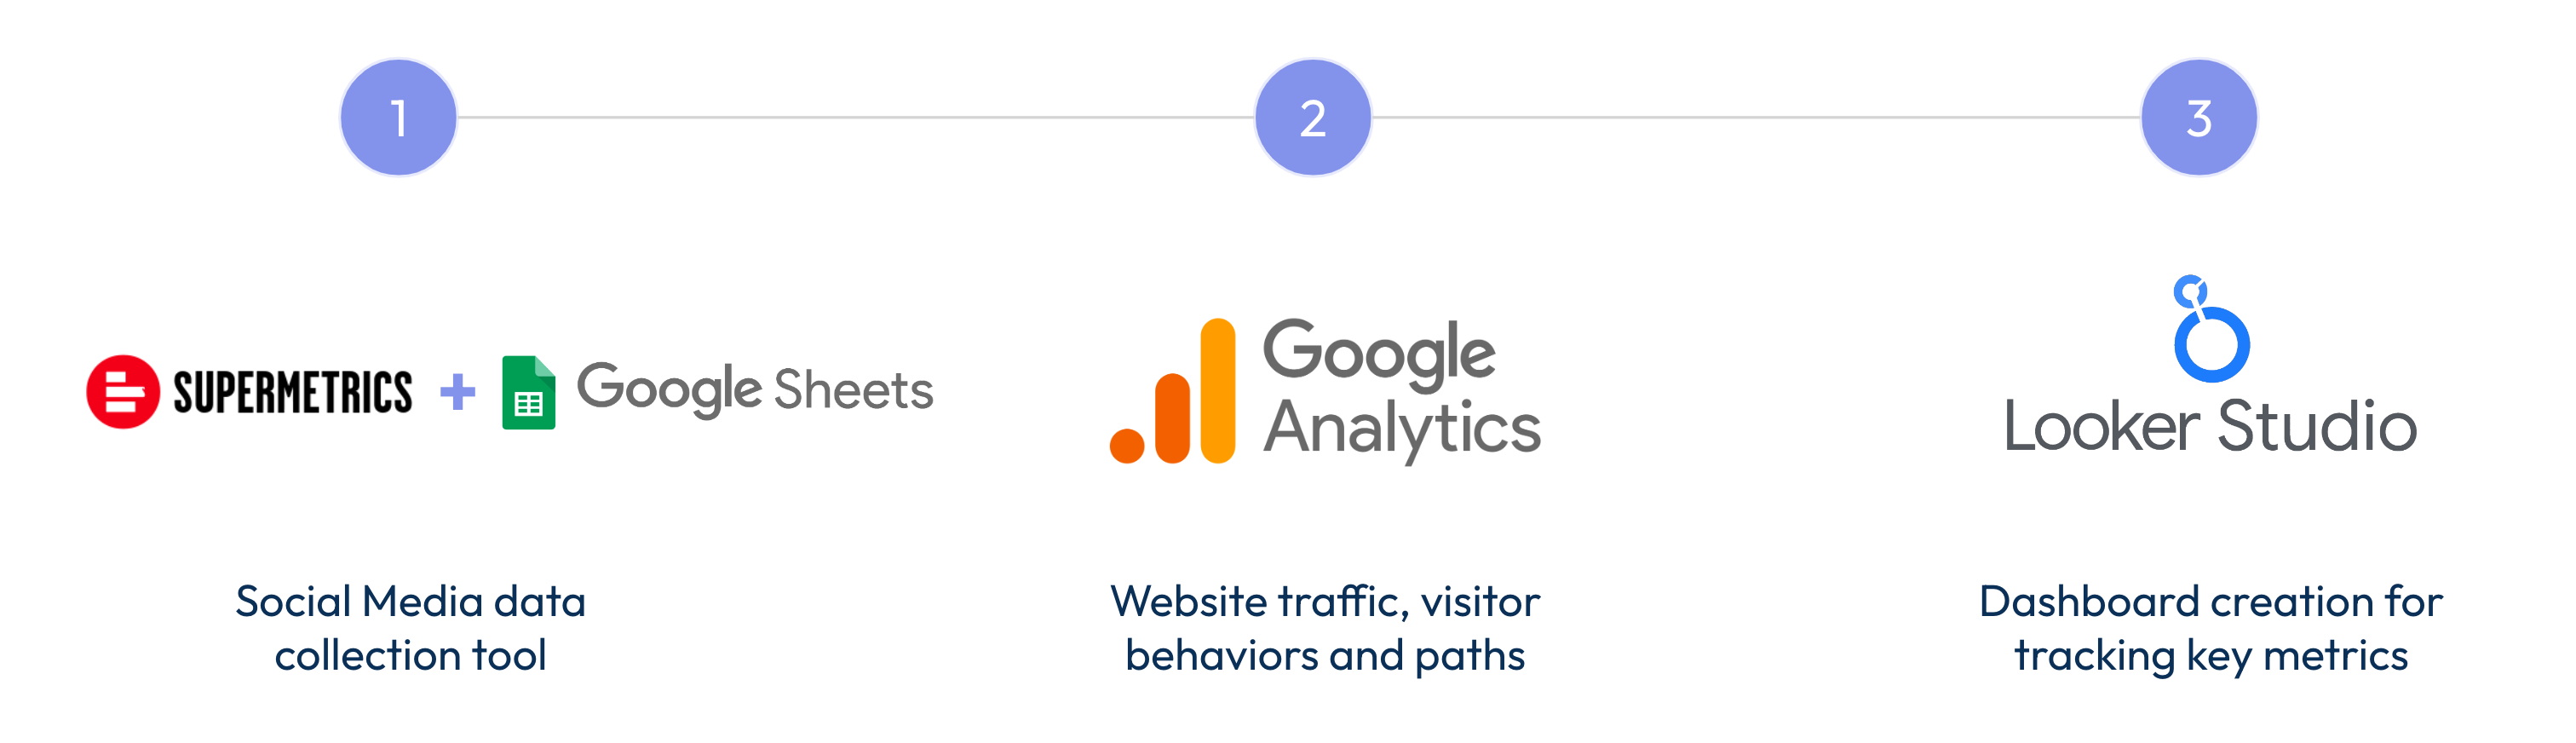
Tools & Methodology
We utilized Supermetrics to extract data from Creative Capital’s Meta Business Suite. This allowed us to pull metrics such as engagement and media reach that are not available publicly. After extracting the data, we imported the raw Google Sheets data into Looker Studio to build our visualizations.
For website traffic, we requested access to Creative Capital’s accounts for both Universal Analytics and Google Analytics 4. Universal Analytics provided a full data set from March 2022 – March 2023, while the newly created Google Analytics 4 account contained only data for March – April 2023. We again imported the data into Looker Studio, and supplemented our visualizations with a Path Exploration in Google Analytics 4.
While Supermetrics and Google Analytics are both powerful tools, some limitations should be noted:
- Supermetrics cannot pull historical follower count, so we were unable to track monthly follower growth
- As Creative Capital is in the process of migrating from Universal Analytics to Google Analytics 4, data in GA4 was only available for March and April 2023
- Google Analytics maintains a separate account for third-party platforms, so pages maintained by Classy (including Donate and Membership pages) could not be tracked or integrated into visualizations
Results
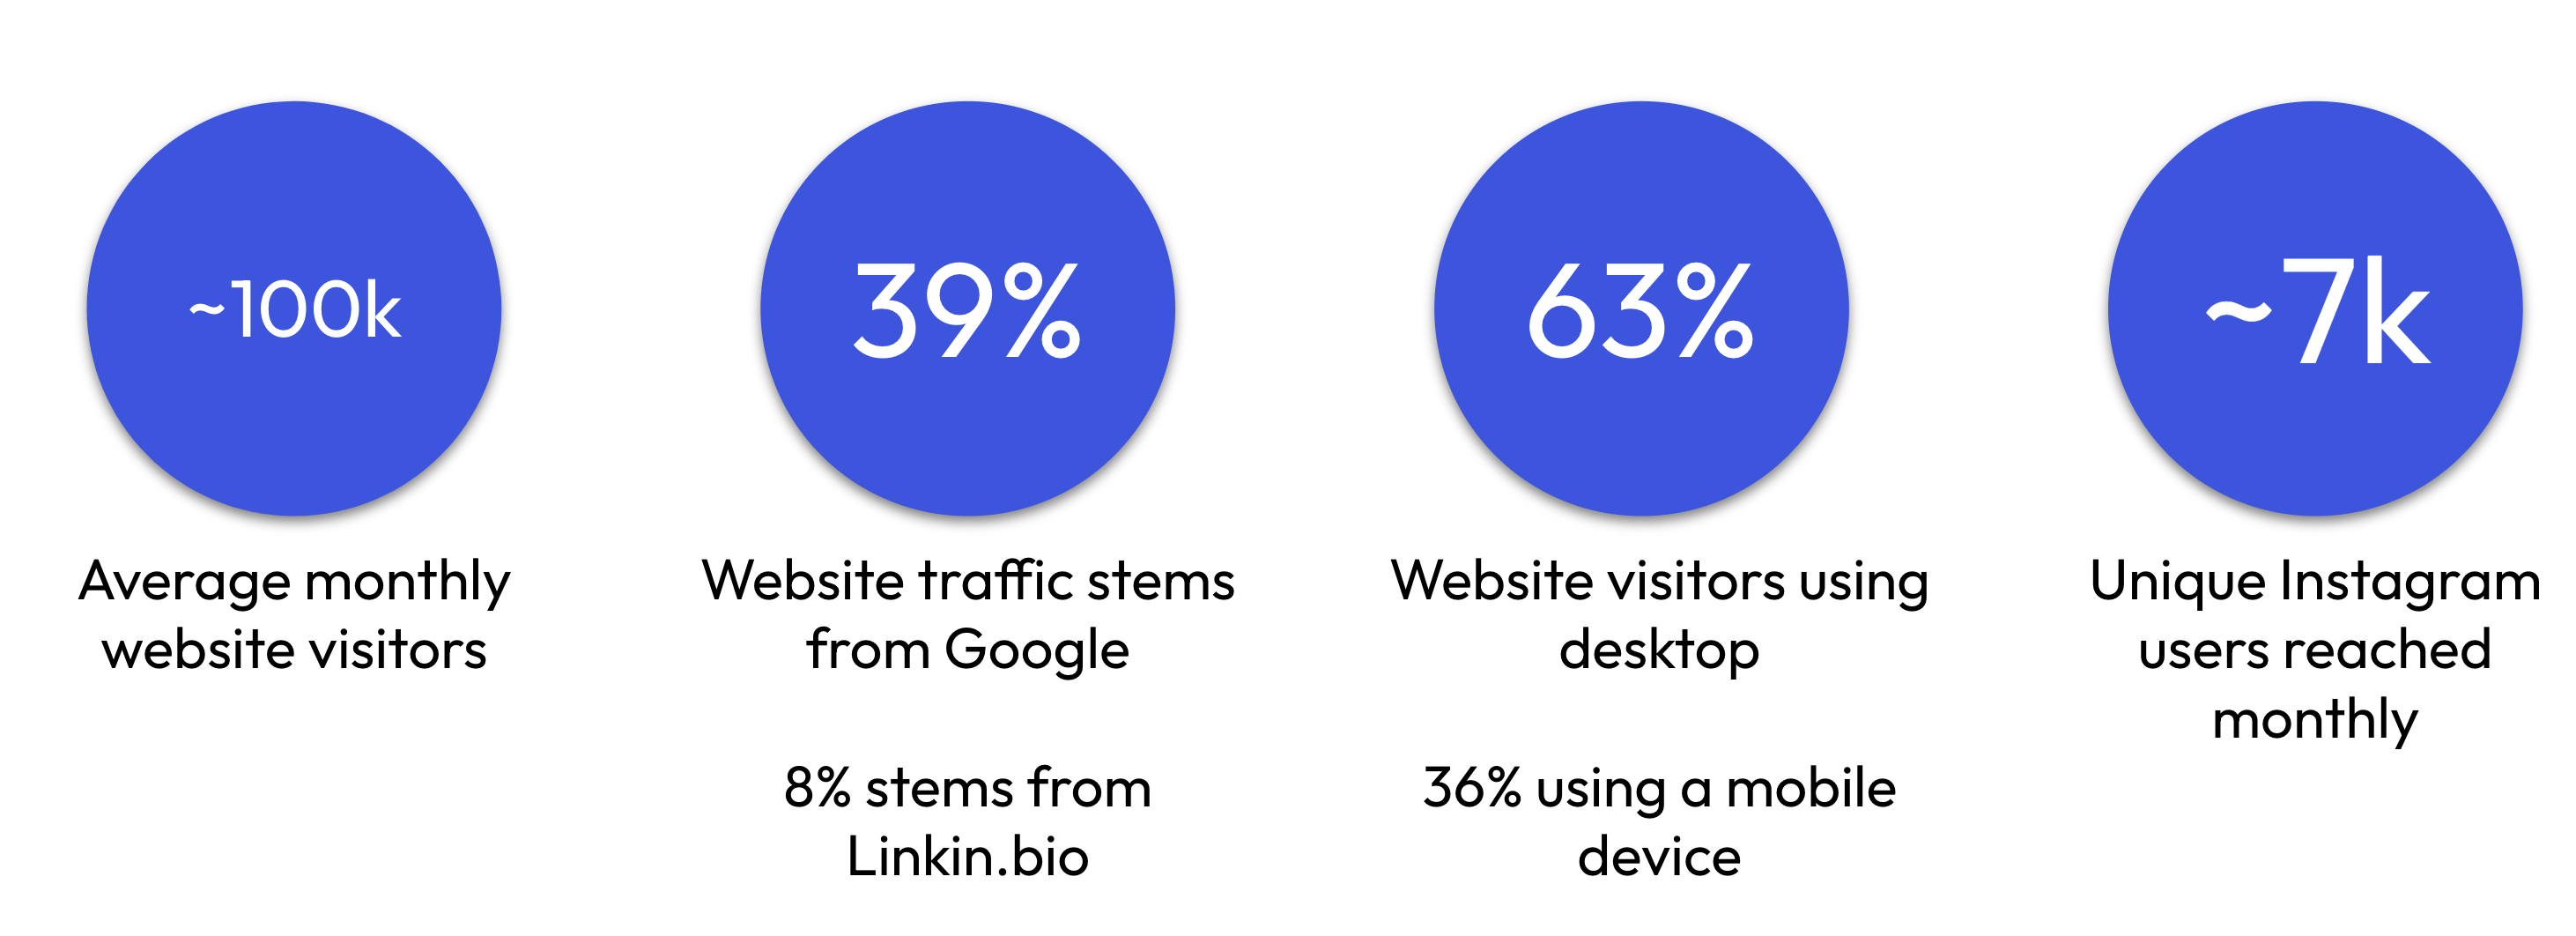
We discovered that Creative Capital’s journal was an incredible asset to the site, with a majority of the ~100k monthly visitors landing on journal posts for Wild Futures or Artist Opportunities as the first page of their user sessions. While 46% of audience traffic comes from direct links, we also discovered that 39% of traffic stems from Google searches and 8% stems from the Linkin.bio attached to Creative Capital’s Instagram profile.
Findings & Recommendations Overview
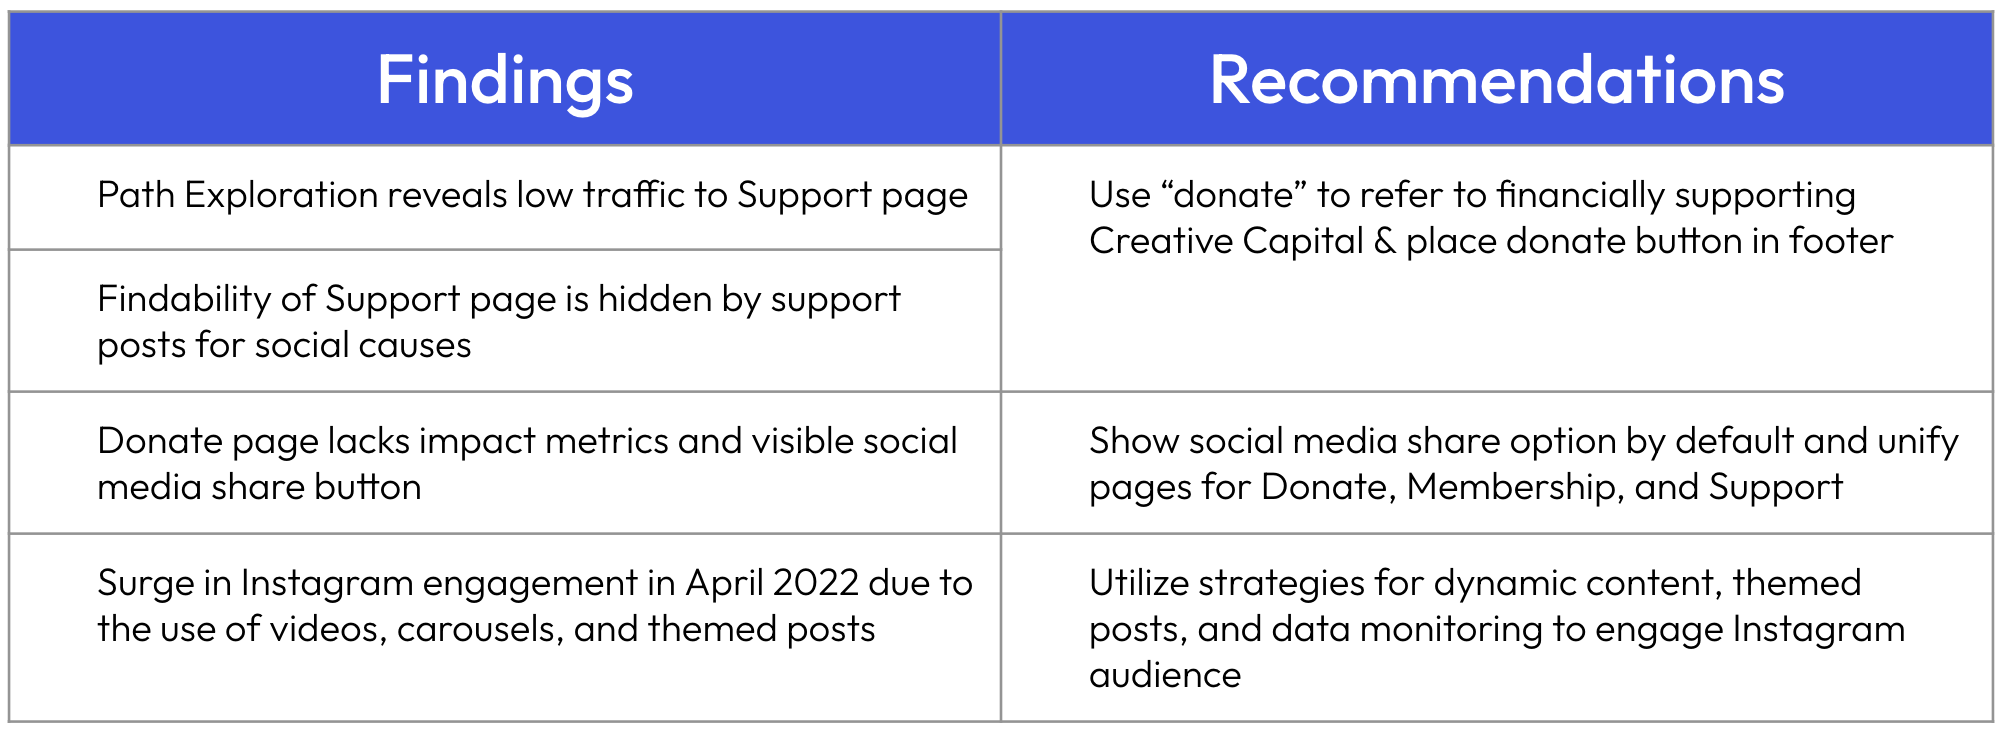
The performance of Creative Capital’s journal is already strong, so we chose to focus our findings and recommendations on an area of opportunity – the Support and Donate pages.
Finding Deep Dive
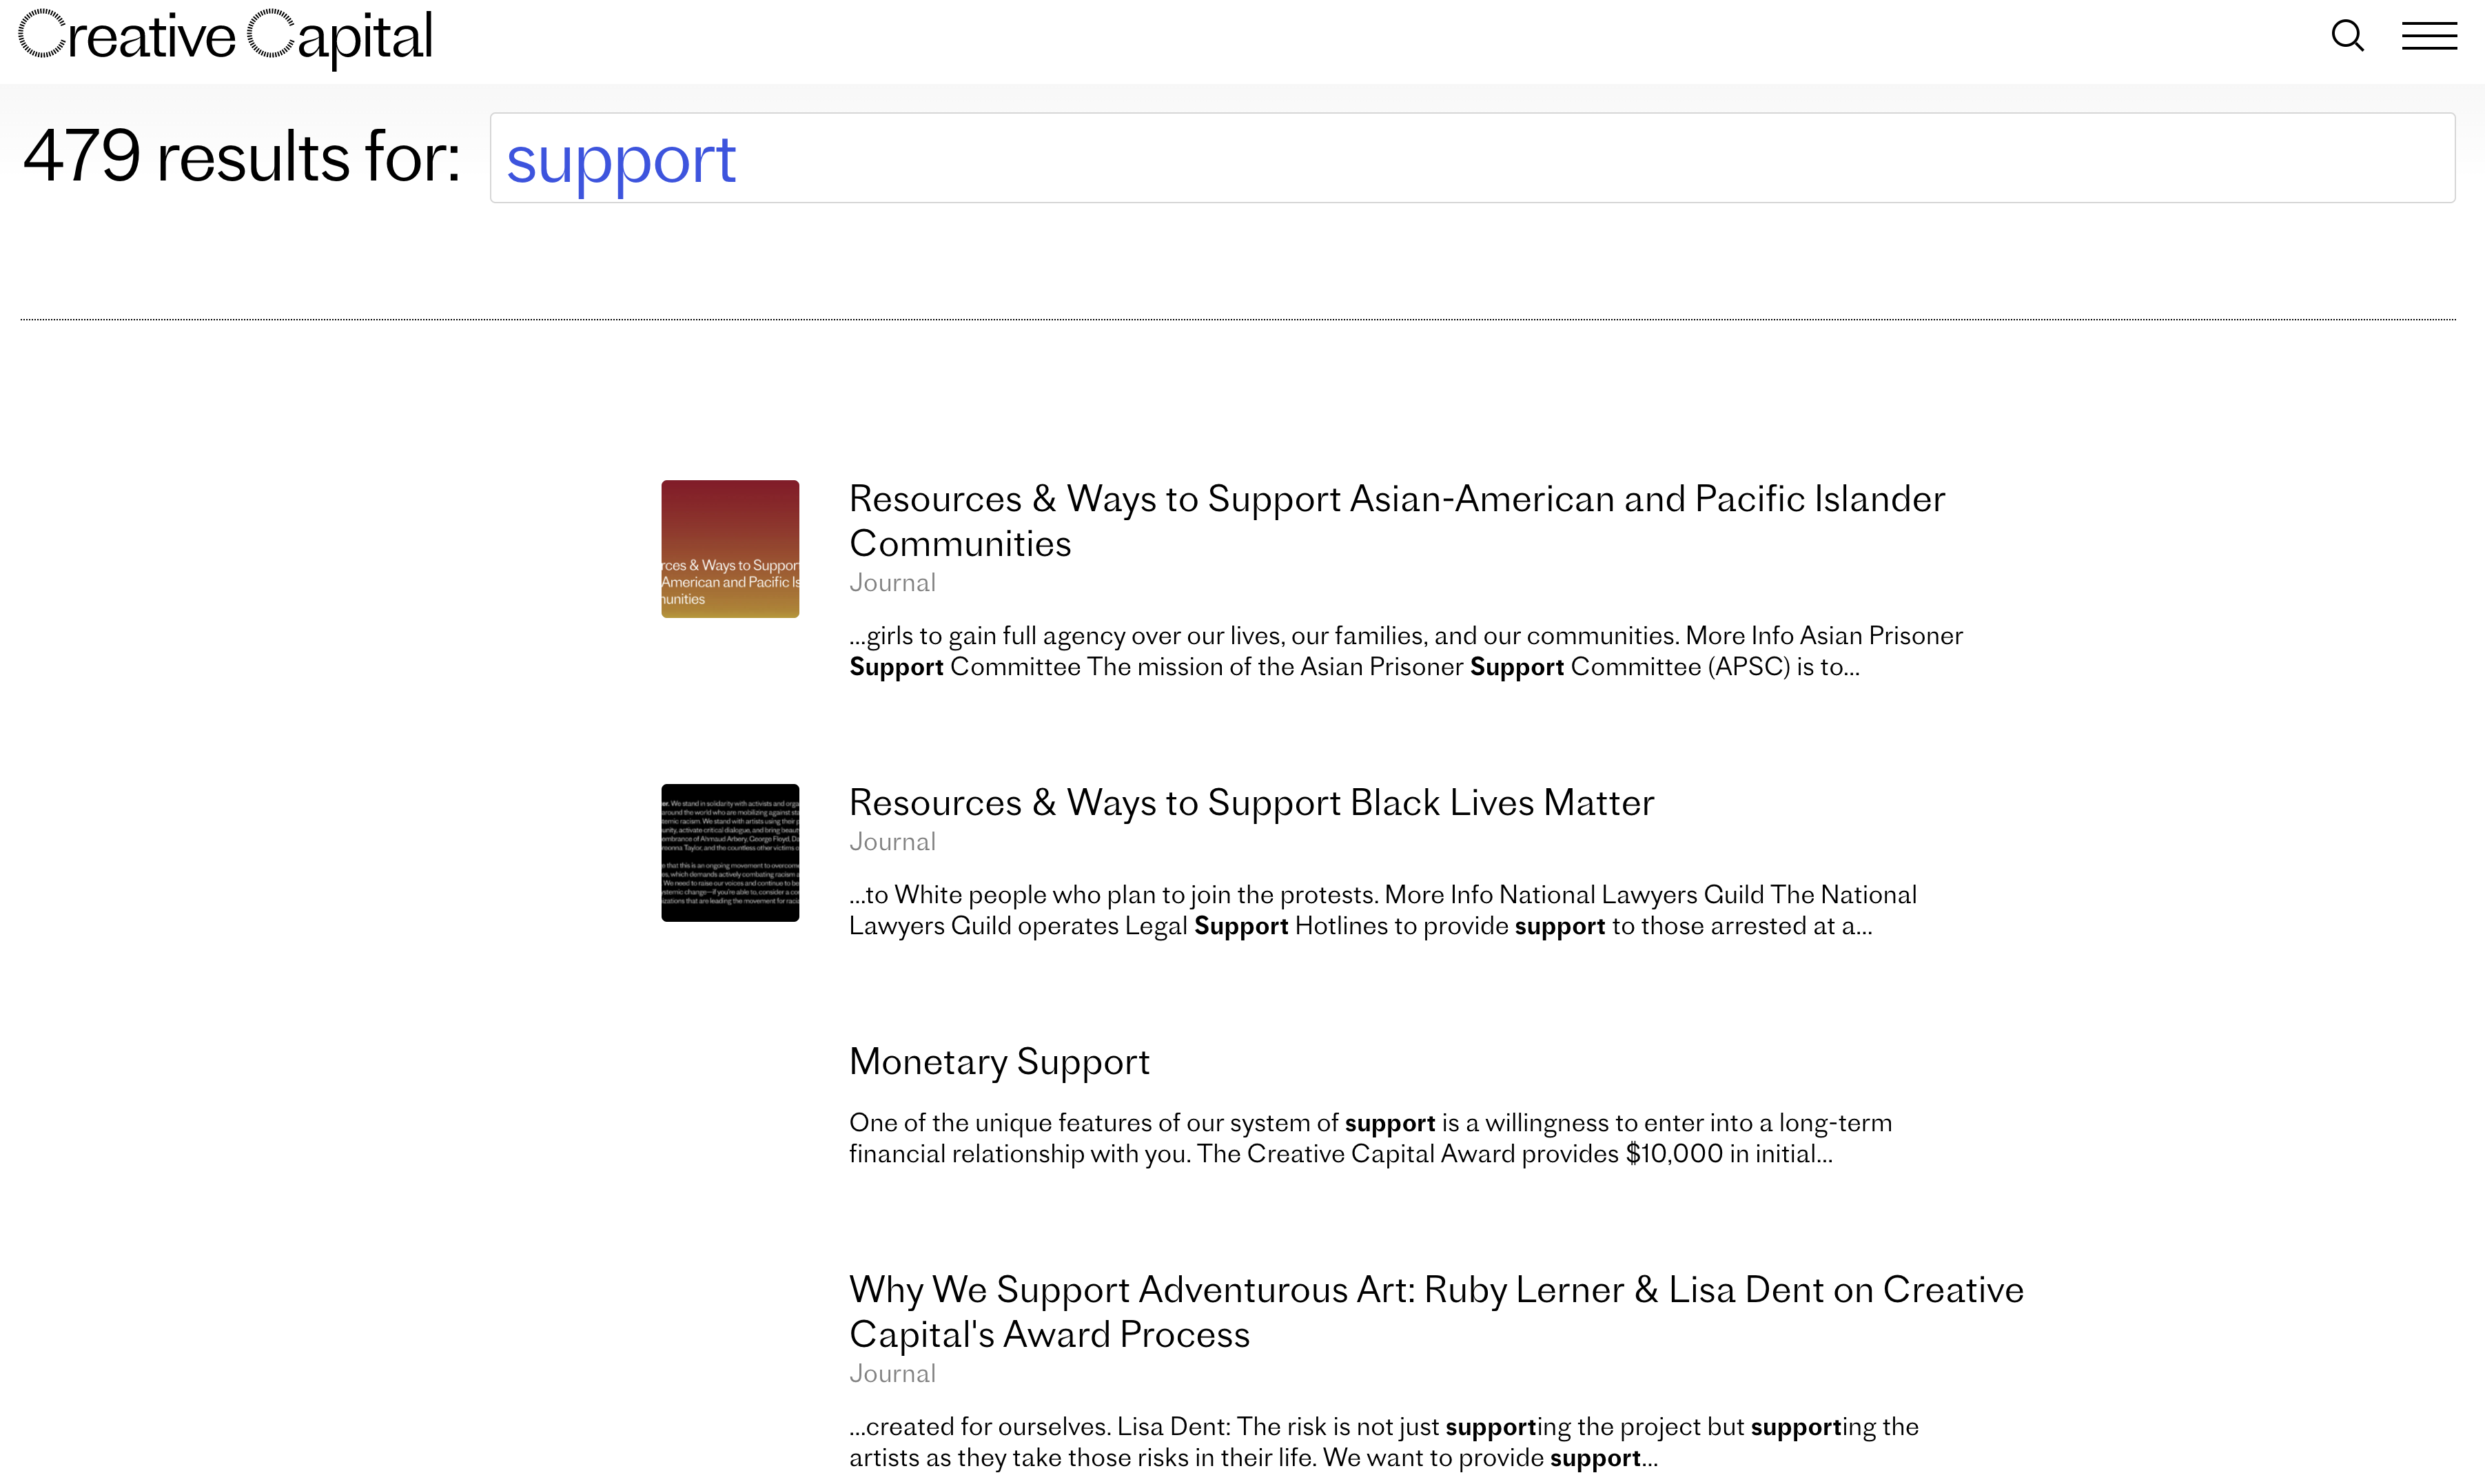
Findability of Support page is hidden by support posts for social causes
Within Creative Capital’s website, the word “support” is used in two different contexts – one to financially support Creative Capital and the other to support social causes. The Support page provides information on how to financially support Creative Capital, however this Support page received fewer views in the period analyzed than journal posts like “Resources & Ways to Support Black Lives Matter”.
Both contexts are valid, however the popularity of support posts for Black Lives Matter and AAPI Communities impacts the findability of how to donate to Creative Capital. In fact, when users search “support” in Creative Capital’s internal search bar, the Support page doesn’t appear in the search results at all. In contrast, when users search “donate” using the website search function, the Donate page appears as the first result.
Use “donate” to refer to financially supporting Creative Capital & place donate button in footer
Use of “donate” to refer to financial support for Creative Capital can help distinguish posts and pages for donations from those for supporting artists or supporting social causes. Understanding that users may become fatigued from too frequent calls for donations, we still believe in the value of “donate” as the appropriate vocabulary because it is so easily distinguishable from other forms of support. In lieu of synonyms for “donate”, we recommend fewer, well-placed donate buttons across the website.
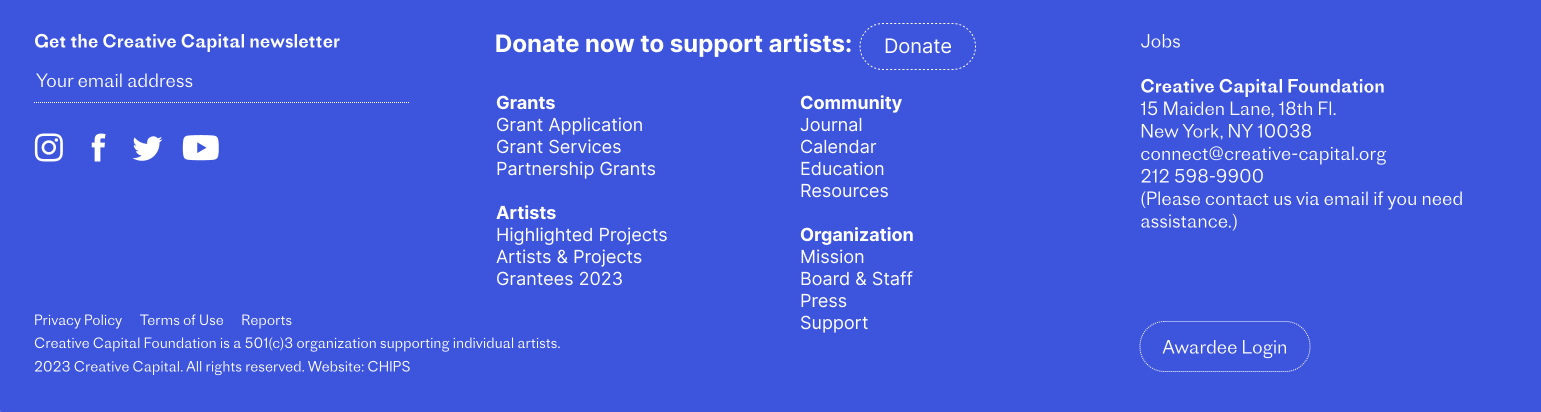
Consider adding the donate button into the website footer so that users have the ability to navigate to the Donate page from anywhere on the site. Placing the donate button in the footer makes it visible at the bottom of every post without being intrusive to the content of the post.
To see the full details of the findings & recommendations, the report for this study can be found here and the presentation here. The Looker Studio dashboard is also viewable here.
Outcomes & Future Considerations
Our web and social media evaluation of Creative Capital’s online presence revealed the strength of its journal and the opportunities to improve its donation experience. Upon presentation of our findings, we received enthusiastic feedback about our recommendations to place the Donate button in the footer and the GA4 optimizations. Additionally, we received feedback from our client that she hoped the dashboard would be a living document, so we followed up with instructions on how to have the Looker dashboard regularly sync with changes to the underlying Google Sheet.
Due to the limitations of the current GA4 implementation, we were unable to track key user journeys such as newsletter sign ups and clicks on embeddings of the donate button throughout the site. In a future iteration of this project, we would implement GA tracking events for these key user journeys to create an additional layer of depth to the data set. We hope that with additional time, our Path Exploration can be refreshed to include more than only two months of data.
Questions?
If you have any questions about this study or are seeking a consultant on a new study, please contact me at cyip@pratt.edu.