The Repertory Grid Interview (RGI) is a technique related to Personal Construct Theory (PCT)—both were developed by George Kelly in 1955 in order to explore people’s conceptions of their relationships with others. PCT centers on the idea that every individual perceives the world based on constructs created from his or her unique experiences and understandings. RGI was first implemented in a clinical setting as a way to identify an individual’s personal constructs during psychoanalysis sessions. The RGI has since been adapted for many other purposes, including user experience testing.
Facilitators are challenged to remain unbiased during usability testing, and even the questions (or the framing of those questions) a team chooses to ask can reveal what is relevant and important to the team. Sometimes this can skew results away from what may be significant from the user’s perspective. The RGI enables the user to frame the issues or topics that concern him or her, making it easier for facilitators to remain impartial. This technique also provides both quantitative and qualitative data results that can reveal noteworthy insights about an interface or other topic.
The RGI can be applied to a wide range of topics, from one’s relationships with family and friends to favorite mobile apps. The topic is the first component of the RGI, and the elements chosen within that topic are the second component. For example, in one usability test that utilized RGIs, the researchers wanted to capture users’ initial impressions of homepages, so the elements of this study were six different homepages (Hinkle, 2009).
To create the constructs—the third component of the RGI—users are shown a random selection of three elements and must choose two that share a similar feature and then describe what is different about the third element. For example, a user might choose two homepages and describe them as cluttered (construct), and say the third is different because it is organized (contrast).
Example:
Look at this selection of the apps you use everyday. Find something two of these apps have in common and name it. Then describe what is different about the third one.
Gmail and Chase Banking are clean and simple (construct) to use, but Yelp is cluttered (contrast) with filters and options.
These groupings of three are known as triads, and the facilitator continues to elicit constructs and contrasts (by randomly grouping the elements into triads, until every combination has been used) from the user until he or she has created at least six construct/contrast pairings.
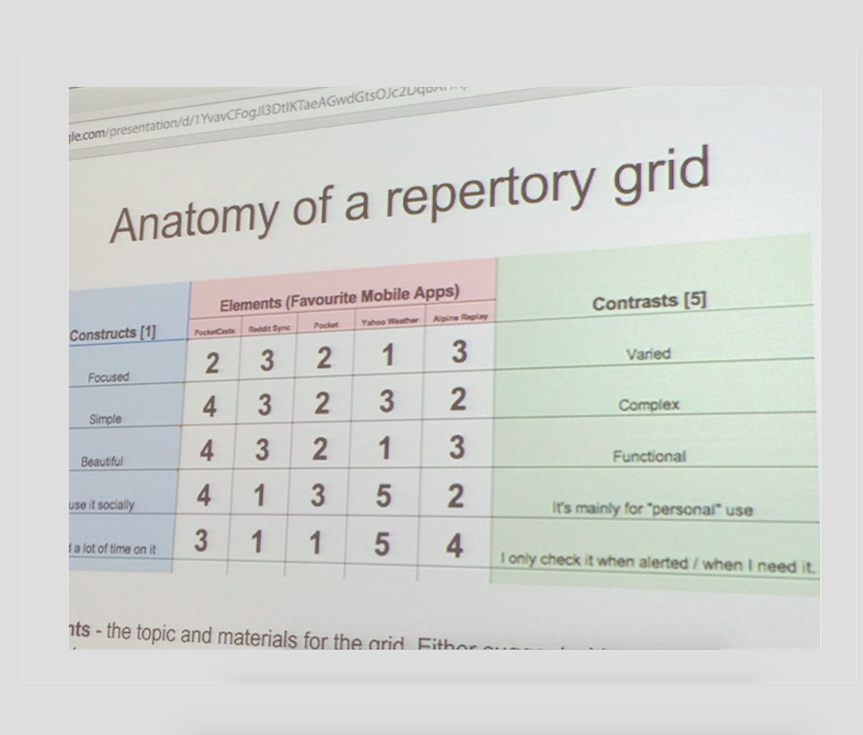
After eliciting constructs from the user, the facilitator moves the interview into the ratings phase. In this fourth component of the RGI “each element is rated on each construct, to provide an exact picture of what the person wishes to say about each element within the topic” (Jankowicz, 20024, p. 14). Both the elements and the constructs are put into a grid format to enable the user to easily rate each element (usually on a 5 or 7 point scale) according to the opposing concepts he or she identified about the elements.


The results of the RGIs can then be analyzed using qualitative methods, such as grounded theory approach, classification schemes or cluster analysis, to group together similar constructs into metacategories. These methods can be used independently or in tandem with quantitative analyses. For example, in the site homepage study the researchers used the metacategories to represent general features of the sites, and calculated a score that represented the distance of each rating from neutral. From there they calculated the mean, standard deviation, and total score for each site. Notes taken during the interviews “corroborate[d] the subjective ranking of preference established by the total scores” (Hinkle 2009), and the researchers were able to make conclusions about which homepages were more appealing and what aspects of a site most appeal to users. Results of RGIs can also be displayed using maps, graphs, or dendrograms (distance between the branches shows the relation between constructs).

While RGIs can provide insightful and useful information about a website, app or other information experience, the technique is time consuming for facilitators. It not only requires intensive one-on-one interviewing, but also necessitates rigorous analysis. And even though this technique minimizes the potential for bias, facilitators must be trained to implement the interviews in a useful way. If a user does not create meaningful constructs, the facilitator must be able to elicit ideas without imparting his or her own beliefs onto the user. Without meaningful and varied construct/contrast pairings, the results of the interview will suffer.
Words Cited
Hawley, M. (2007, December 3). The Repertory Grid: Eliciting User Experience Comparisons in the Customer’s Voice. Retrieved February 28, 2015, from http://www.uxmatters.com/mt/archives/2007/12/the-repertory-grid-eliciting-user-experience-comparisons-in-the-customers-voice.php.
Hinkle, V. (2009, October). Using Repertory Grid Interviews to Capture First Impressions of Homepages. Usability News. Retrieved February 28, 2015, from http://psychology.wichita.edu/surl/usabilitynews/112/pdf/Usability News 112 – Hinkle.pdf.
Jankowicz, D. (2004). The easy guide to repertory grids. Chichester, West Sussex, England: J. Wiley.
Matthews, P., & Osadzinski, H. (2014). Summary: Repertory Grids as a UX Research Tool. Retrieved February 28, 2015, from http://2014.uxbristol.org.uk/summary-repertory-grids-as-a-ux-research-tool/.
Qualitative Data from Interactions. (2015). Retrieved February 28, 2015, from http://www.skillsyouneed.com/general/qualitative-data-from-interactions.html.