

Introduction
We love to measure things. It is our way to understand how good or bad something is. Numbers help to evaluate the situation in a quick and easy manner. In this post, I summarized the responses to my six questions related to quantitative usability testing focusing on the real world methods and cases during an interview with Oliver S.
About Oliver S.
Oliver S, Design Lead at IBM Watson Health. During years of experience in creating digital products on different platforms for leaders in finance and Healthcare industry, he has helped clients envision their new user-centric enterprise product experiences and established solid foundations for a consistent and scalable design framework across their entire portfolios.
1. Which usability testing method do you or your company use more? Quantitative or qualitative? And why?
We use both in equal amount, they obviously serve different purposes. It is always good to have quantitative data( like A/B testing or A/B/C testing or accessibility testing). There is no distinction between those two, often time it’s like the combination of both.

2. What specific quantitative usability testing methods do you usually use and in which phase of the design?
A/B testing is the most common method we use. We do that sometimes before the development cycle starts. We create prototypes to validate our ideas, interactions, UI, layout component, etc.
We also do Free-form Usability Testing. We give the user the latest version and test users for 10 to 15 mins. We usually start with a few tasks and record the accomplishment rate. This is more of a later phase of the development cycle. Those feedback can inform the next iteration of the future decision-making process, and prioritization.
Quantitative is almost a must and qualitative is always a part of it, so you should capture both of them.
3. What do you think are the pros and cons of the methods you use? (Quantitative)
Pro
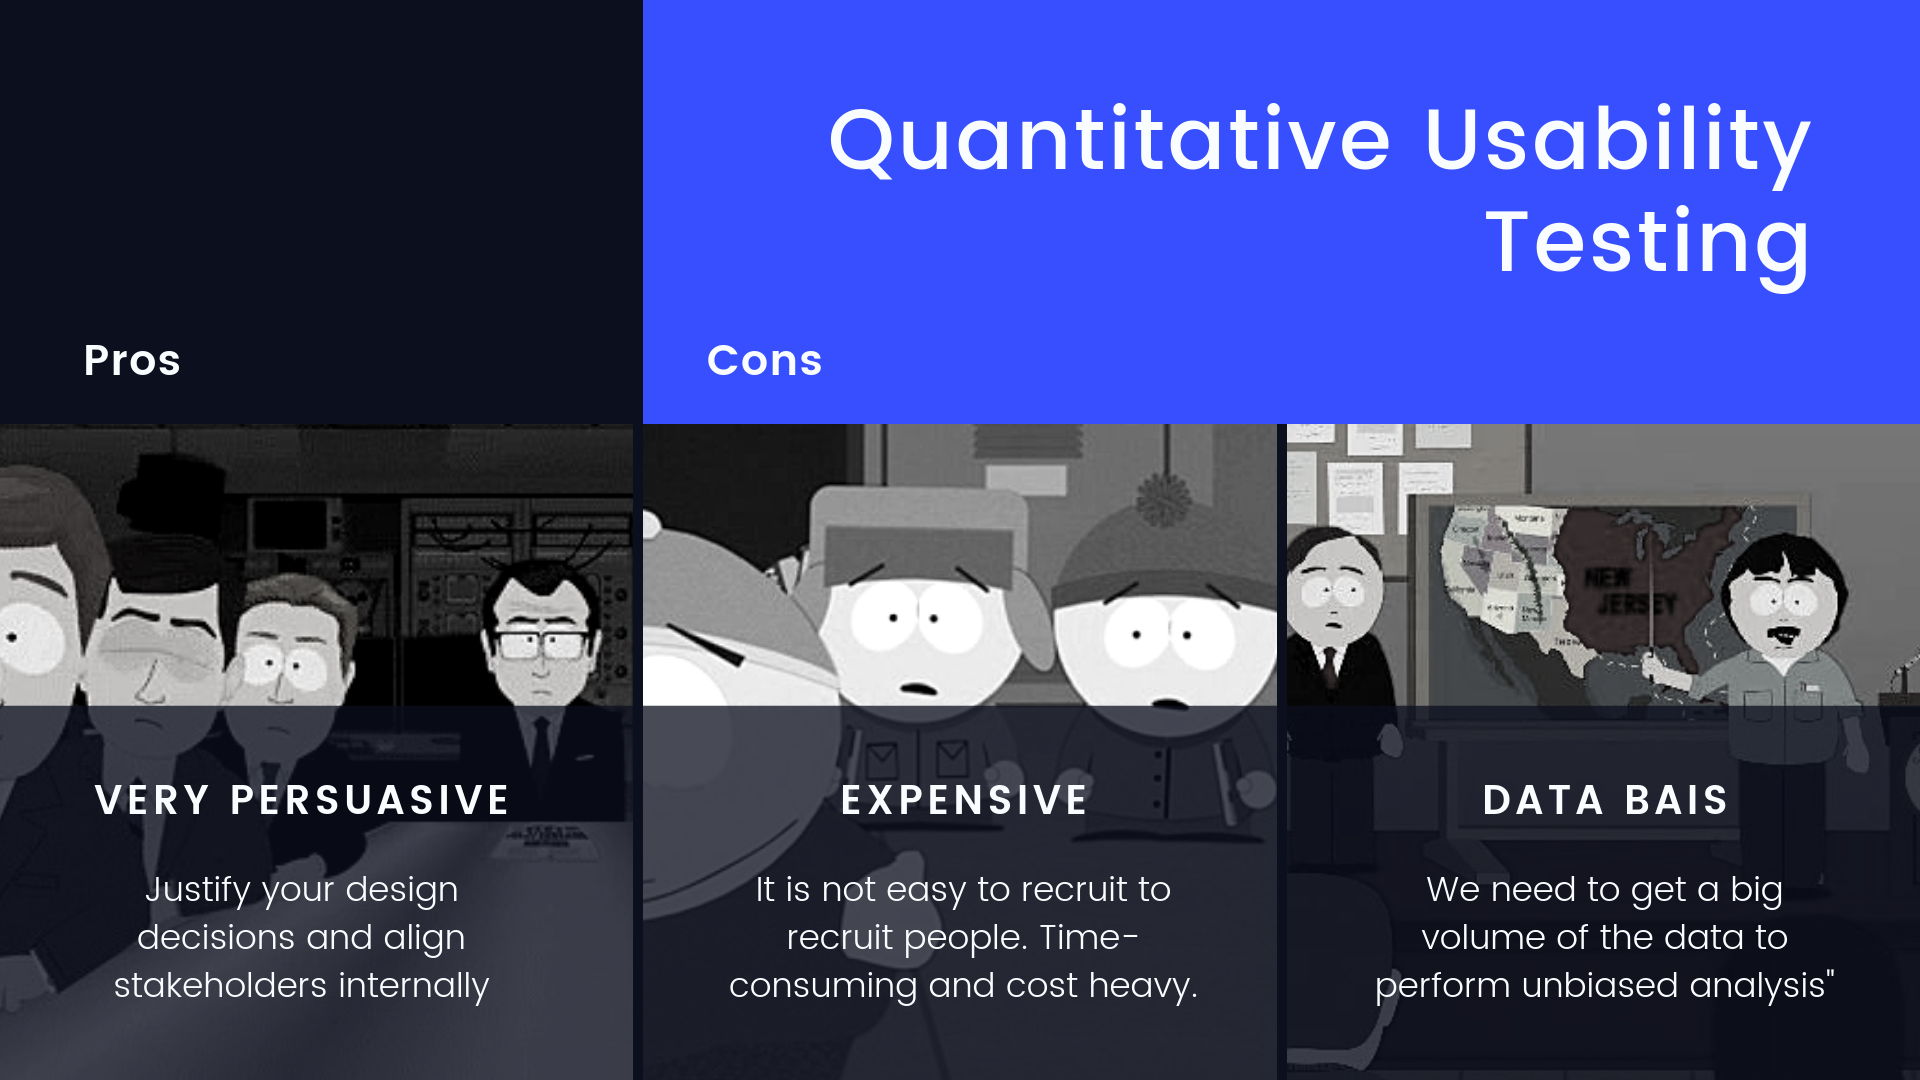
- Very persuasive, in terms to justify your design decisions and align stakeholders internally. This happens all the time when we have a group of people like business, development, and sales. If you have strong data on behave of the users, you can have a very strong statement to support your suggestion.
Con:
- It needs a lot of data for the conclusion. And it is not easy to recruit users. The process is very expensive. Time-consuming and cost heavy.
- Design is not really driven by the data we get. So this is the limitation of the data bais. If you only have 5 users all from one state you can’t get different perspectives from different states. So we need to get a big volume of the data to perform unbiased analysis.
4. What do you usually measure during a quantitative usability testing?
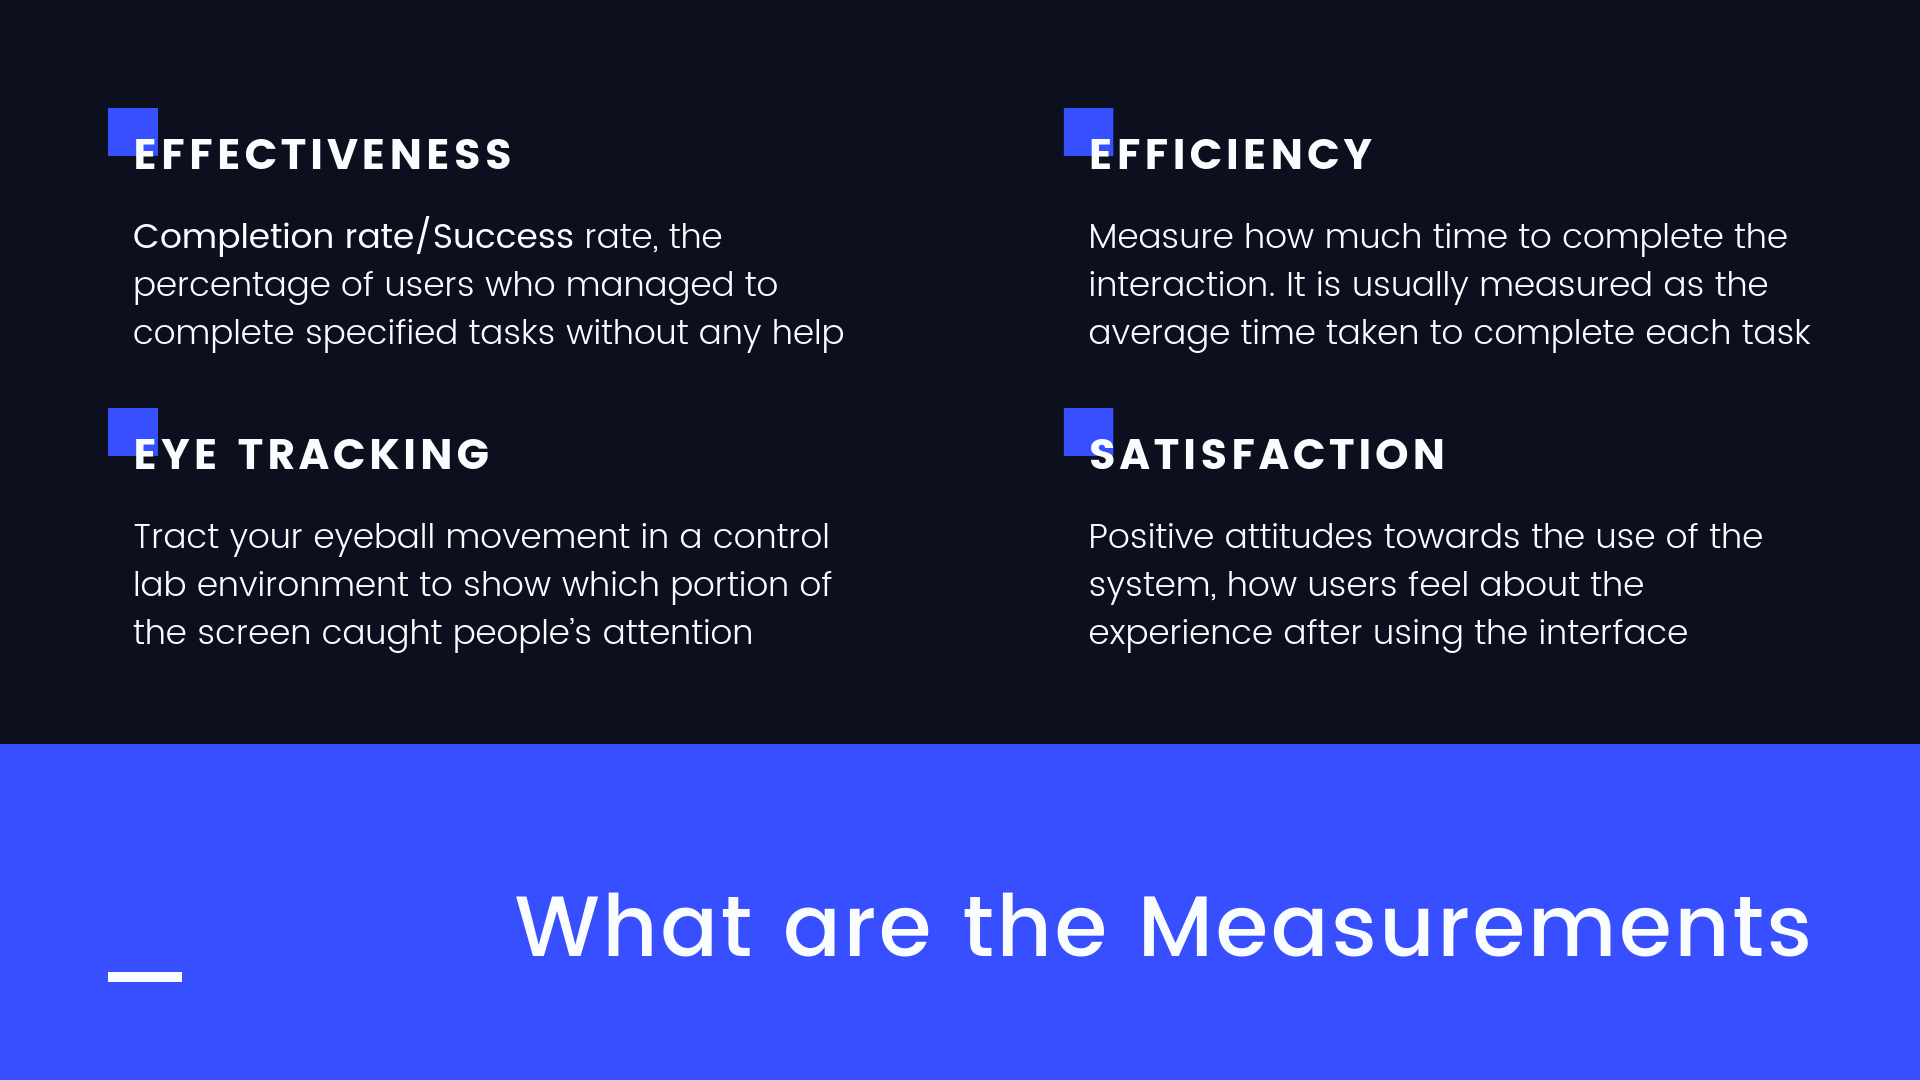
You can measure how much time to complete the interaction. Completion rate. You can’t give them unlimited time, at some point, you have to cut off and see it as a fail. Eye tracking. You can see which portion of the screen caught people’s attention.
5. Can you describe a case when quantitative usability results influence design decision?
During a navigation system validation that we did before for a web app. We were designing a search engine, so it was very information heavy and took a lot of horizontal space. A designer’s instinct would hide the navigation menu. But business stakeholders want to give users immediate access to all different products.
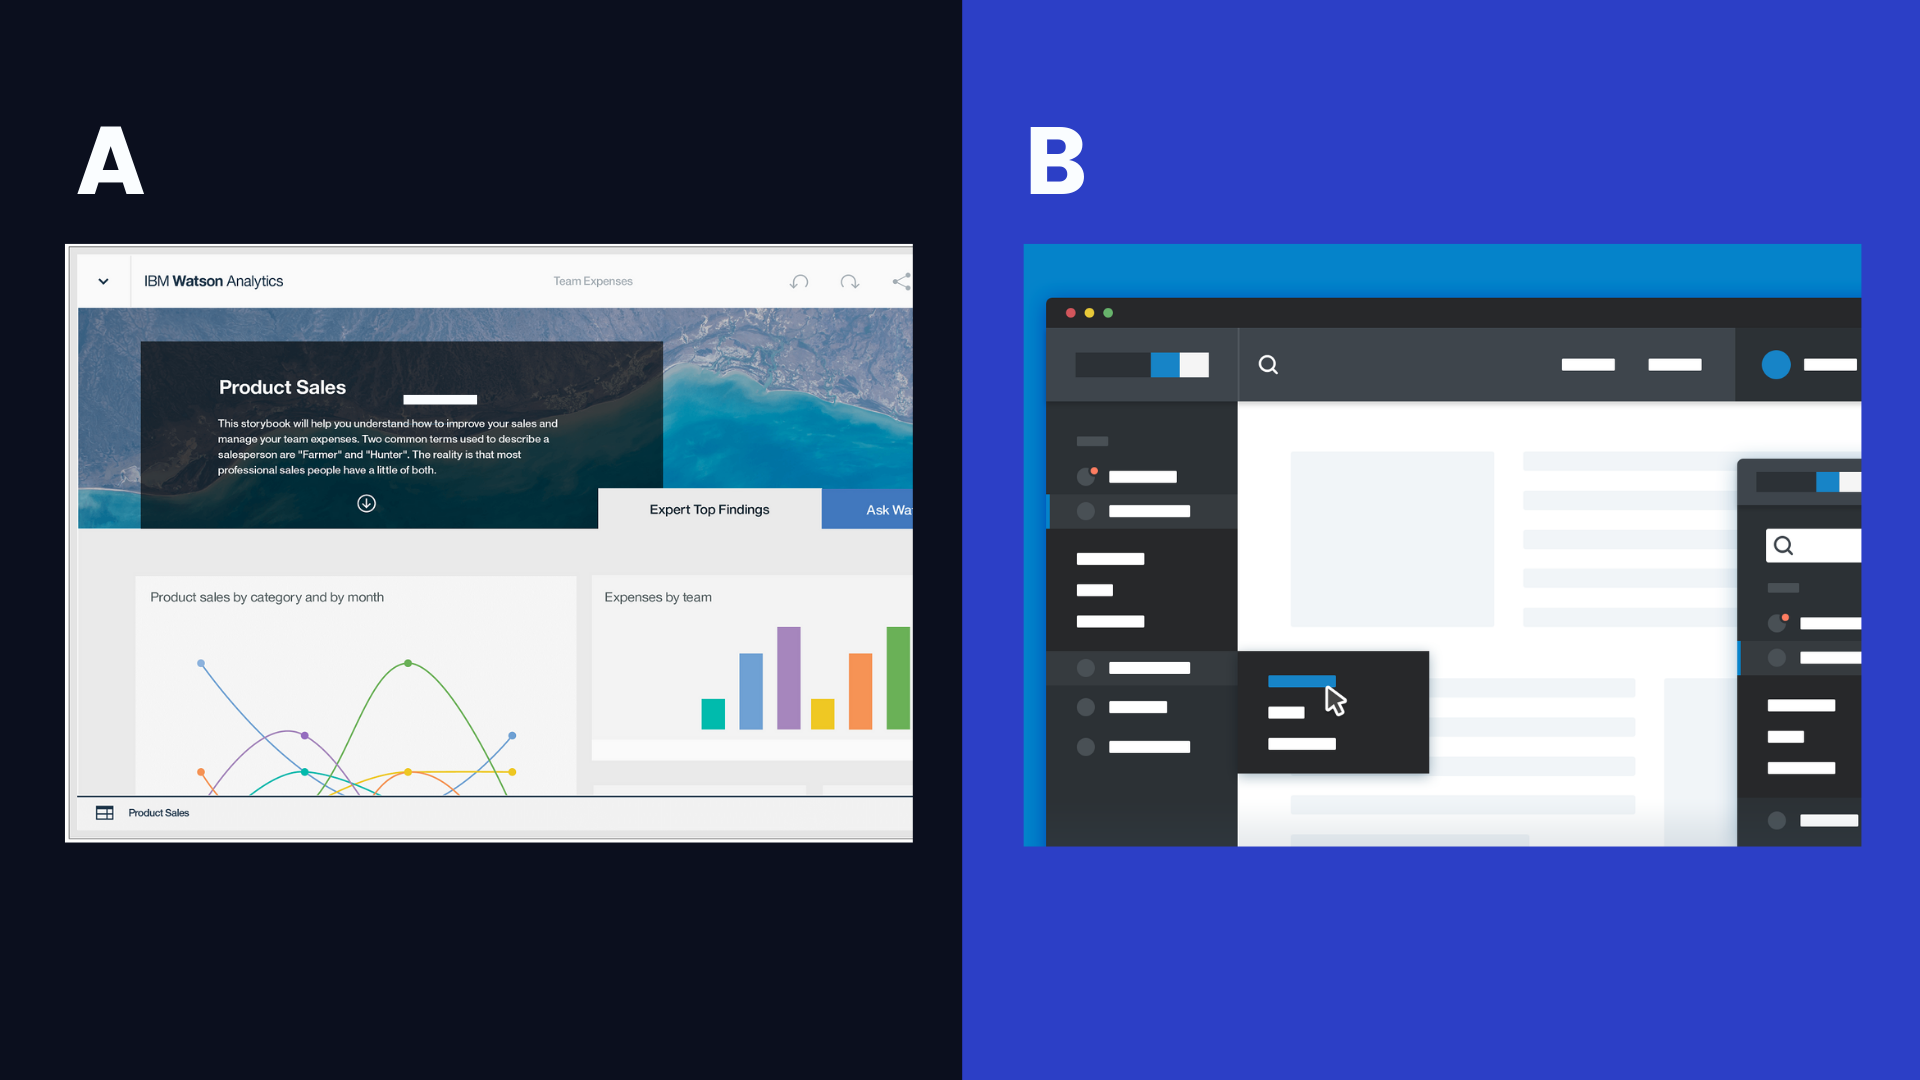
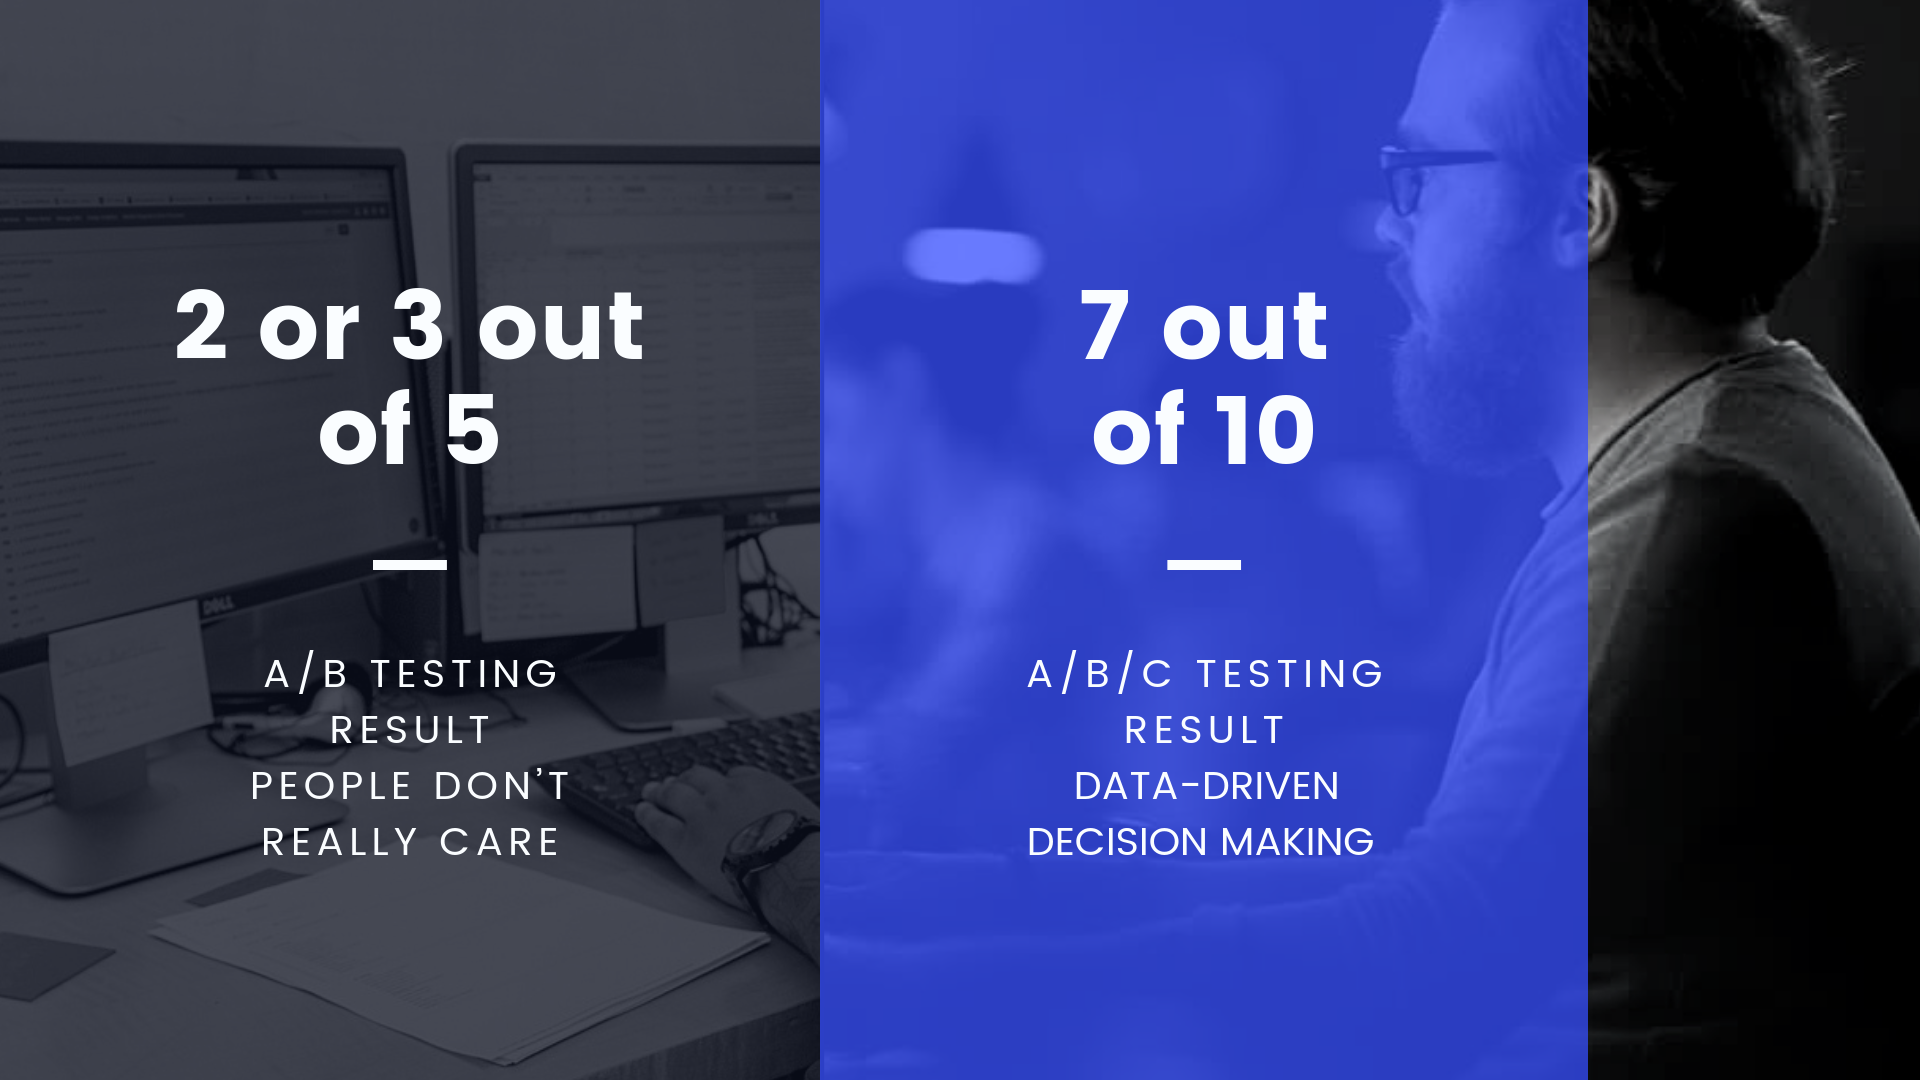
So we did A/B Testing. But the result is: People don’t care whether it’s hidden or not. Because they use two big monitors all the time, so horizontal space really doesn’t matter to them. So we came up with a hybrid design. Hamburger button and Icons of different applications are shown on the sidebar and after clicking the hamburger button, all the labels will show.
Then we tested another 5 users and 7 out of 10 liked the third option. We let the data tell the story.
6. Can you describe a case when “number” convinced folks like executives?
If you want to enhance experiences, we use a behavioral analysis tool called “Amplitude” to track users’ interactions with the application. After improving a certain step, you can run a test to see if the result is better than before. For example, if the result is 20% better. That can give you enough confidence to change the step.
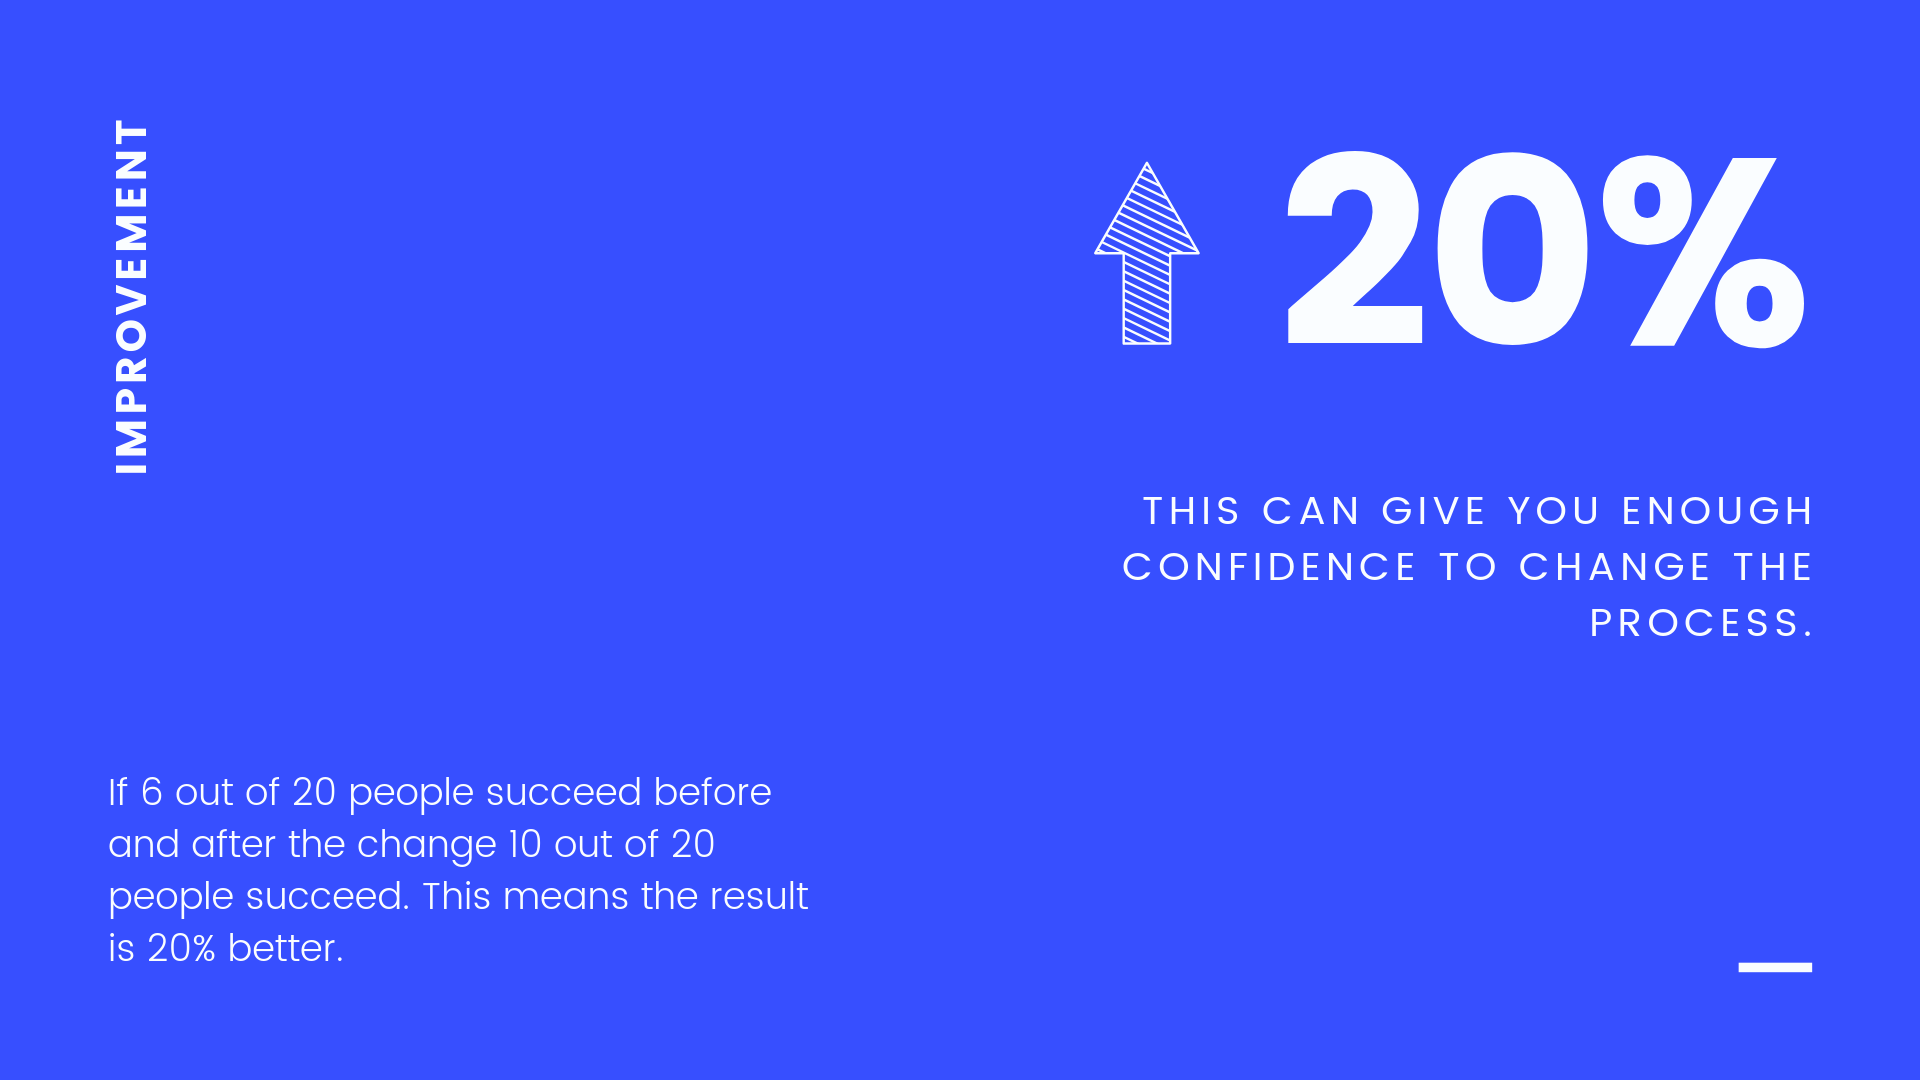
So besides the visual part, quantitative usability testing can also help improve the overall experience.
References
Quantitative User Testing Methods Retrieved from http://usabilitytesting.sg/user-experience-course/lesson-6-quantitative-user-testing-methods/
Jakob Nielsen (January 21, 2001) Usability Metrics Retrieved from https://www.nngroup.com/articles/usability-metrics/
Jakob Nielsen (November 21, 2011) Accuracy vs. Insights in Quantitative UsabilityRetrieved from https://www.nngroup.com/articles/accuracy-vs-insights-quantitative-ux/
Kate Moran (April 22, 2018) Quantitative User-Research Methodologies: An Overview Retrieved from https://www.nngroup.com/articles/quantitative-user-research-methods/
Measuring UX and ROI Retrieved from https://www.nngroup.com/courses/measuring-ux/
ARMEN GHAZARYAN (JANUARY 21, 2015) 5 UX KPIs You Need To Track Retrieved from https://designmodo.com/ux-kpi/