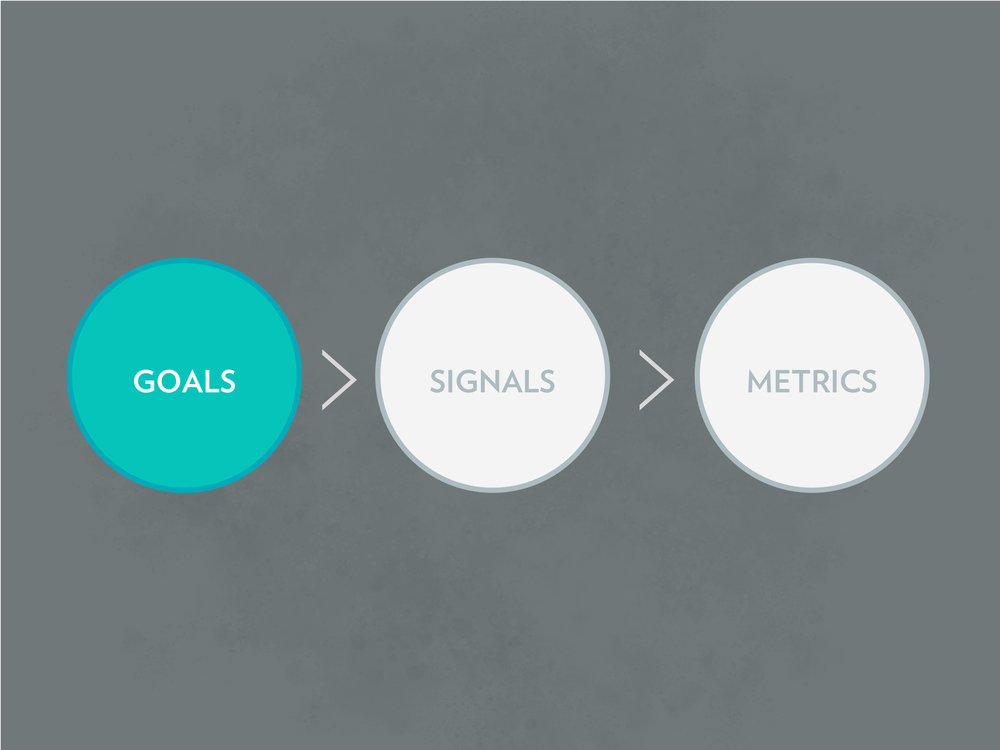
The HEART Framework sorted the different behavioral and attitudinal metrics/KPIs into 5 categories, allowing the product team to use it as a reference to decide which particular category should be included or excluded. However, how can we further narrow down the scope to each category, to decide which specific metrics to implement and track to make data-informed decisions? The Goal-Signal-Metrics Process is a powerful tool developed by Google to map product/feature goals to specific metrics, allowing the product team to focus only on the most useful metrics relates to the product/feature.
Goals
The first step is to articulate the top-level goal for the product/feature among the product team. Different members may have different ideas regarding the project goals and working without a common ground often results in unclear decisions and endless debates. Collecting different opinions through discussions helps to build consensus and prioritization. In addition, talking to investors and stakeholders would also ensure the business goals and the goals generated by the product team are aligned.
One thing to note here is that avoid to define the goals using existing metrics such as “increase traffic” or “increase purchase”, but how may the improvement on user experience lead to the desired outcome. Using the HEART Framework in this process prompts the product team to narrow in when articulating the goals. It also reminds the product team to separate the success for a specific feature goal with the whole product, since sometimes they may not be the same. For example, for any social media application, one of the key goal is in Engagement but for the built-in search function, the key goal falls into the Task Success category.
Signals
Once the goals are set, it is time to map low-level signals, which can be deciphered from user behavior or attitudes, with each goal. The signals can indicate success, for example, the number of likes users give, subscriptions they sign up for or videos they watch. It could also be failure signals, such as abandon rate or “undo” events. And sometimes pain points can contribute more compare to positive points in building a better product.
In most cases, there are multiple useful signals to track the same goal. Choosing the proper signals requires the product team to consider the method of data collection – whether it is easy or difficult to track the signals. Additionally, the chosen signals should be sensitive to the respective goal and solely respond to the changes in the user experience, rather than any unrelated factors.
Metrics
In the final stage, the selected signals should be transformed into metrics that are trackable over time or used for comparison. Normalizing the collected data for analysis is essential. So instead of raw counts, use means, percentages, or average per user and decide which is more suitable when evaluating the user experience. Moreover, be aware of the validity of the data, make sure the data collected are conducted by the real users rather than from automated sources, and make sure their actions are being logged. Last but not least, include the metrics using by the competitors in case of the need for conducting a comparative analysis.
Conclusion
Overall, by helping the product team to first articulate goals, then identify signals, and eventually select appropriate metrics, the Goals-Signals-Metrics Process ensures the product team focus on metrics that closely related to the product/feature goal, avoids the pitfall of wasting time on those “interesting” but unnecessary data, eliminates confusion among the team members, and make sure every decision made by the product team is effective and data-informed.
However, since the methodology was developed recently, more research will be needed to further evaluate the effectiveness of the method, or define which metrics in each category are more accurate in terms of measuring the user experience. In addition, the process might work solely when it comes to other decision-making Processes but functions most effective when conducting with the HEART Framework to measure user experience.
Reference
Rodden, K., Hutchinson, H., & Fu, X. (2010). Measuring the user experience on a large scale. Proceedings of the 28th International Conference on Human Factors in Computing Systems – CHI 10. doi: 10.1145/1753326.1753687
Rodden, K. How to choose the right UX metrics for your product. Retrieved from https://library.gv.com/how-to-choose-the-right-ux-metrics-for-your-product-5f46359ab5be
Nowaczyk, M. Combining HEART With The Goals-Signals-Metrics Process To Determine Which UX Metrics To Use. Retrieved from https://usabilitygeek.com/combining-heart-framework-with-goals-signals-metrics-process-ux-metrics/
Lernell, C. Experience Metrics and the Goals-Signals-Metrics Process: An Overview
. Retrieved from https://community.uservoice.com/blog/product-user-experience-metrics-looking-at-googles-heart-and-the-goals-signals-metrics-process/