
I came across this usability research tool the Rainbow Sheet in a case study. I took some time to research on this tool and found it to be a very concise and quick tool for generating insights from the user testing and a visually pleasing way to deliver the findings.
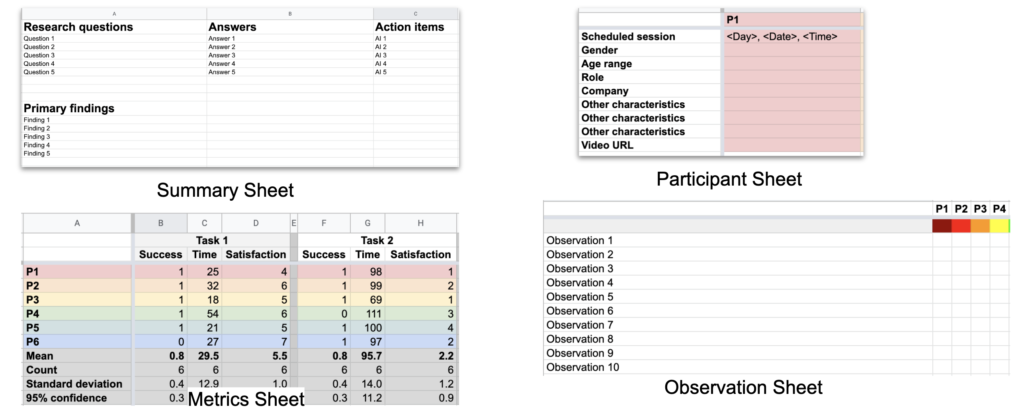
The Rainbow sheet consists of five spreadsheets: Summary, Participant, Observation, Metrics, Raw. The Participant sheet is a spreadsheet of any Participant’s information and characteristics that could be critical to the study. The Metrics sheet is a spreadsheet of important UX metrics. The three basic metrics in the templates are the success rates of tasks, the time to complete tasks, and self-reported satisfaction ratings. The Observation sheet is used to record and discover user behavior patterns during or after testing sessions. The summary sheet is the insights/learnings spreadsheet consisted of research questions, answers to research questions, action items and primary findings. The raw sheet contains any additional information that couldn’t fit into the other four categories. The observation sheet is the main part of the rainbow sheet document. The other four spreadsheets are supporting documents which helps researchers gain a more complete picture of the usability study.
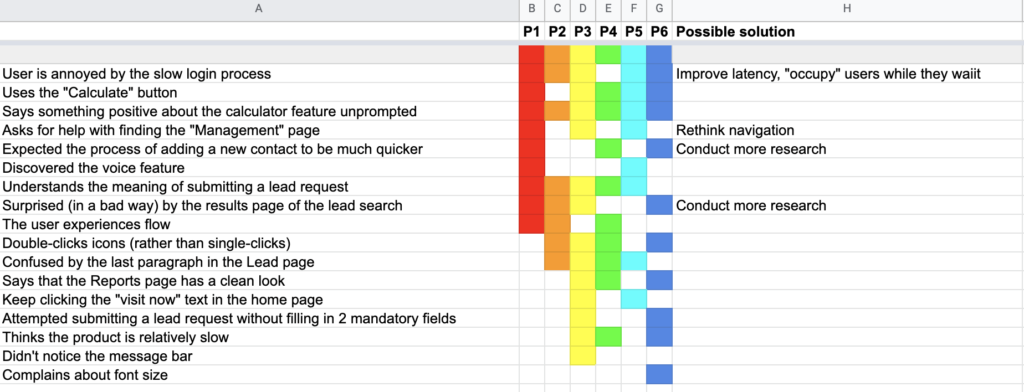
To use the rainbow sheet, first of all, researchers needs to assign each participant a color and a label (P1-P12). Secondly, researchers can put any expected or observed behaviors on the left column under Observations. Thirdly, when behaviors under observations are performed by participants during testing, researchers fill the participants cell with their assigned color (refer to image 1.0). There you have a rainbow spreadsheet filled with colors. You can use this spreadsheet to summarize common user behaviors throughout multiple user testing sessions quickly and generate insights. Lastly, researchers can put possible solution on the right column next to frequent user behaviors, such as “can’t find the sign up button”. The last step is optional. It is recommended if you want to use the rainbow sheet as an independent report.
The rainbow sheet could be used during or after user testing sessions. If it’s used during the testing sessions, every note-worthy behavior should be added efficiently under the observation column. It requires a significant amount of attention and effort from every observer and researcher. If it’s used after user testing sessions, a quick debrief after each testing session is recommended. It ensures every team member contribute to the Rainbow Sheet, because most importantly, the rainbow sheet is a collaborative tool.
The rainbow sheet is a very flexible tool and should be used adoptively to different study needs. Some researchers use the rainbow sheet (consisted of five spreadsheets) in replacement of a written report. Some researchers use the rainbow sheet (observation) to help them generate insights or prioritize tasks. Some researchers use it as a supporting document to illustrate the testing results in a visually appealing way.
Although there are many benefits of the Rainbow Sheet, there are also a few limits to keep in mind. Firstly, it is not suitable for very small data sets. When there are few data, affinity diagram could be an alternative. Secondly, it is not suitable for unmoderated studies (or studies that are not in a controlled environment, because it is difficult to capture all the behaviors and details), such as online surveys or fieldwork.
At last, I want to thank Zoraida Cabrera-Mieles and Tomer Sharon for writing wonderful articles on this topic. Tomer also kindly shared this Rain Sheet template at the end of his article in case you’re curious.
References:
https://uxdesign.cc/the-rainbow-sheet-a-visual-method-for-research-analysis-a7e7d2011058
https://www.smashingmagazine.com/2013/04/rainbow-spreadsheet-collaborative-ux-research-tool/