Project overview
Seafood Watch is a program of the Monterey Bay Aquarium that seeks to promote sustainable seafood by transforming the seafood industry. Our dynamic team of four members was given the task of analyzing how Seafood Watch users utilize the search features on their website using their recommendation database. We were able to track user search trends through our analysis and provide meaningful recommendations to improve the user’s satisfaction and the visibility of their PDF recommendation in their database.
Research Objectives
- How are users utilizing search options on the website?
- Which search locations are users operating?
- What are users searching for?
- Do users appear satisfied with their search results?
Meet the team:
As a team, we all worked together on all the tasks; however, we individualized tasks for organizational purposes at the latter of the project.
- Amiya Dewan: Search Content and Location
- Marisa Kurtz: Website’s Overview
- Janet Liu: PDF Downloads and User Journeys
- Lemark McPherson: Website Traffic Sources
Tools Used
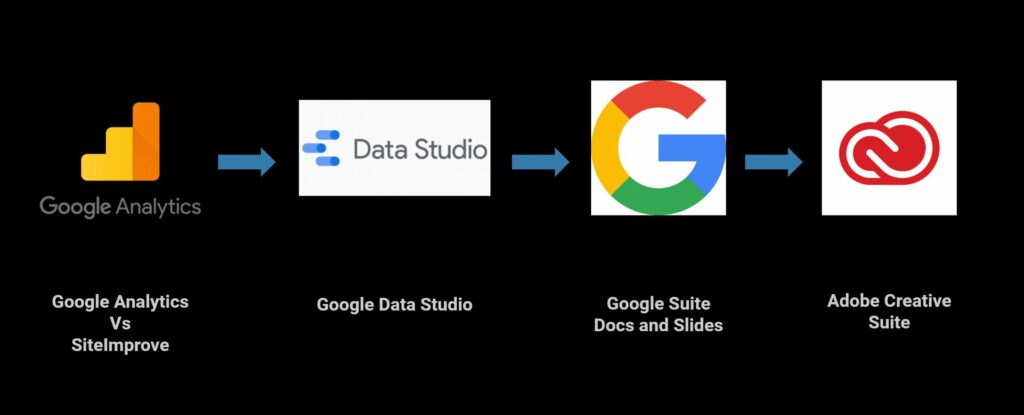
Google Analytics helps our team analyze how the users enter the website and how they used the search functions on Seafood Watch, our primary goal ( search and recommendations). We also saw where the users are coming from, their journey, and how they are getting to the recommendations. Our team created a dashboard to help Seafood Watch quickly access all of this data in one place from the data collected. Having these findings visually represented on a dashboard will help Seafood Watch understand their user behavior better and make updates to improve the user experience.
Methodology
PROJECT SCOPE
Seafood Watch launched a new website on December 2, 2020. They have been collecting analytical data for tracking purposes. We are tasked to collect data on how their users use their recommendation search engine and provide our findings, compliment, and or recommendations.
GOOGLE ANALYTICS v SITEIMPROVE
We were lucky to work with Seafood Watch who has two analytic tools: Google Analytics and SiteImprove. As a team, we learned that there were some discrepancies between the two analytical tools. So in our second meeting with the client, we discussed the discrepancies found between the tools. Our client was ok with us focusing on one of the tools, so, as a group, we decided to focus on Google Analytics because we felt more comfortable in our abilities to interpret data on that platform.
CLIENT MEETINGS
Several client meetings were had to guide our project in order to meet the client’s goals. The first meeting was the most vital one because we met a few members of the Seafood Watch Team. We did a round table introduction and dived into Seafood Watch’s desired project outcome.
GOOGLE DATA STUDIO
Google Data Studio was used to design an interactive Dashboard that visualized our key metrics. As a team, we brainstormed by creating visualizations that we believed would be helpful for the project, after which we assigned individual team members specific findings so we could be more detailed we our recommendations and findings. We got important directive feedback from Professor Villaespesa, which helps us to edited and organized our Dashboard to display the most relevant KPIs and findings.
GOOGLE DOCS AND SLIDES
Google Doc was used to organize our team notes and document drafts. Our team also used Google Slides to compile our final presentation. This allowed us to collaborate easily from anywhere and at any time.
Findings
Search findings
- 11.4% of website visits contain Site Search usage. Even though this is a small percentage, the search behavior is one of the main goals of this analysis.
- Most users search on the Homepage Search bar.
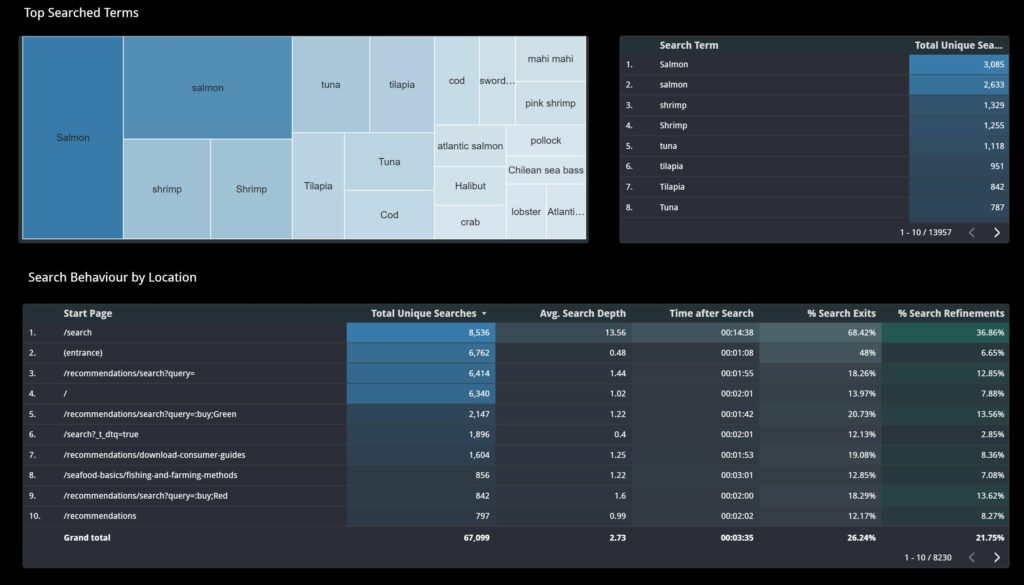
- The Homepage Search has a much higher percentage of Search Exits (77.2%) compared to the Recommendations page Search (18.15%) even though the first only has 18% more total unique searches than the latter. This may indicate that users are not finding what they are looking for on the Homepage Search. Or maybe they are finding exactly what they are looking for.
- Most users search for fish species, even if it is on the Homepage keyword search bar.
- Salmon is the most searched term followed by shrimp. However, the website separates search terms by case, making it difficult to find the total entries for each term.
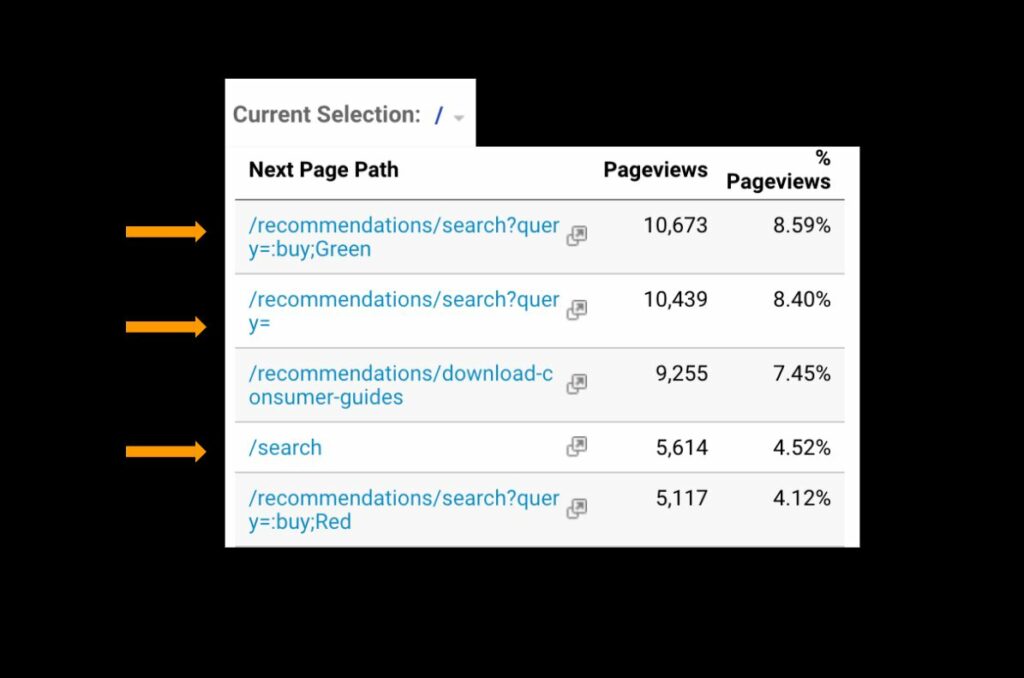
- Users starting on the Home Page get to the recommendations by using the Search Block (8.59% page views) or navigating to the Recommendations Search Page (8.4% page views). They are least likely to use Global Search (4.52%).
Recommendations
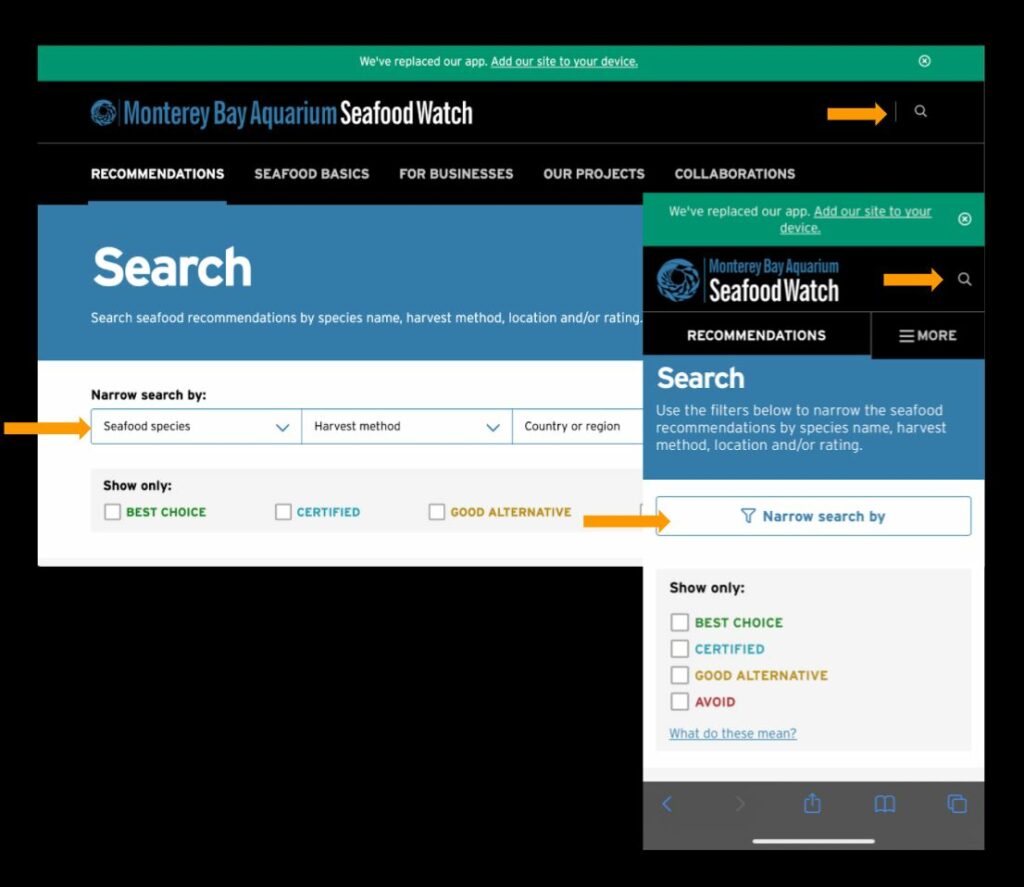
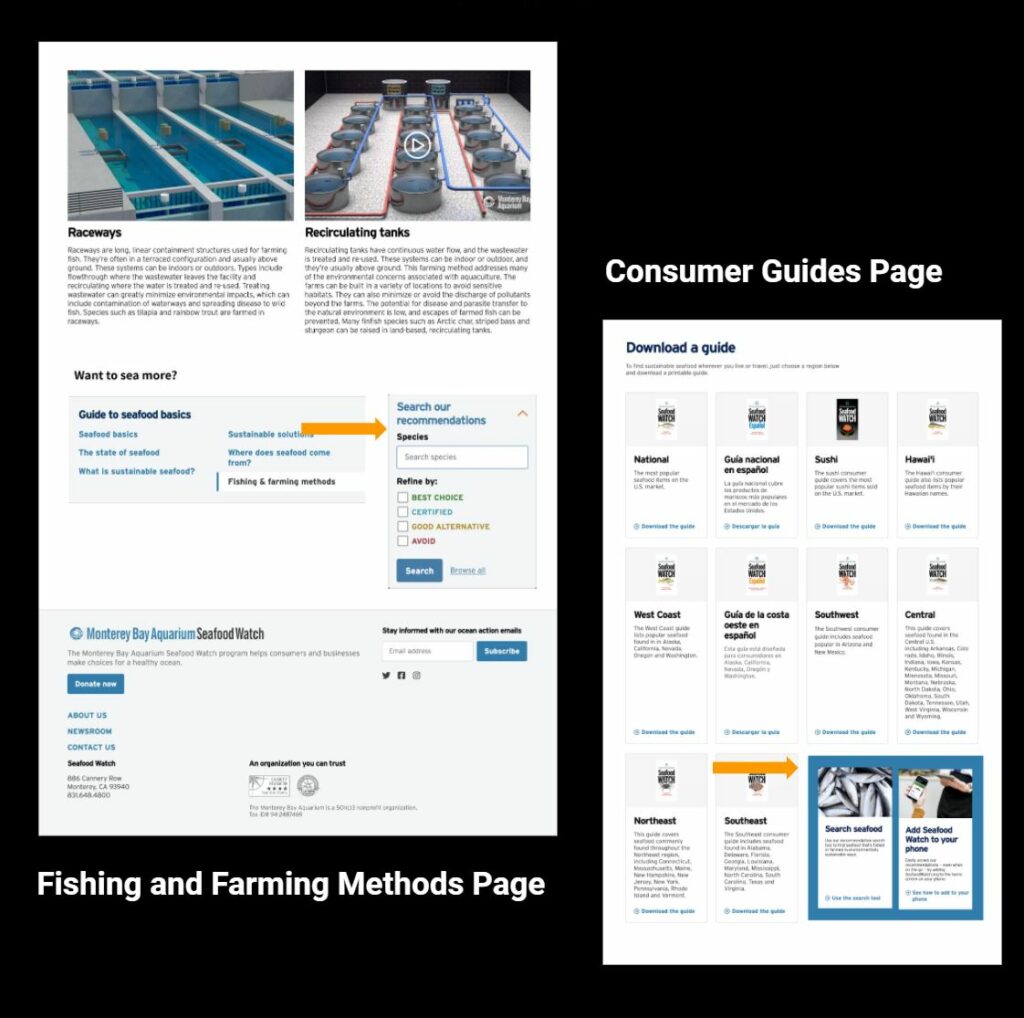
- The Species Search on the Recommendations page is not immediately discoverable upon entering the page. On mobile, it even requires an extra step.
- As most users are searching for species and 41.8% of users are searching on mobile phones, it will help to make the Species Search visible upon entering the Recommendations page. Since the Homepage Search is less useful to target users, it may be better to make it less discoverable by moving it to the footer.
- Remove case sensitivity for search terms to view search term-related results more accurately.
- Change “species” to “search recommendations”. Predictive search using top searched terms.
Traffic Analysis
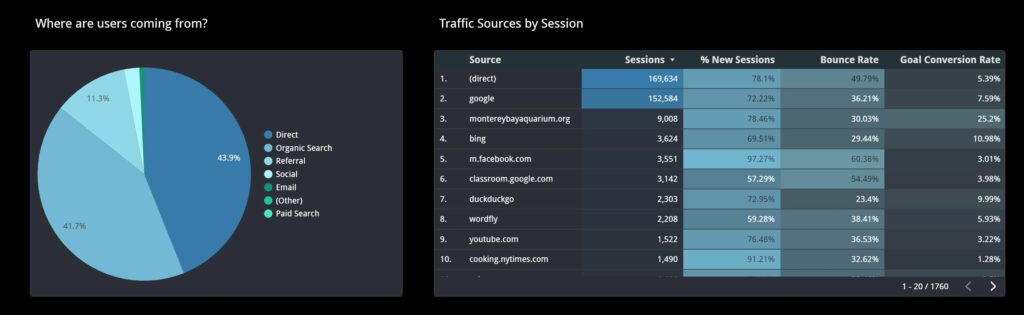
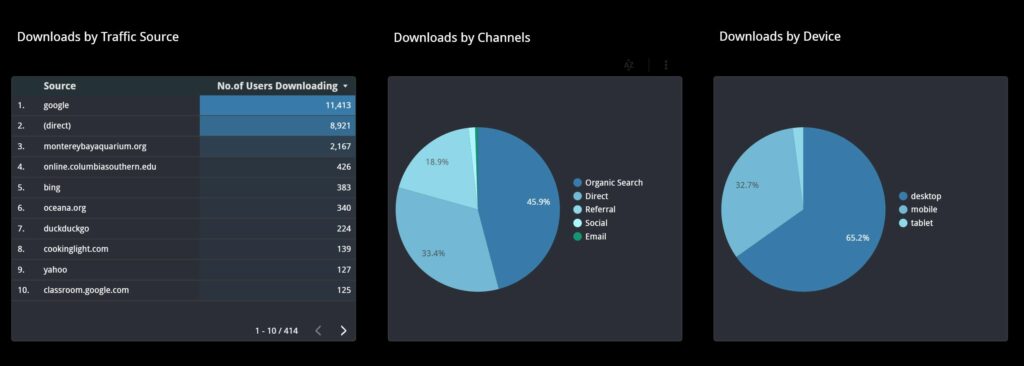
- 43.4% entered the website by way of organic traffic. “Organic traffic” means people who type keywords in google, bings, etc., looking for seafood information.
- The data indicates that a little over 41% of Seafood watch users access its website directly.
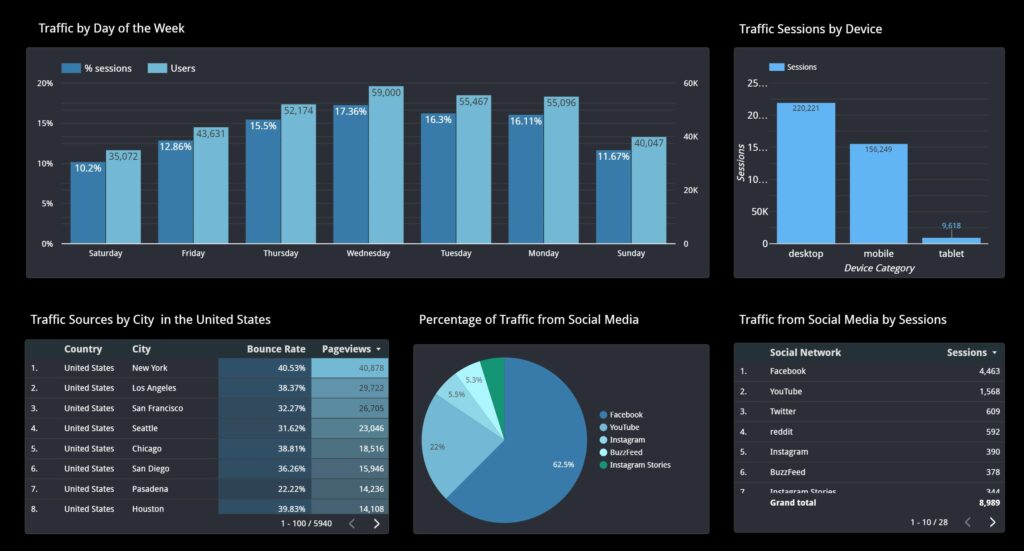
- A vast majority of Seafood Watch users access the website from New York, followed by Los Angeles.
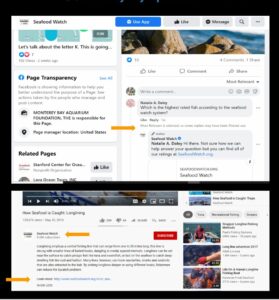
- Out of the users arriving at the Seafood Watch website through social media, 62% access the website via Facebook, followed by Youtube at 22%.
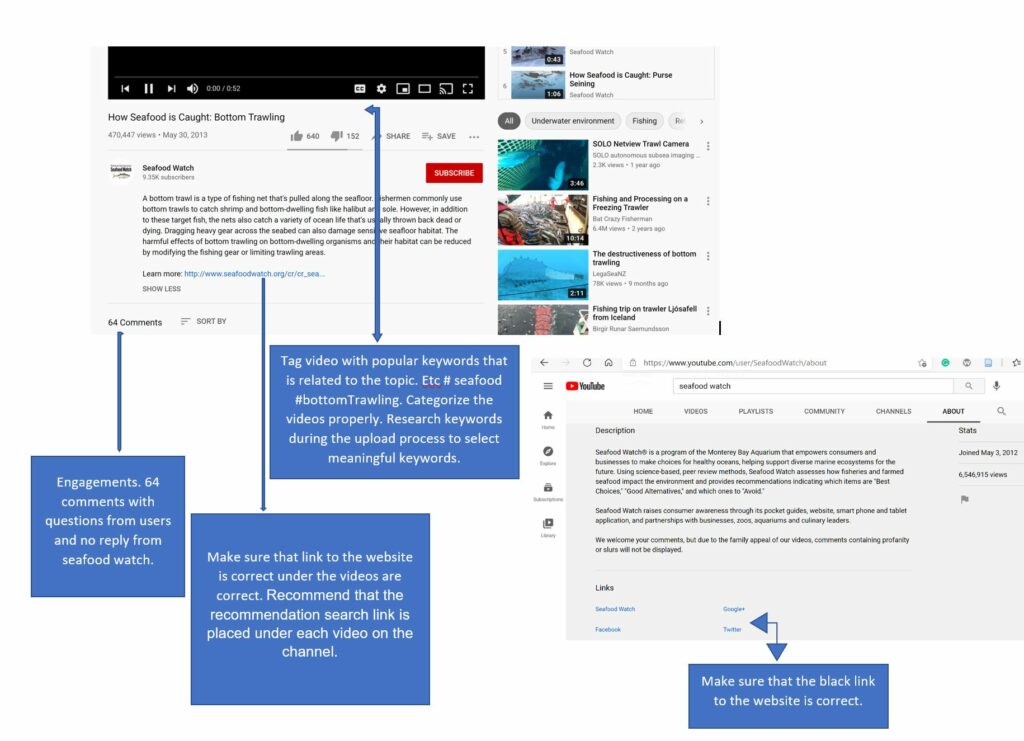
- Some of the links that should link back to the Seafood Watch website on their youtube channel are broken.
- Some of the video’s names are not searchable and do not link to Seafood Watch.
- Some of the videos are not tagged on the youtube channel.
- All of the links that link back to the Seafood watch website on the youtube about me page are broken.
- Most users access the website on Wednesdays, followed by Thursdays.
Recommendations
- Adding recommendations PDF content on the social media platform so it can be shared, which will improve the website’s visibility, hence promoting the access and usage of the recommendations.
- Place someone in charge of social media pages that will respond to users’ questions within 24 hours.
- Get Youtube account verified
- Optimize Youtube video description by adding related links to the official website.
- Make sure all links to the website are working properly ( Not broken).
- Tag video with popular keywords that are related to the topic and will link to the website.
PDF Downloads
- Although the project’s initial goal centered around Seafood Watch’s desire to learn more about search behavior, our contact, Helen Cooper, expressed an interest in our findings of PDF downloads.
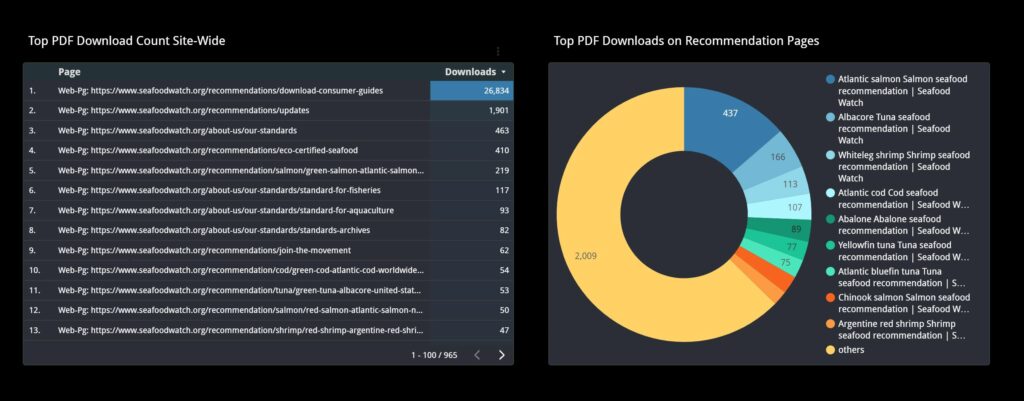
- Currently, only 7.11% of visitors are downloading PDFs from the website.
- The majority of PDF downloads occur on the Consumer Guide page. Seafood Watch has 10 Consumer Guides available for PDF download on their website.
- Other PDF Report downloads occur on a variety of different content pages like specific seafood, updates, and standards pages.
- Currently, Seafood Watch does not utilize Google Analytics to distinguish between PDF Consumer Guide Downloads and other types of PDF downloads.
Recommendations
- Downloading PDFs is a measurable performance indicator of how users are engaging with Seafood Watch content past the immediate website and if they are satisfied with the found results.
- The visibility of consumer guides targeted to everyday consumers could be much more prominent across the website.
User’s journey
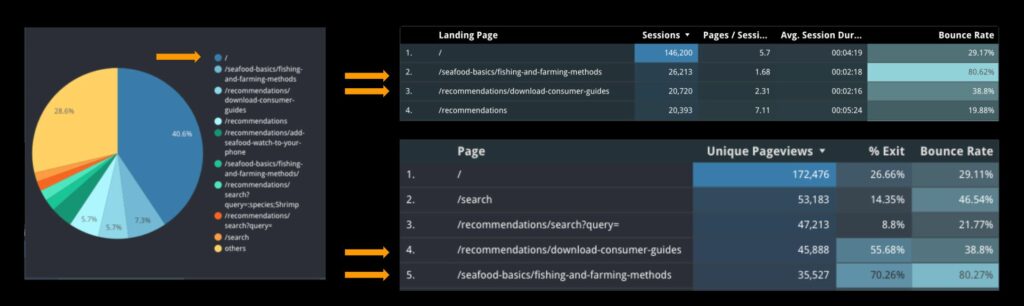
- Over 40% of users start their journey on the Home Page and 28% on the Fishing and Farming Methods Page.
- The top sections of the website are the Recommendation Pages followed by the Home Page.
- The average duration per session is 3:30 minutes with 4.4 page views per session. Users spend on average 1-2 minutes long and view 2-3 pages more when starting from the Home Page or Recommendations section, which indicates that users are engaged and curious to explore more content of your site.
- The most popular pages include Download Consumer Guides (45,563 page views) and Fishing and Farming Methods (35,188 page views) which are also the top landing and exit pages (over 50% %exits) with the highest bounce rates.
- Users starting on the Home Page get to the recommendations by using the Search Block (8.59% page views) or navigating to the Recommendations Search Page (8.4% page views). They are least likely to use Global Search (4.52%).
- Over 80% of users starting on the Fishing and Farming Methods or Download Consumer Guides pages will bounce than continue searching.
- They are also more likely to use Global Search than navigate to the Recommendations Search Page.
Recommendations
- Adding a recommendations search block on
- popular pages Even though Fishing and Farming Methods and Consumer Guides are the top exit pages, the average time users spend on the page is 6 minutes and 2 minutes, respectively. This shows that users are engaged with the content before exiting.
- Consider adding a recommendations search block or links to other popular pages to 1) lower bounce rate for landing and popular pages 2) increase average pages per session 3) navigate away from global site search 4) encourage users to use search recommendations and continue their website/search journey.
CONCLUSION
Seafood Watch is a program of the Monterey Bay Aquarium that seeks to promote sustainable seafood by transforming the seafood industry. With the relaunching of their website in December 2020, Seafood watch is curious to know how users are accessing their search recommendation database and utilizing their search capabilities. We were able to uncover some major findings from analyzing user search behaviors, user trends, and search tools and were able to provide concrete recommendations to help improve user’s satisfaction:
- Recommendation 1: Make Species Search more visible than Homepage Search
- Recommendation 2: Improve metrics to track PDF downloads and increase the visibility of PDF downloads on related pages
- Recommendation 3: Traffic Sources
- Recommendation 4: Add a recommendations search block on popular pages.
If these recommendations are considered, Seafood watch should afford its users a better user experience. As Pratt UX student design team, we’re confident that the recommendations provided in our full evaluation report, google data studio dashboard, and in our class final presentation will help Seafood Watch users find information quickly and more efficiently when accessing their seafood recommendations database.