PROJECT OVERVIEW
Seafood Watch is a project of Monterey Bay Aquarium that aims to spread knowledge about sustainable seafood and provides recommendations to businesses and everyday seafood consumers to reduce the negative impact of the seafood industry on the oceans. The new Seafood Watch website launched on 2nd December, 2020 and this project analyzes the website visitors’ search behavior while also looking into their journey through the website.
GOALS
While the main goal was to analyze how users are utilizing the different search functionalities on the website, our team also analyzed and provided recommendations on:
- User Journey
- Traffic Sources
- PDF Downloads
OUTCOMES
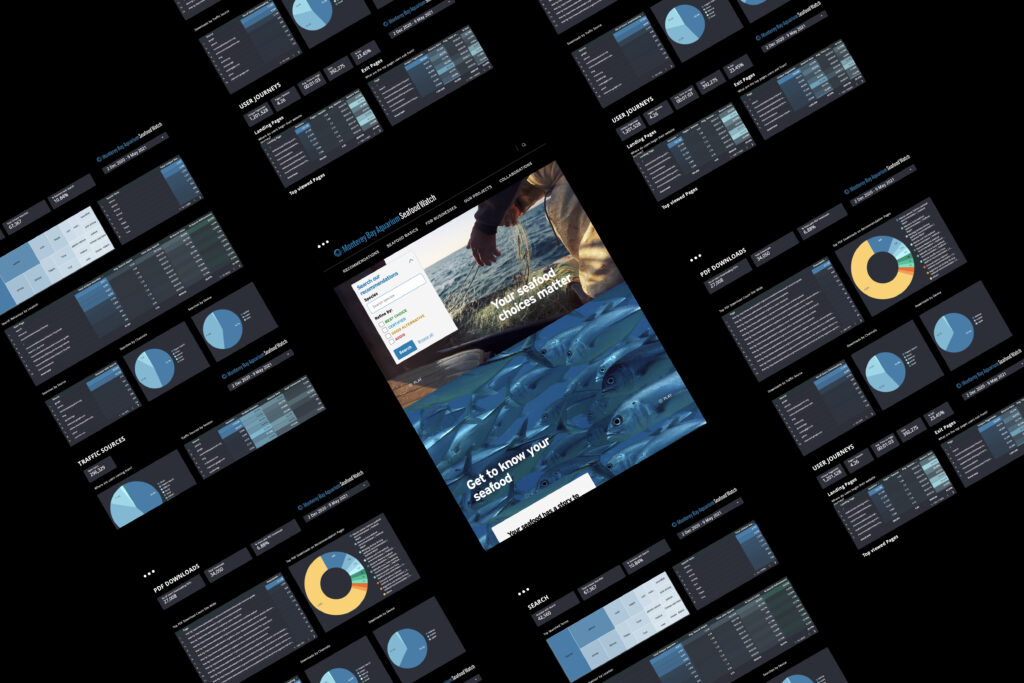
- Dashboard – A 5 page dashboard presenting an overview of site usage, search behavior, traffic sources and user journey
- Evaluation Report – Detailed report of our process, findings and recommendations
- Presentation – Slideshow of our main findings and recommendations that was presented to the client
THE TEAM
- Amiya Dewan
- Janet Liu
- Lemark McPherson
- Marisa Kurtz
MY ROLE
Design and Communication – Because of my background in design and to maintain consistency, I took the responsibility of designing, formatting and making final edits on all the documents we created. I also maintained communication with our client, guided meetings and presentations.
Data Gathering and Dashboard – I gathered Search and Pdf Download related data and created the dashboard pages for them. I customized the theme based on our client’s branding.
Evaluation Report – The Introduction and Search behavior related findings, recommendations and mockup were done by me.
TOOLS USED

PROCESS
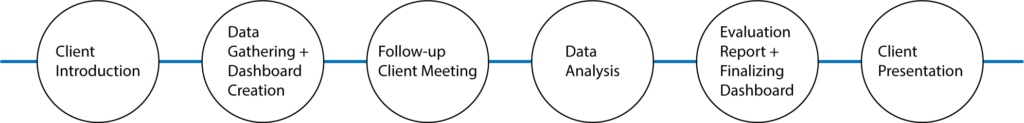
We had 2 initial meetings with our client, one as an introduction where we got to know their main goals for this project and another where they introduced us to the different analytics tools they are currently utilizing and what they thought we might find useful.
Our team found slight discrepancies between the two tools available to us, Google Analytics and SiteImprove, even though they were both presenting similar data and trends. We decided to use Google Analytics in order to maintain consistency. Using this also made it incredibly easy and smooth to connect the data to Google Data Studio, which we used to create the dashboard. Our follow up meeting where we presented the dashboard to the client went successfully as they were pleased with the data we had collected – it was what they were looking for and plenty more.
Other than putting together the dashboard with relevant KPIs and charts on each page, we also pulled data visualizations we found useful from Google Analytics to inform our findings and recommendations.
Some limitations we found Google Data Studio had were that we could not show the user journey or behavior flow on it the same way Google Analytics does; and we could not show and overall picture of what percentage of users were conducting searches, visiting recommendation pages, downloading pdfs and how these overlapped.
RESULTS
Our findings are recommendations were categorized similarly to the dashboard:
- Search
- User Journey
- Traffic Analysis
- PDF Downloads
SEARCH FINDINGS
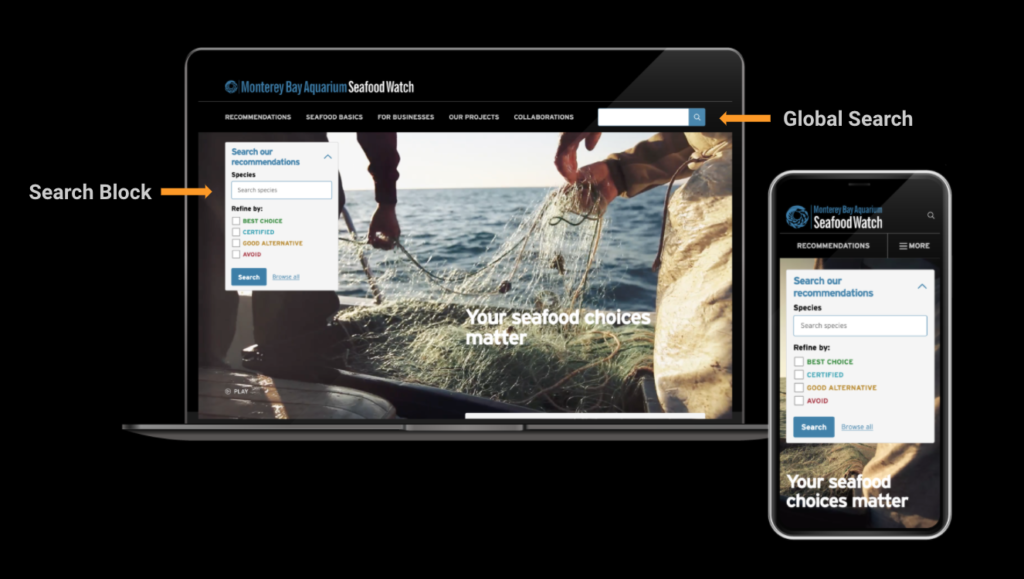
The Seafood Watch website home page has a search tool where visitors can look up recommendations for specific seafood species. In this report, we refer to that as a Search Block in order to distinguish it from the Global Search bar.
11.4% of website visits contain Site Search usage. Although this may seem small, we got a better idea of the volume when we found that over the month of April (2021) there were 14,218 unique searches.
SEARCH LOCATION
- Most users search using the Global Search bar.
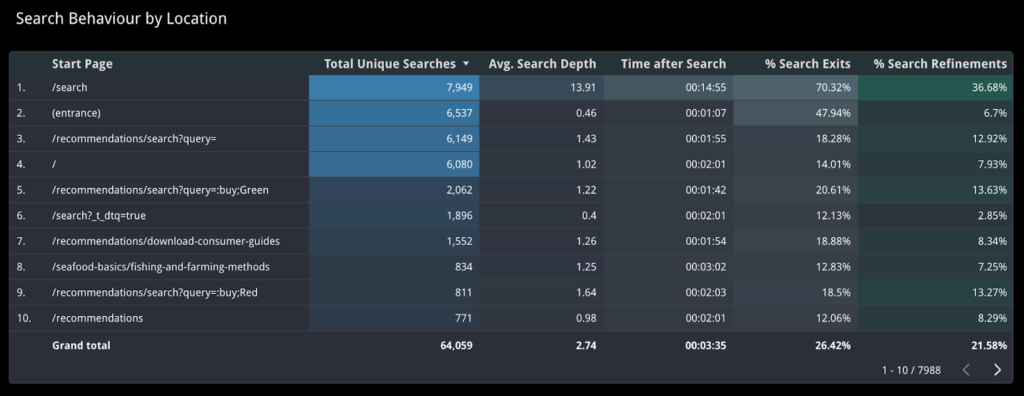
- As shown in Figure 1, the Global Search has a much higher percentage of Search Exits (70.32%) compared to the Recommendations page search (18.28%) even though the first only has about 22% more total unique searches than the latter. We thought this could be good or bad, initially making it a limitation of this analysis. It could indicate that users find what they are looking for immediately and exit without exploring further (good). However, the Average Search Depth (average number of pages a user is clicking into after conducting a search) is high as well as the Time after Search and % Search Refinements. This could indicate that users are having to refine their search multiple times and click into different pages to find what they are looking for, in which case the Global Search is less convenient for them (bad). After our final presentation and discussion with the client we confirmed it is the latter as our client has been receiving customer complaints about the Global Search.
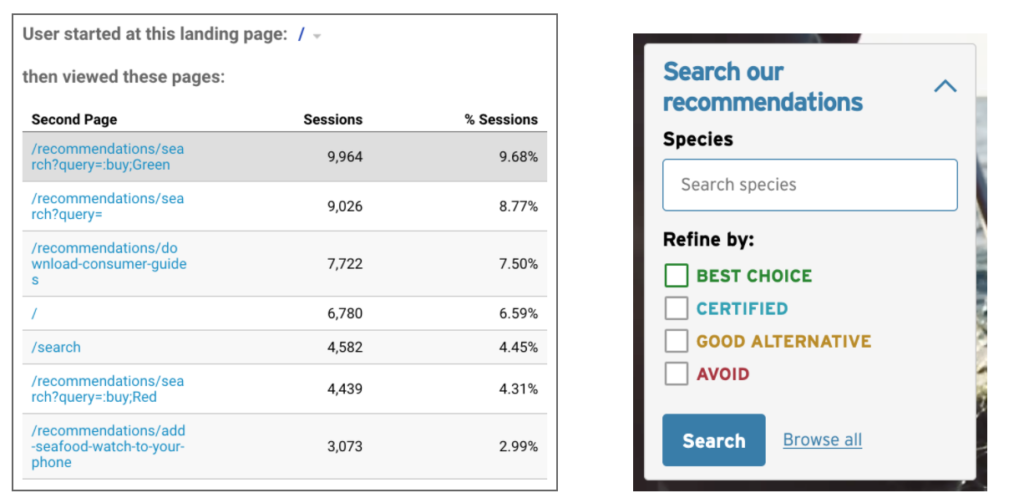
- As we can see in Figure 2, most users starting on the Home Page get to the recommendations by using the Search Block and selecting “Best Choice” (9.68%) or navigating to the Recommendations Search Page (8.77%). They are least likely to use Global Search (4.45%) from the Home Page. However, as the previous findings state, most users use Global Search, meaning they must be relying on it when they are on other pages.
SEARCH TERMS
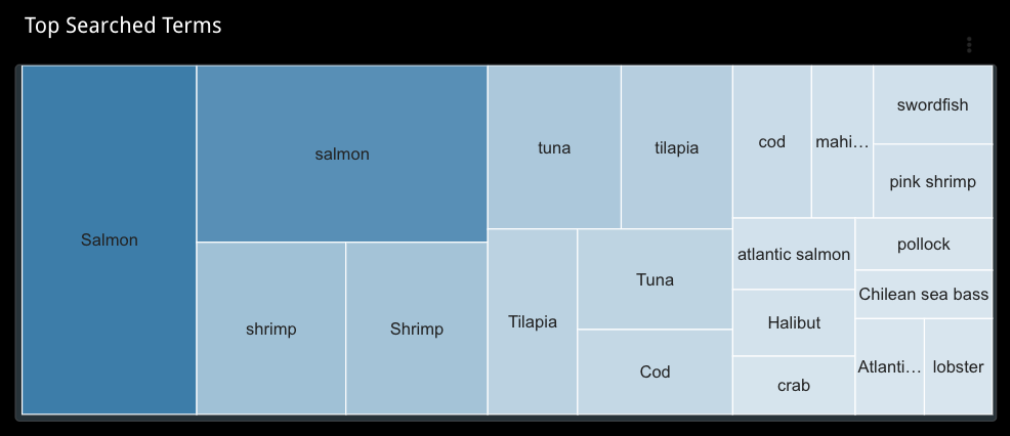
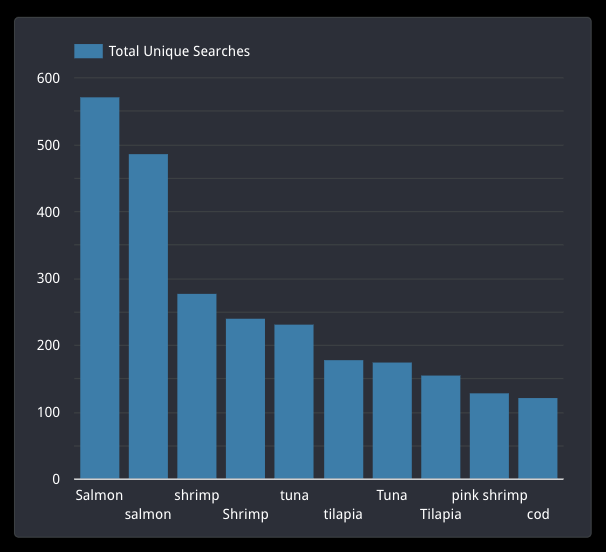
The treemap in Figure 4 shows that most users search for specific fish species. Figure 5 shows “salmon” is the most searched term by a large amount, followed by shrimp. However, the Google Analytics account currently separates search terms by case, making it difficult to accurately visualize the distribution of the terms.
RECOMMENDATIONS
MAKE RECOMMENDATIONS SEARCH EASILY VISIBLE
As we know from the Search Location Findings most users search using the Global Search, and most users who land on the Home Page do not use the Global Search. This would mean that users are relying more on the Global Search from the other pages of the website, and the Recommendations Page could be one example.
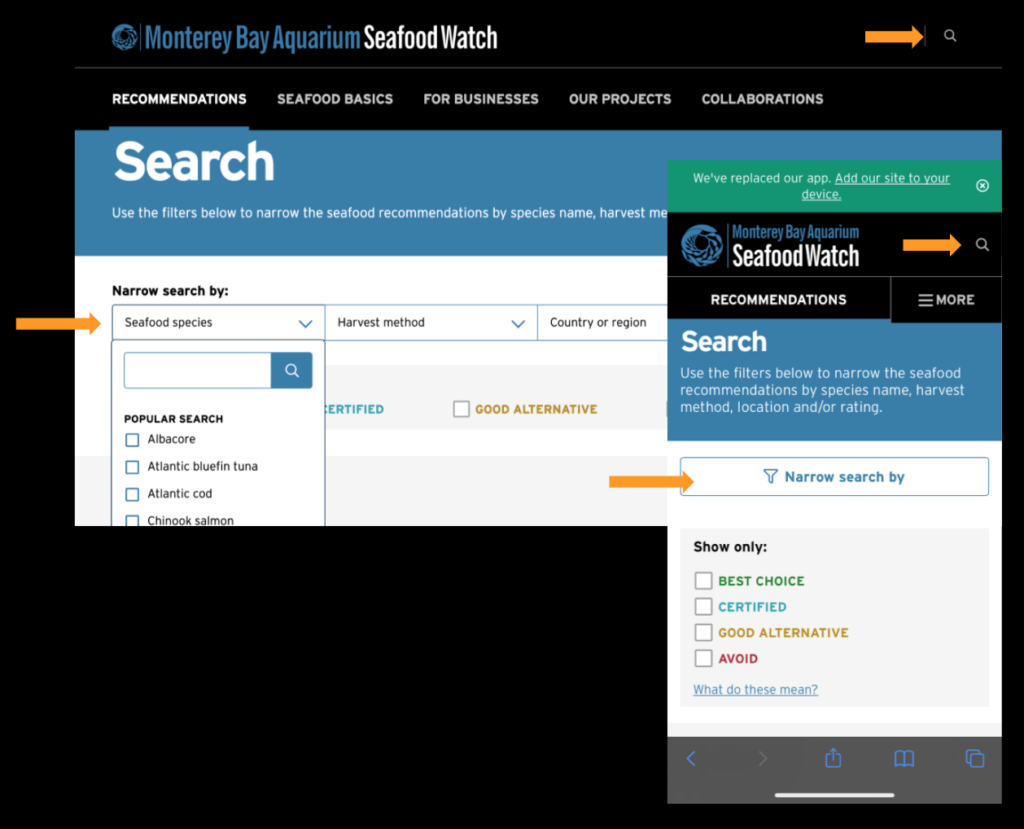
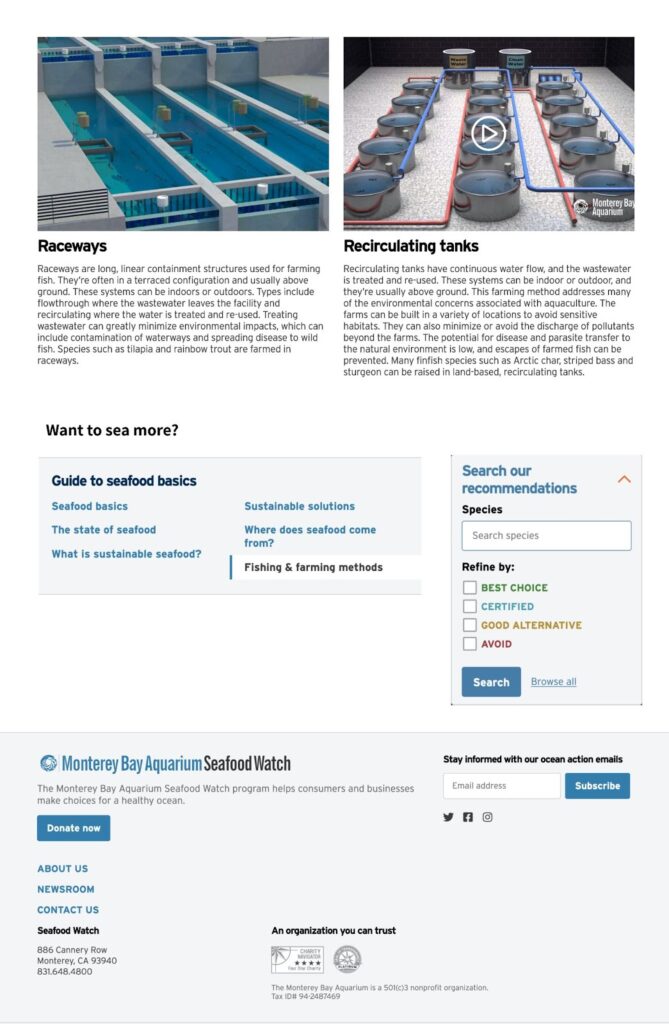
There is no search bar immediately discoverable upon entering the Recommendations page, as shown in Figure 6. On mobile, it even requires an extra step. The low visibility of the Recommendations Search bar compared to the Global Search bar could be the reason most users type into the latter on a page like this. As most users are searching for species and almost half are searching on mobile devices, we thought it would help to make the Recommendations Search bar visible upon entering the page.
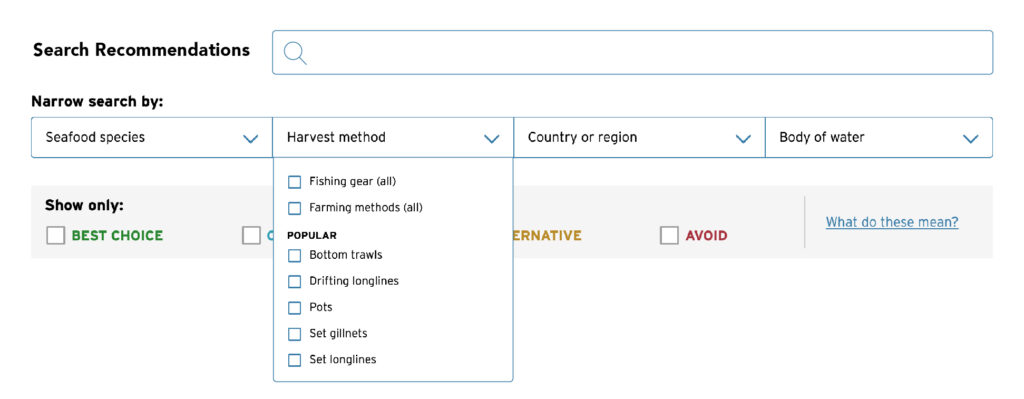
Instead of each “narrow by” filter having their own search bar, there could be one visible search bar and the filters could be drop-downs with either all or most popular options shown inside them. Mockup 1, designed by me, shows one way of doing this.
GUIDE USES WITH PREDICTIVE SEARCH OR A POPULAR PAGES LIST
One possible reason users may be selecting “Best Choice” on the Search Block more often when they are on the Home Page instead of entering specific searches could be that they are not sure what to search for. Removing the word “species” may make this search bar seem less specific. Adding predictive search will also help by guiding users with ideas. Alternatively, a section could be added on the homepage listing the most popular Recommendation pages to help users get started.
REMOVE CASE-SENSITIVITY FOR SEARCH TERMS ON GOOGLE ANALYTICS
Remove case-sensitivity for search terms on Google Analytics to visualize search term related results more accurately. With the help of our professor, we found that a filter can be added to the Google Analytics account to do so. The following link shows how it can be done: https://www.lovesdata.com/blog/google-analytics-filters#analytics-filter-5=
USER JOURNEY FINDINGS
LANDING PAGES
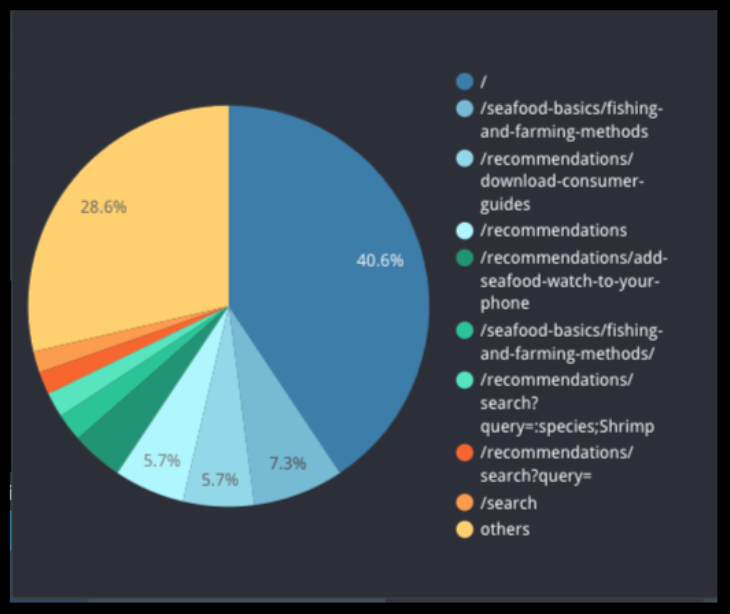
- As seen in Figure 7, majority of users (40.6%) start their website journey on the Home Page.
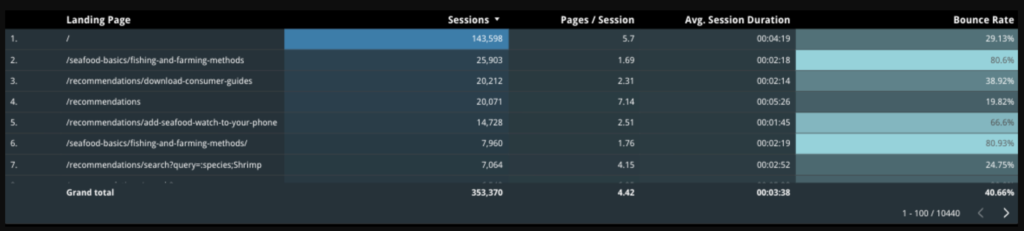
- Users who start on the Home Page spend on average 4:19minutes and view 5.7 pages per session. Those who start on the Recommendations section spend on average 5:26minutes and view 7.12 pages per session (Figure 8). These numbers indicate users are engaged and curious to explore more content when accessing from the above landing pages, as they spend 1-2 minutes longer and view 2-3 pages more compared to other sections of the website.
POPULAR SECTIONS AND PAGES
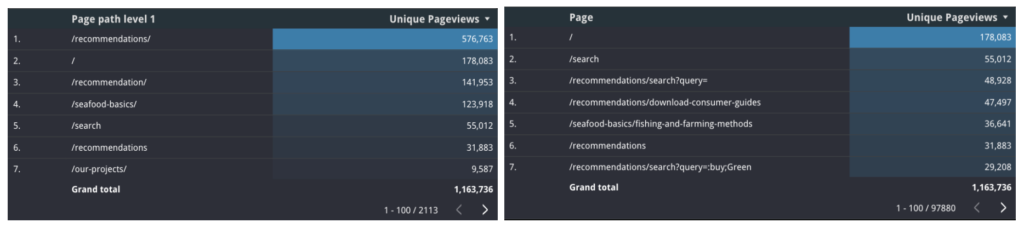
- The top section of the website is the Recommendations Section (576,663 unique pageviews), followed by Species Recommendation Pages (141,953 unique pageviews) (Figure 9, Left). This is in line with Seafood Watch’s goal as users are spending the most time accessing the seafood recommendation database.
- If we look at the individual pages, we can see the most popular page is the Home Page (178,083 unique pageviews), followed by the Global Search Page (55,012 unique pageviews), and Recommendations Search Page (48,928 unique pageviews) (Figure 9, Right). Even though users are searching on the website, however, they tend to use the global search page over the recommendations search page.
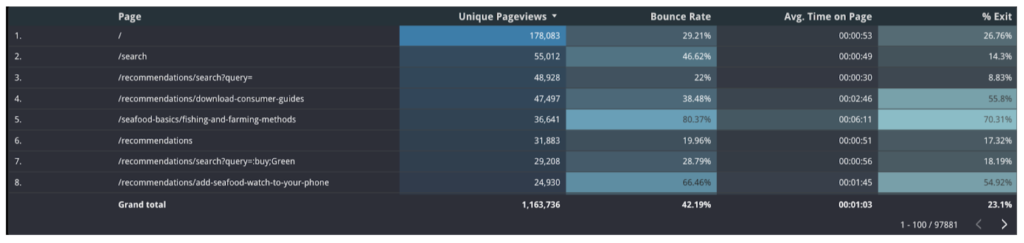
EXIT PAGES
- The top exit pages include the Fishing and Farming Methods Page (70.31% % Exit) with a bounce rate of 70.31%, and the Download Consumer Guides Page (55.8% %Exit) with a bounce rate of 38.48% (Figure 10).
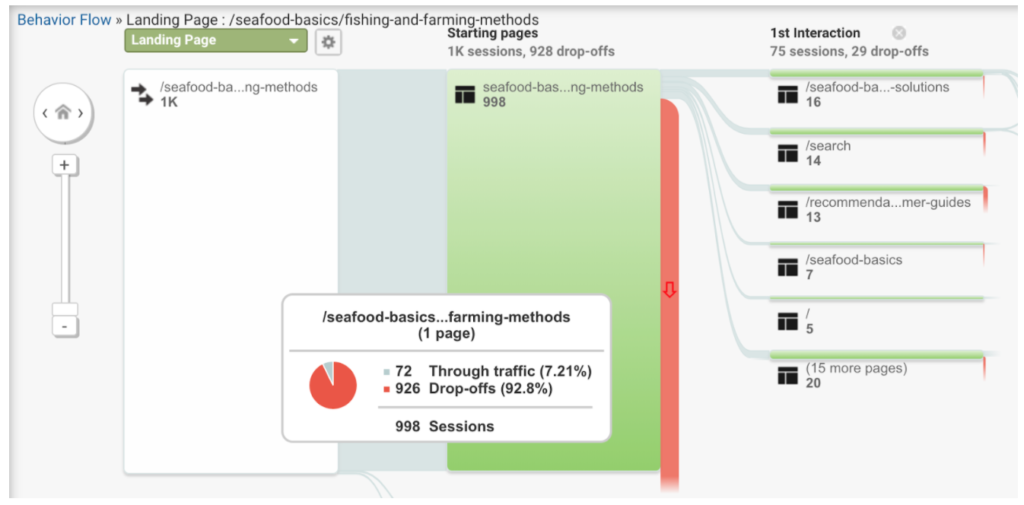
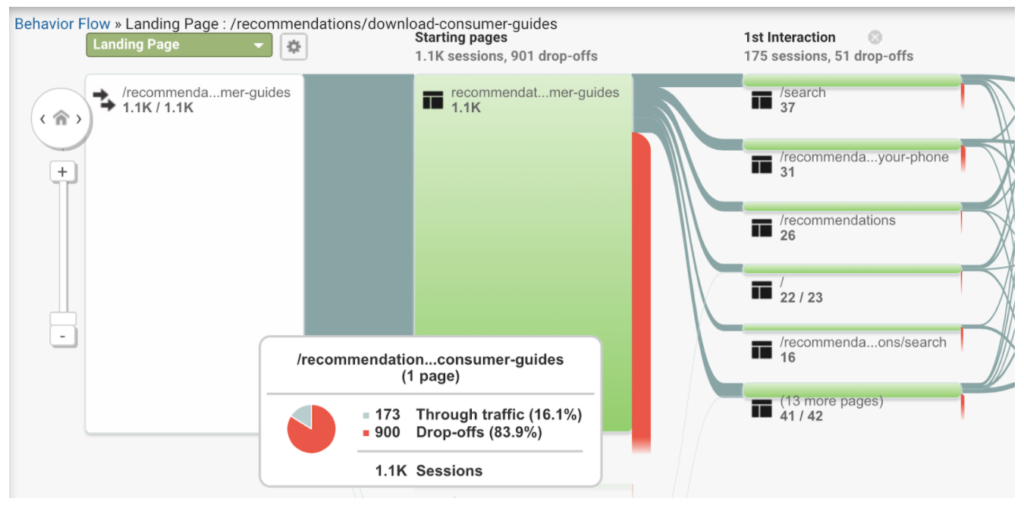
Figure 12 (right) Download Consumer Guides Behavior Flow from Google Analytics
BEHAVIOR FLOW
- If we look at the user flow for two popular pages, we can see in over 1k sessions, 92.8% of users starting on the Fishing and Farming Methods Page and 83.9% of users starting on the Download Consumer Guides Page will drop off than continue their website journey (Figure 11 and 12).
- Users are also more likely to visit the Global Search page or other popular pages than navigate to the Recommendations Search Page (Figure 11 and 12).
RECOMMENDATIONS
ADD A RECOMMENDATIONS SEARCH BLOCK ON POPULAR PAGES
Even though Fishing and Farming Methods Page and Download Consumer Guides Page are the top landing and popular pages, they are also the top exit pages with the highest bounce rates. However, the average time users spend on the page is 6:11 minutes and 2:46 minutes, respectively. This shows that users are engaged with the content on these pages before exiting as the average time spent on other pages of the website is 1:03 minutes (Figure 10).
Mockup 3 (right): Mockup with links to the recommendation search page and another popular page added to the end of Download Consumer Guides Page
As shown in mockups 2 and 3 designed by my teammate Janet, a recommendation we have is to consider adding a recommendations search block or links to other popular pages to:
- Lower bounce rate for landing and popular pages
- Increase average pages per session
- Navigate away from global site search to landing on recommendations
- Encourage users to use search recommendations and continue their website/search journey.
TRAFFIC ANALYSIS FINDINGS
OVERVIEW
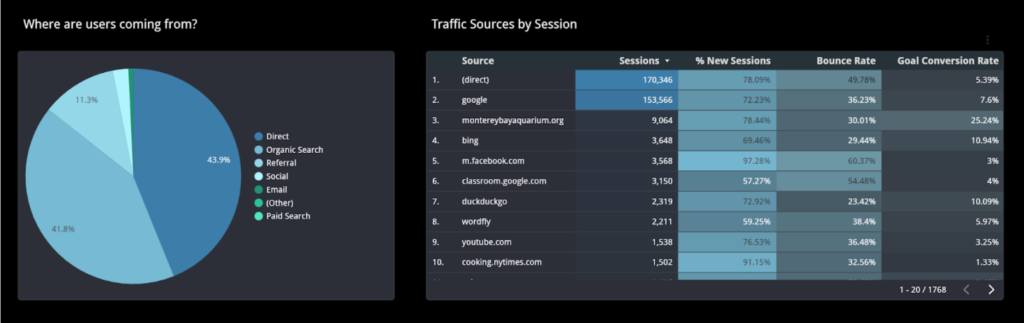
- 43.9% of Seafood watch users access its website directly, 41.8% through organic traffic.
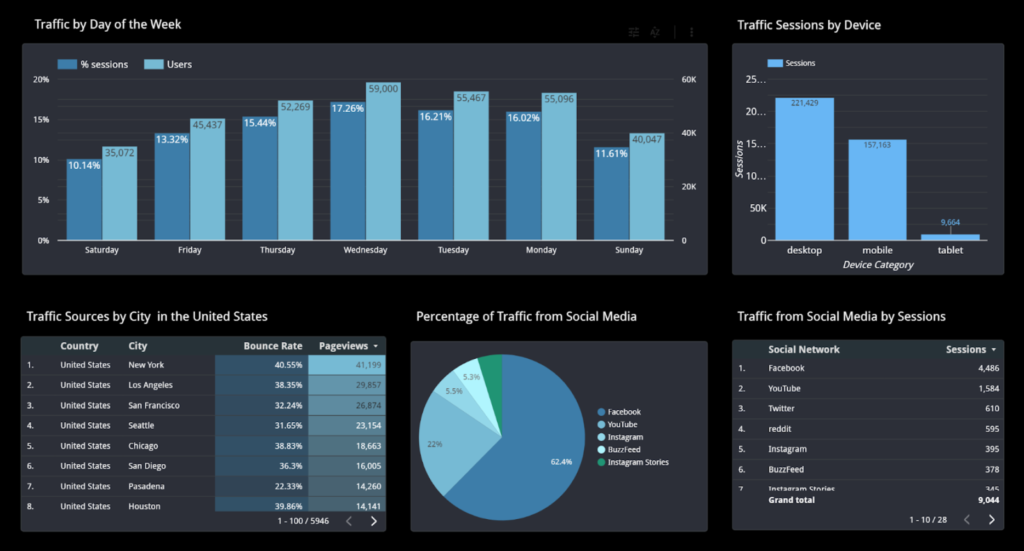
- Most users access the website during the middle of the week.
- From the users arriving at the Seafood Watch website through social media, 62% access the website via Facebook, followed by Youtube at 22%.
YOUTUBE
- Some links that should link back to the website are broken.
- Some video names are not search optimized.
- Some videos do not have tags.
RECOMMENDATIONS
IMPROVE SOCIAL MEDIA RESOURCES TO BRING MORE TRAFFIC
Improve response rates on social media by increasing or improving resources and tools used to do so. Replying to comments promptly and providing links will help with this. Adding recommendations PDF content on the social media platforms, where it can be shared, will improve the website’s visibility, hence promoting the access and usage of the recommendations.
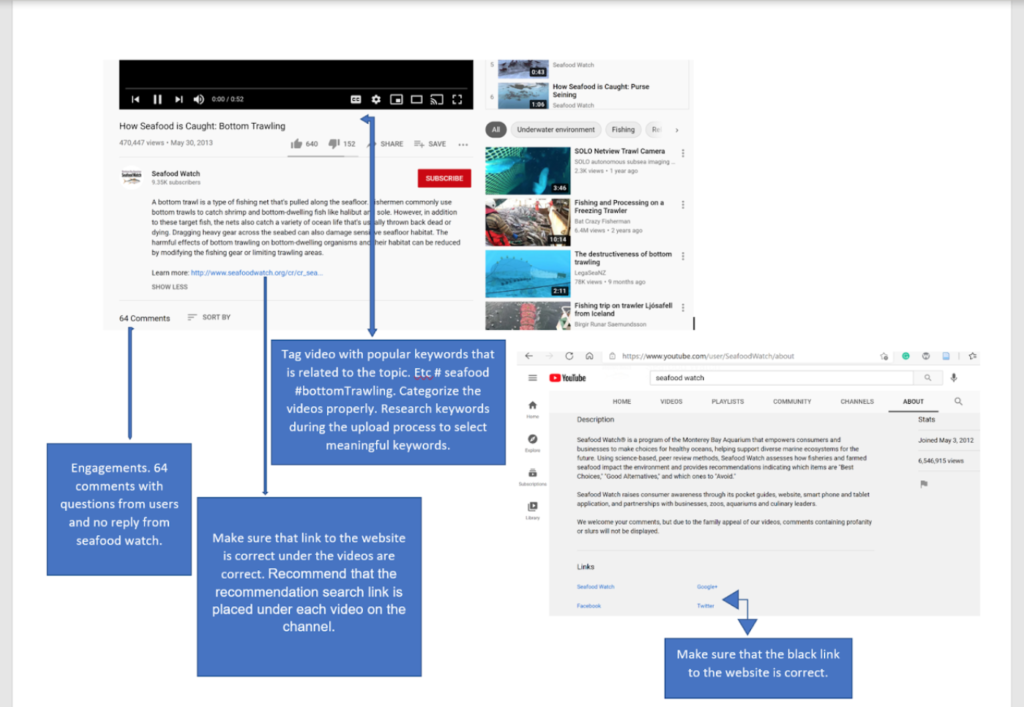
OPTIMIZE YOUTUBE CONTENT
Optimize Youtube video description by adding related links to the official website. Make sure all links to the website are working properly (Not broken). Tag video with popular keywords that are related to the topic and will link to the website. Optimize video titles; for example, “How to ….” is usually a great way to start the name of a title. We also recommend that the recommendation search link is placed under each video on the channel. Figure 14, annotated by my teammate Lemark, shows how these can be done.
PDF DOWNLOAD FINDINGS
Only 6.92% of visitors are downloading PDFs from the Seafood Watch website. During our project scope, 27, 344 users downloaded 34,438 PDFs. Currently, Seafood Watch does not utilize Google Analytics to distinguish between PDF Consumer Guide downloads and other types of PDF downloads.
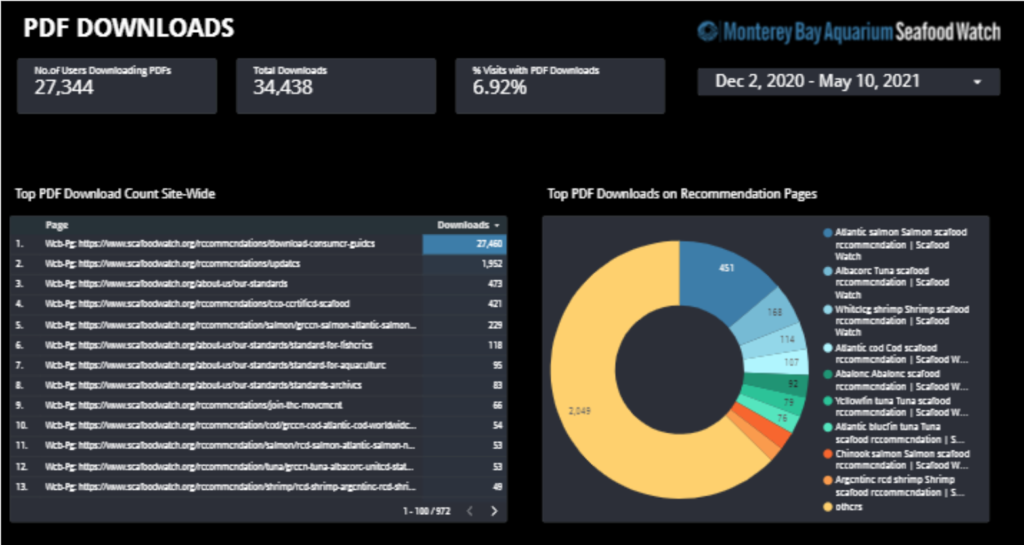
PDF DOWNLOAD LOCATIONS
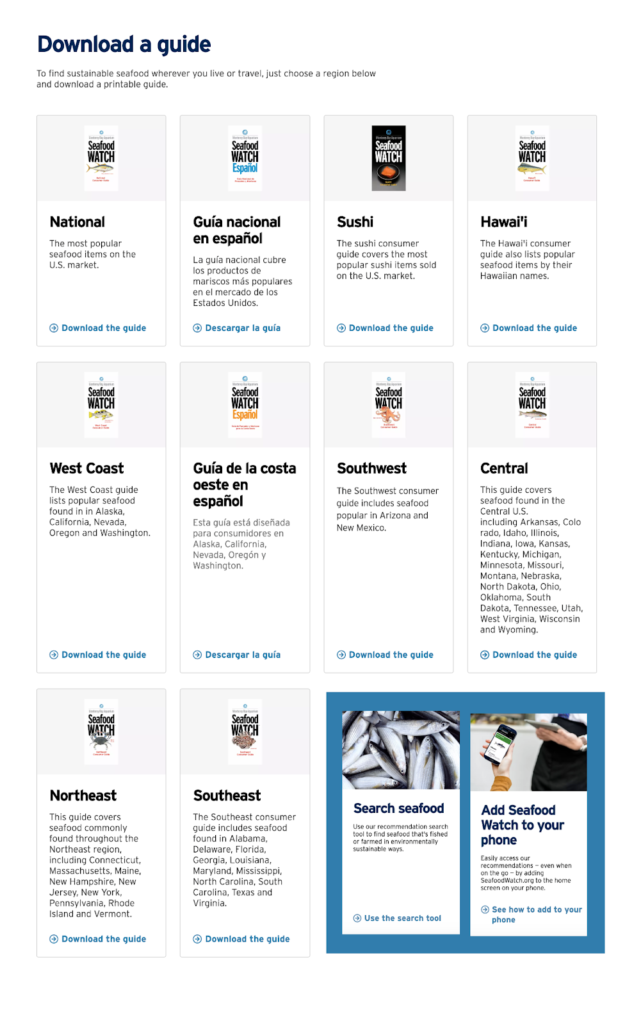
- The majority of PDF downloads occur on the Consumer Guide page. Seafood Watch has 10 Consumer Guides available for PDF download on their website.
- Other PDF downloads occur on a variety of different content pages; they include expanded reports on specific seafood, latest updates to recommendations, reports in progress and best standards.
RECOMMENDATIONS
IMPROVE METRICS TO TRACK PDF DOWNLOADS
Downloading PDFs is a measurable performance indicator of how users are engaging with Seafood Watch content past the immediate website and if they are satisfied with the found results. Distinguishing PDF documents on Google Analytics would help find out which exact documents are being downloaded the most.
INCREASE VISIBILITY OF PDF DOWNLOAD OPTIONS
The visibility of consumer guides and other downloads could be much more prominent across the website. Currently, PDF downloads are visually similar to all other hyperlinks and often hidden at the bottom reports behind several click-throughs. Most users may not be aware of these resources. Visibility and conversion to download could be increased by employing action buttons on relevant pages, using a unique color or symbol, or changing the download’s location on the web page.
CONCLUSION
The findings and recommendations were presented to our client over a Zoom call, by screen-sharing our presentation slides. Even though we were mainly communication with one Seafood Watch representative throughout the process, we presented to 5 representatives who all work in the web design, analytics and user experience departments. I demonstrated our dashboard functionalities to them and our team answered some questions they had. The presentation went successfully as our client team gave us positive feedback and found our findings and recommendations extremely helpful.
REFLECTION
Throughout the duration of this project, the following were some key takeaways for me:
- Edit down content – Since our team had 4 members and we were all gathering data relating to different things, we ended up gathering too much data at one point. It was a challenge to downsize what we had, but made sense considering the main project goals.
- Teams members may need to be assigned positions – I noticed it was difficult to maintain consistency of language, layout and format throughout the documents we produced as we were each tackling a large amount of content. In the end I took the responsibility of going through the body of work to edit and create consistency, which took longer than I had expected. I think it would have been helpful to assign Designer, Copy Editor and Project Manager positions in the beginning.