
The Problem
Background
The Digital Preservation Outreach & Education Network (DPOE-N) is a non-profit organization run by the Pratt School of Information and New York University’s Moving Image Archiving and Preservation program. DPOE-N provides financial and material support to professionals and institution in the cultural heritage preservation and museum fields to facilitate digital preservation and conservation. DPOE-N provides these services through workshops, training, hardware support, and direct funding and aid.
The problem that DPOE-N is trying to solve is sub-optimal application rates as a result of low awareness among professionals of DPOE-N and its services. DPOE-N seeks to rectify this problem by identifying areas of improvement in its online and social media presence and implementing a cohesive strategy to better reach those professionals and organizations it wishes to serve.
Our goals were to analyze the DPOE-N’s website and social media profiles, identify strengths and weaknesses of the DPOE-N’s current approach, and create strategies to utilize the various platforms’ strengths and primary audiences to the best effect for the DPOE-N.
- The Team
Jessica Davis — Co-Team Lead, Website Analysis & Strategy, Note Taking, Data Support
Olivia Turpin — Co-Team Lead, Twitter Analysis & Strategy, Data Visualization Standardization, Data Support
Prachi Chhajed — LinkedIn Analysis, Visual Design, Typesetting, Formatting, Report Design
Cameron Dudzisz — Facebook & Instagram Analysis, Social Media Strategist, Design Support
Our Process
- Timeline
In our client meeting, Jessica took detailed notes to ensure we hit on all of the pain points described to us by Anthony and Erin and that we would be able to design a strategy around their strengths and limitations. Due to tight time constraints, we quickly moved to assign roles on first a volunteer and then a needs-to-be-done basis after our client meeting. Frequent working meetings ensured we were coordinated in our individual section reportings, and working in the same document in Google Docs allowed us to share and comment on each other’s work in real time; this seamless communication allowed for rapid analysis and development of strategy.
- Tools
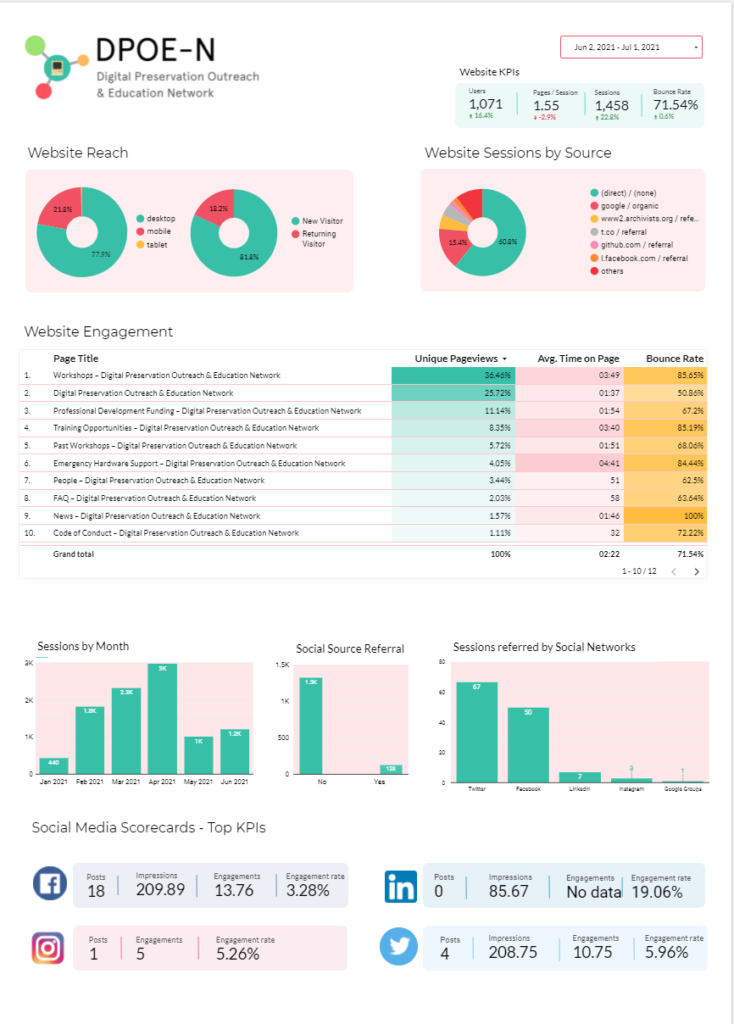
Primary data analysis was done in Google Data Studio with data pulled from Facebook Business Suite, Twitter Analytics, Linkedin Analytics, and internal site data via Google Analytics. Visualizations and dashboards were created in Google Data Studio and Tableau. The report was primarily written in Google Docs.
- Results
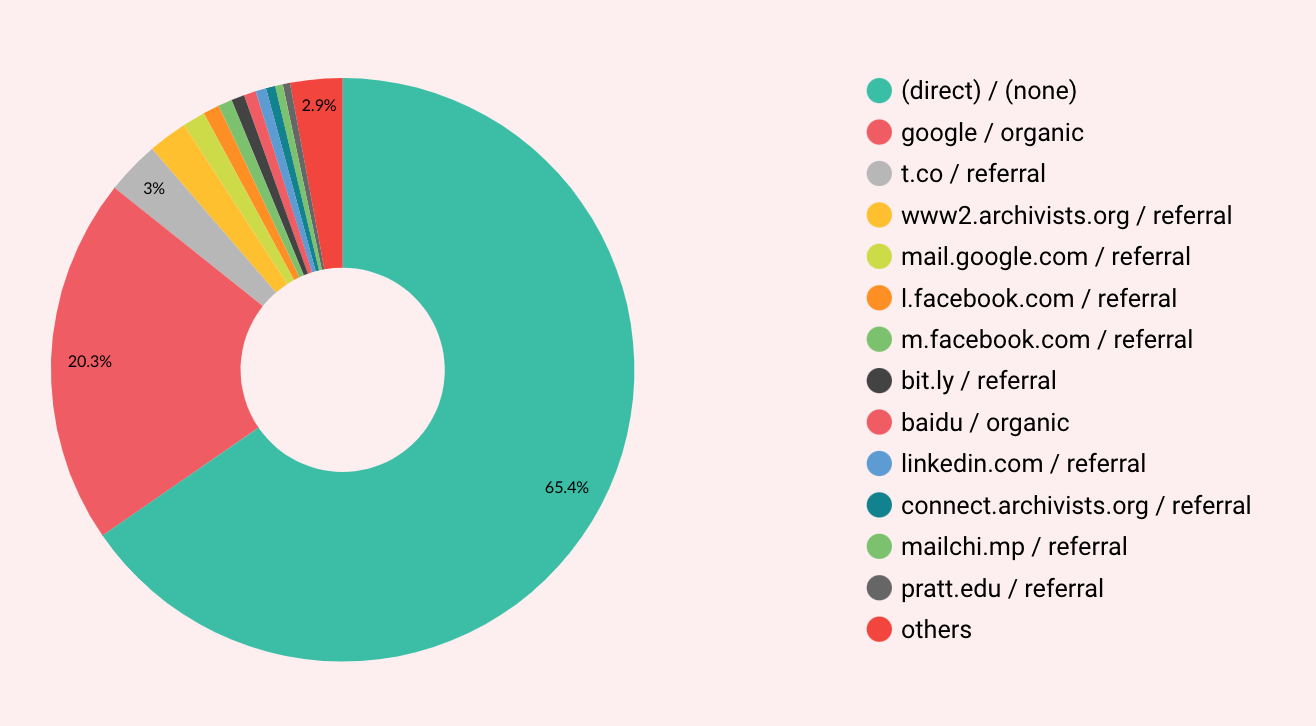
Sources of website traffic
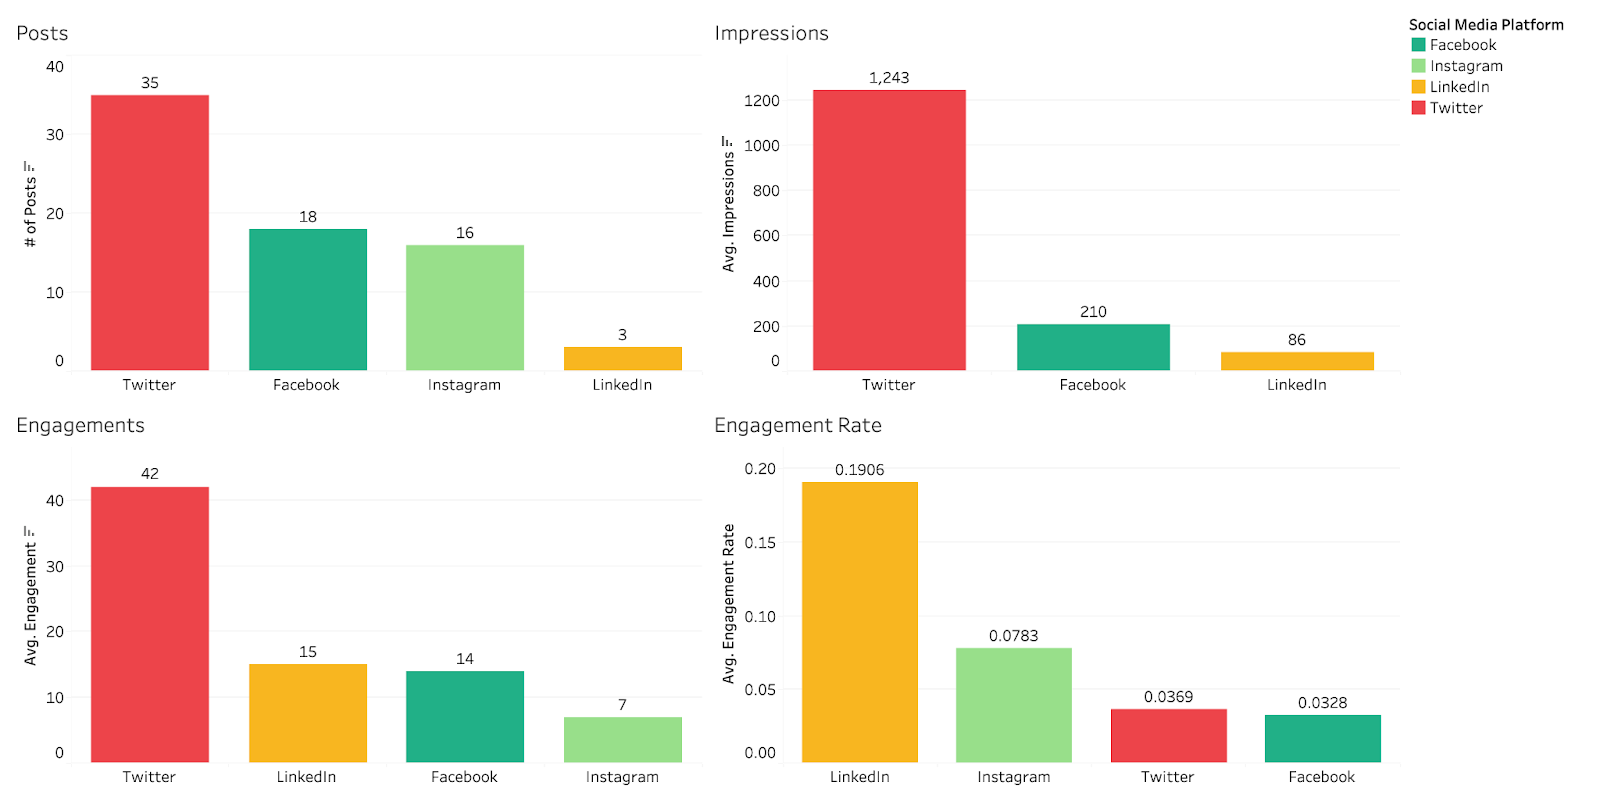
Social media metrics
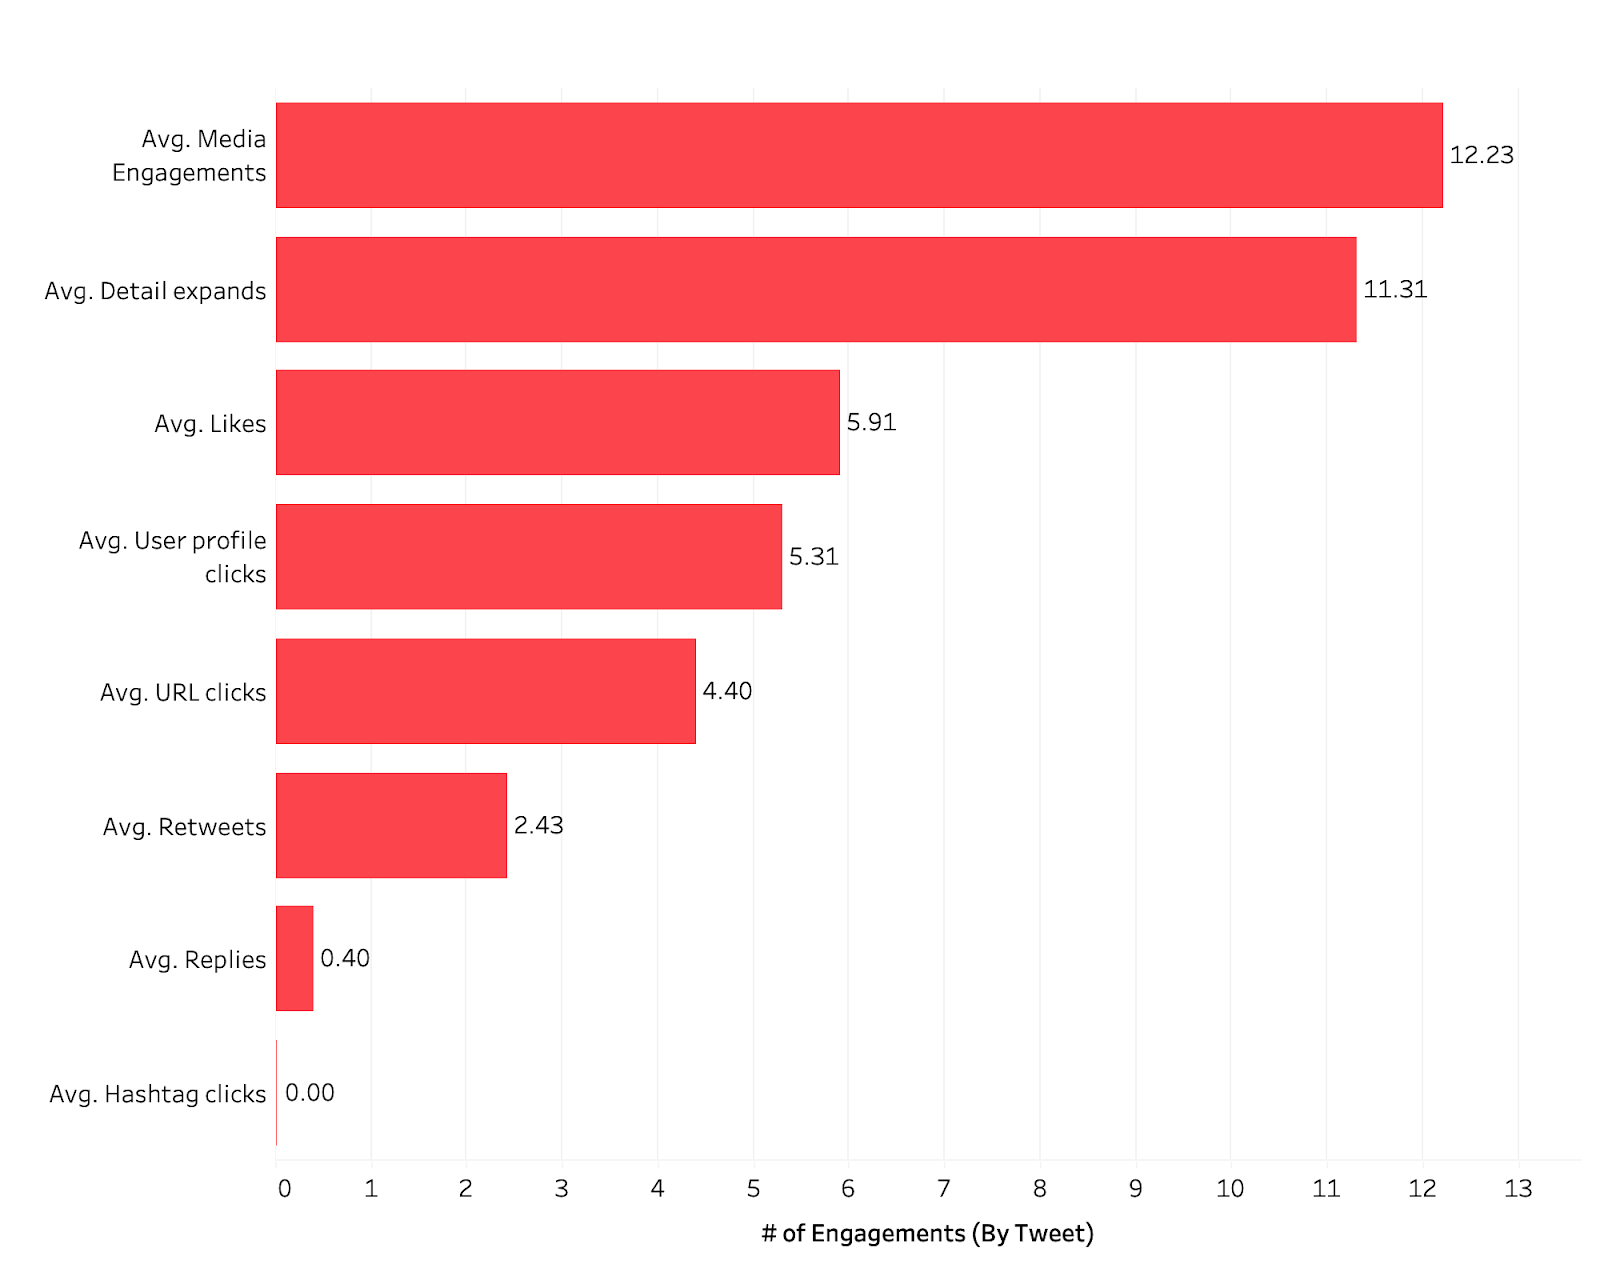
Average Tweet Engagement
- In terms of the website, most web traffic in fact did not come from social media, but rather direct links and Google searches. We suggested improvements to the website for Search Engine Optimization and improving ease of use to lower the high bounce rate, with the most important being improving the visibility and clarity of the education pages, clarifying exactly what DPOE-N can do for organizations and individuals, and clarifying how to apply for funding and aid.
- For social media, we decided that a primary focus on Twitter due to relatively high impressions, the shareability of content, and a preexisting professional network that uses the platform regularly. However, we stressed the importance and strengths of the other platforms. Facebook’s Groups feature is a resource that has been underutilized for semi-private messaging, discussion groups, and advertising. Linkedin, despite its low post counts and overall impressions, has a very good engagement rate due to its highly focused user base and would be an excellent location for job and career improvement opportunity postings. Instagram, as a highly visual medium, can be used to great effect for sharing advertising banners with broad hashtags to make into many feeds.
- Conclusion
Feedback from the client was highly positive. Several elements of our strategy and suggestions, such as improved hashtag use on Instagram and Twitter, are immediately actionable with minimal work or preparation on the client-side. Seeing the usage and traffic data in one easy-to-use dashboard was met with strong approval, as was the approach to social media with a clear list of priorities, but without abandoning any of the platforms.
If we were to improve and continue working on this project, of course, the highest priority would be to continue to follow the website and social media profiles to assess any changes to engagement after our recommendations took place. While we are confident in our findings and recommendations, we would like to be able to quantify those feelings with hard data. Due to time limitations, we were also unable to analyze the engagements and comments on content for tone and interactive effort- for example, to analyze what was simple, low-engagement reactions, questions asked, requests for information, and so on. Qualitative analysis in this area would allow us to identify what viewers of DPOE-N’s content like, dislike, and would like more information on in their own words instead of relying on usage data.
Published by Google Drive–Report Abuse