Introduction
We believe that USA rugby plays a major role in boosting the sports fan community in the United States.
One approach to do this is to add the most skillful rugby athletes to their roster; each one must set an example of a player with sufficient abilities. We employed web analytics techniques in this analysis to learn about fan behavior on the USA Rugby website. To discover what fans want to know about a team or player and how they could go about obtaining that. Studying the activity would allow us to recognize how effective it is for visitors and where we can optimize it. The more experienced rugby players that join the official Eagles team, the more probable it is that people will take notice, become fans, and remain fans.
Goals of the research
The website contains team and player information about the official national rugby team – the Eagles. The website could even work as an initial point for acquiring new fans and keeping existing ones. To do this, USA Rugby should really add essential team and player information to their website and provide visitors with a simple navigation experience to access that content. Identifying these activities supported us to discover a more efficient process for visitors searching for information on the rugby players from each team. We analyzed the online behavior of visitors on pages featuring USA Rugby teams and players. It will be simpler to expand and retain the rugby audience as long as there is a continual way of bringing in the top rugby players.
Understanding Users
Analyzing a fan’s needs – We believe the relationships between those who are or aren’t fans can be displayed on a spectrum – each level might have different needs.
- Hesitant supporters are people who would not seriously consider taking an effort in learning about USA Rugby and are uninformed about the sport in general.
- Casual fans enjoy the sport but have little or no attachment to the national teams.
- Fans who are engaged with the team interact with them on social media and are aware of updates from major media sites and forums.
- Superfans are aware of who the national teams will face next, as well as their history and rosters. They may even be aware of a certain player’s background.
Team, tools, and methods
Our team consists of four user experience professionals, including me, Jamie Chen, Derek Frisicchio, and Wenjing Wu.
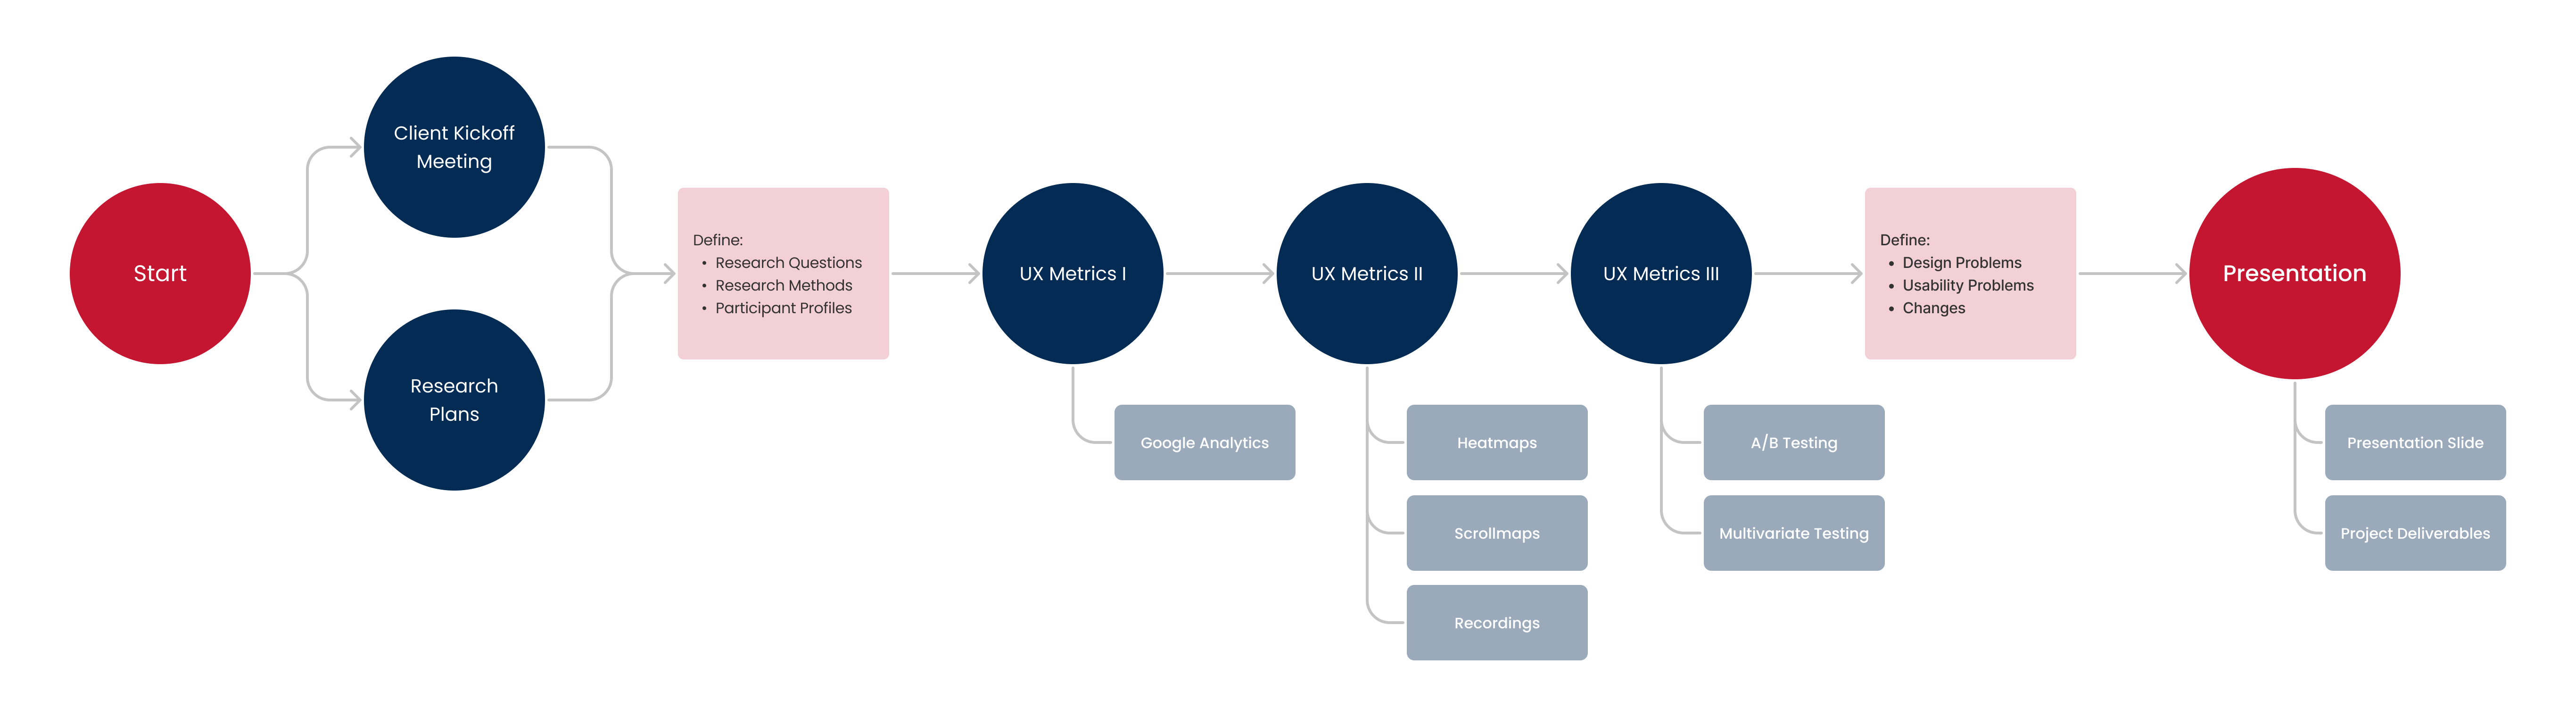
Research Methods
We studied the online behavior of visitors on pages related to the USA Rugby teams and players. Understanding the behavior would help us determine how reliable it is for visitors and opportunities for improvement.
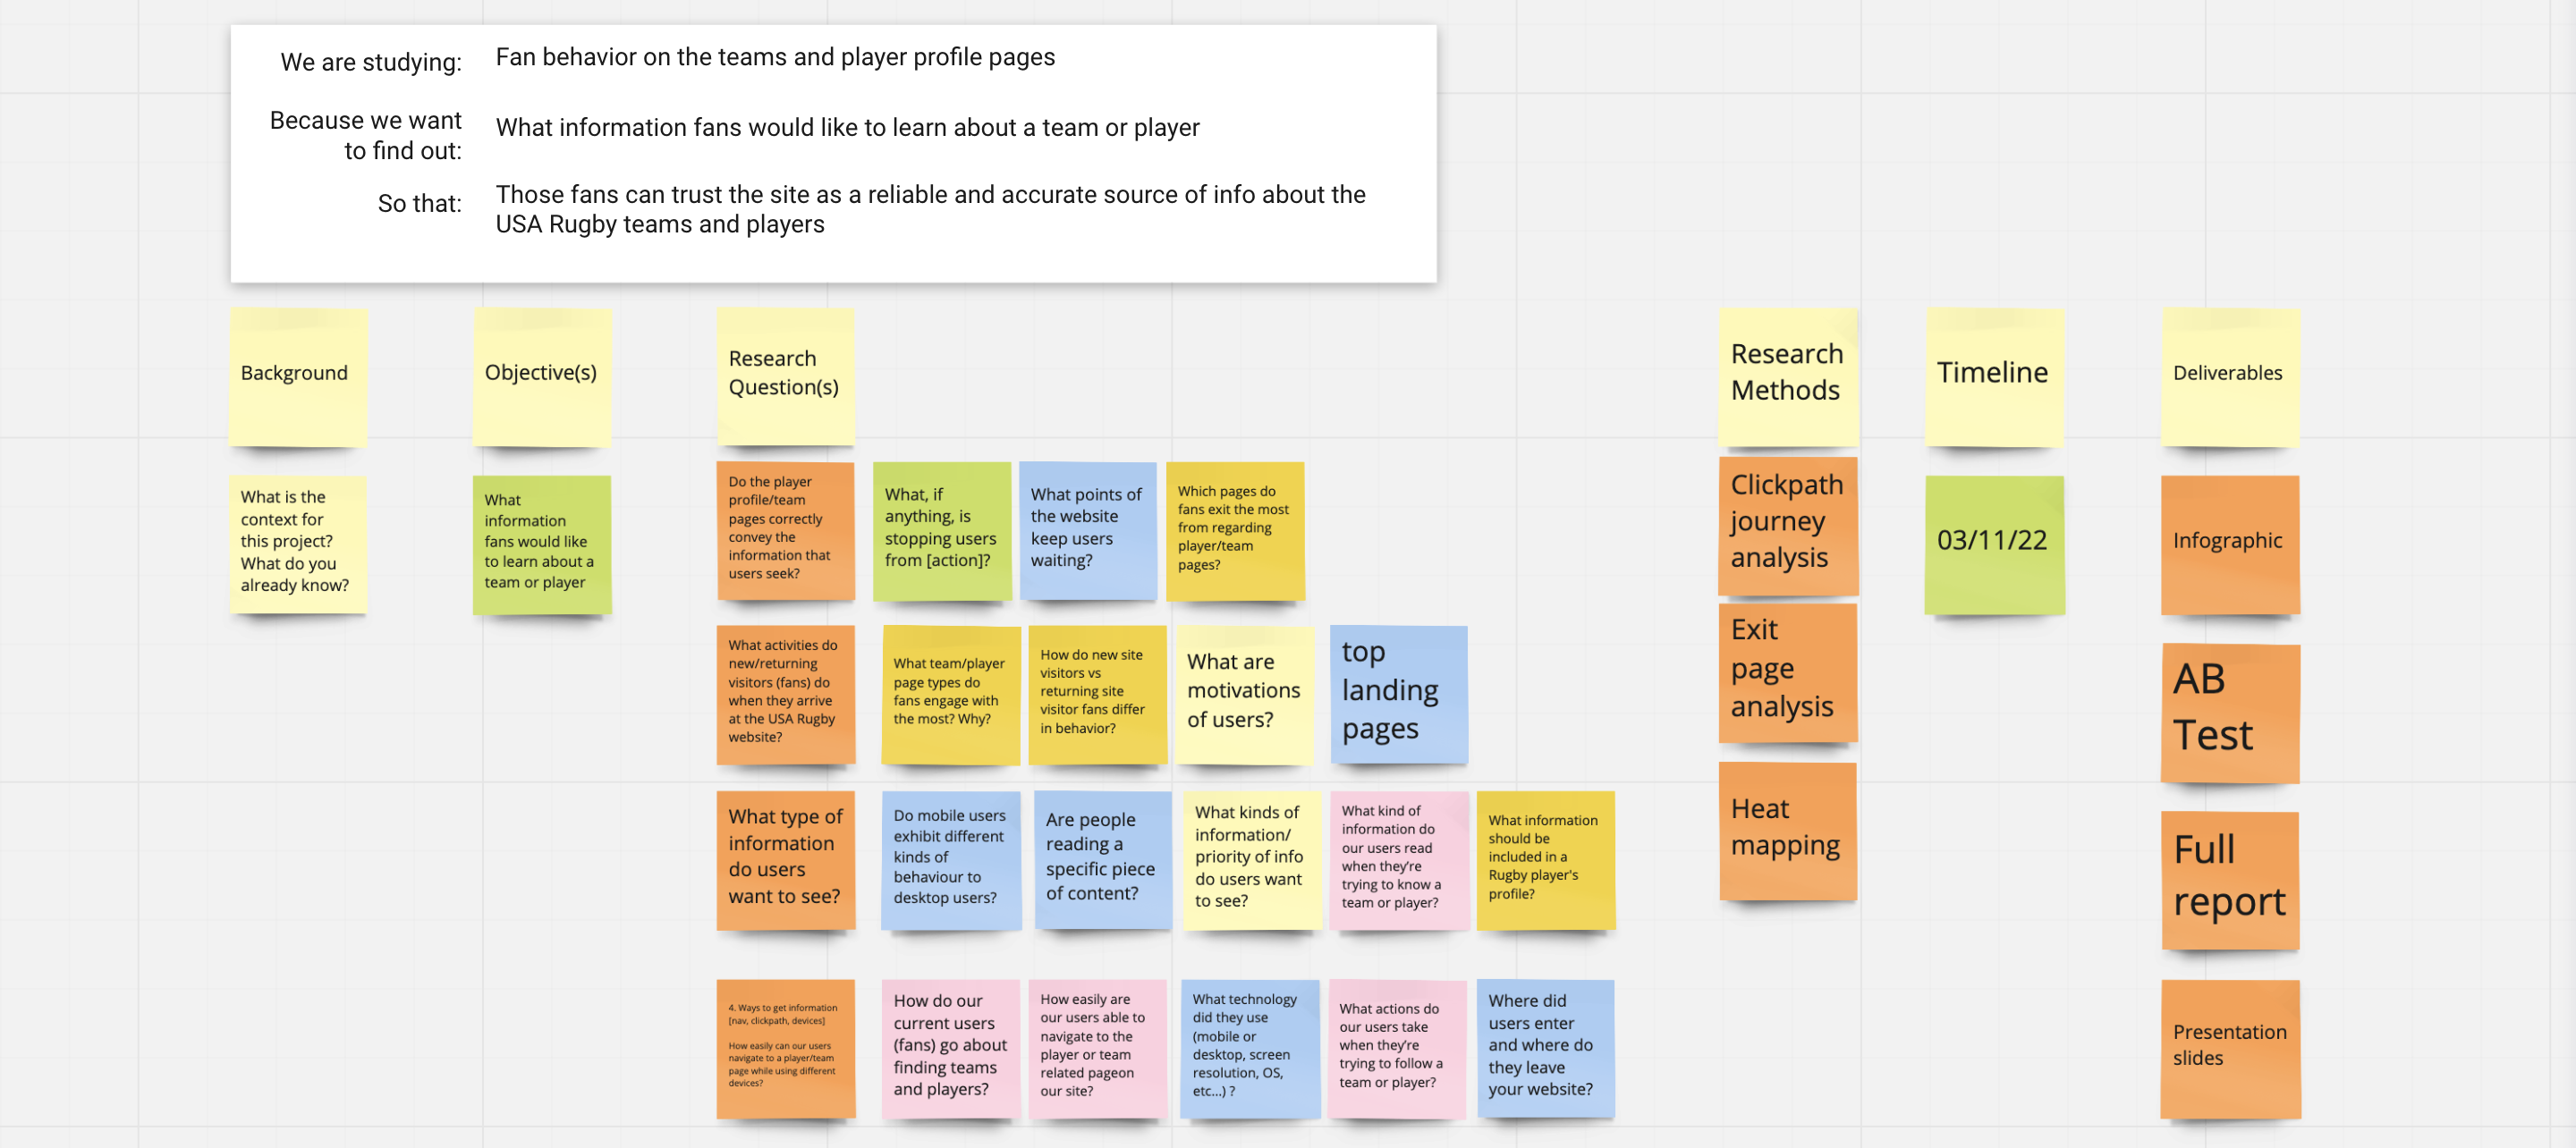
Research Questions
Overall findings
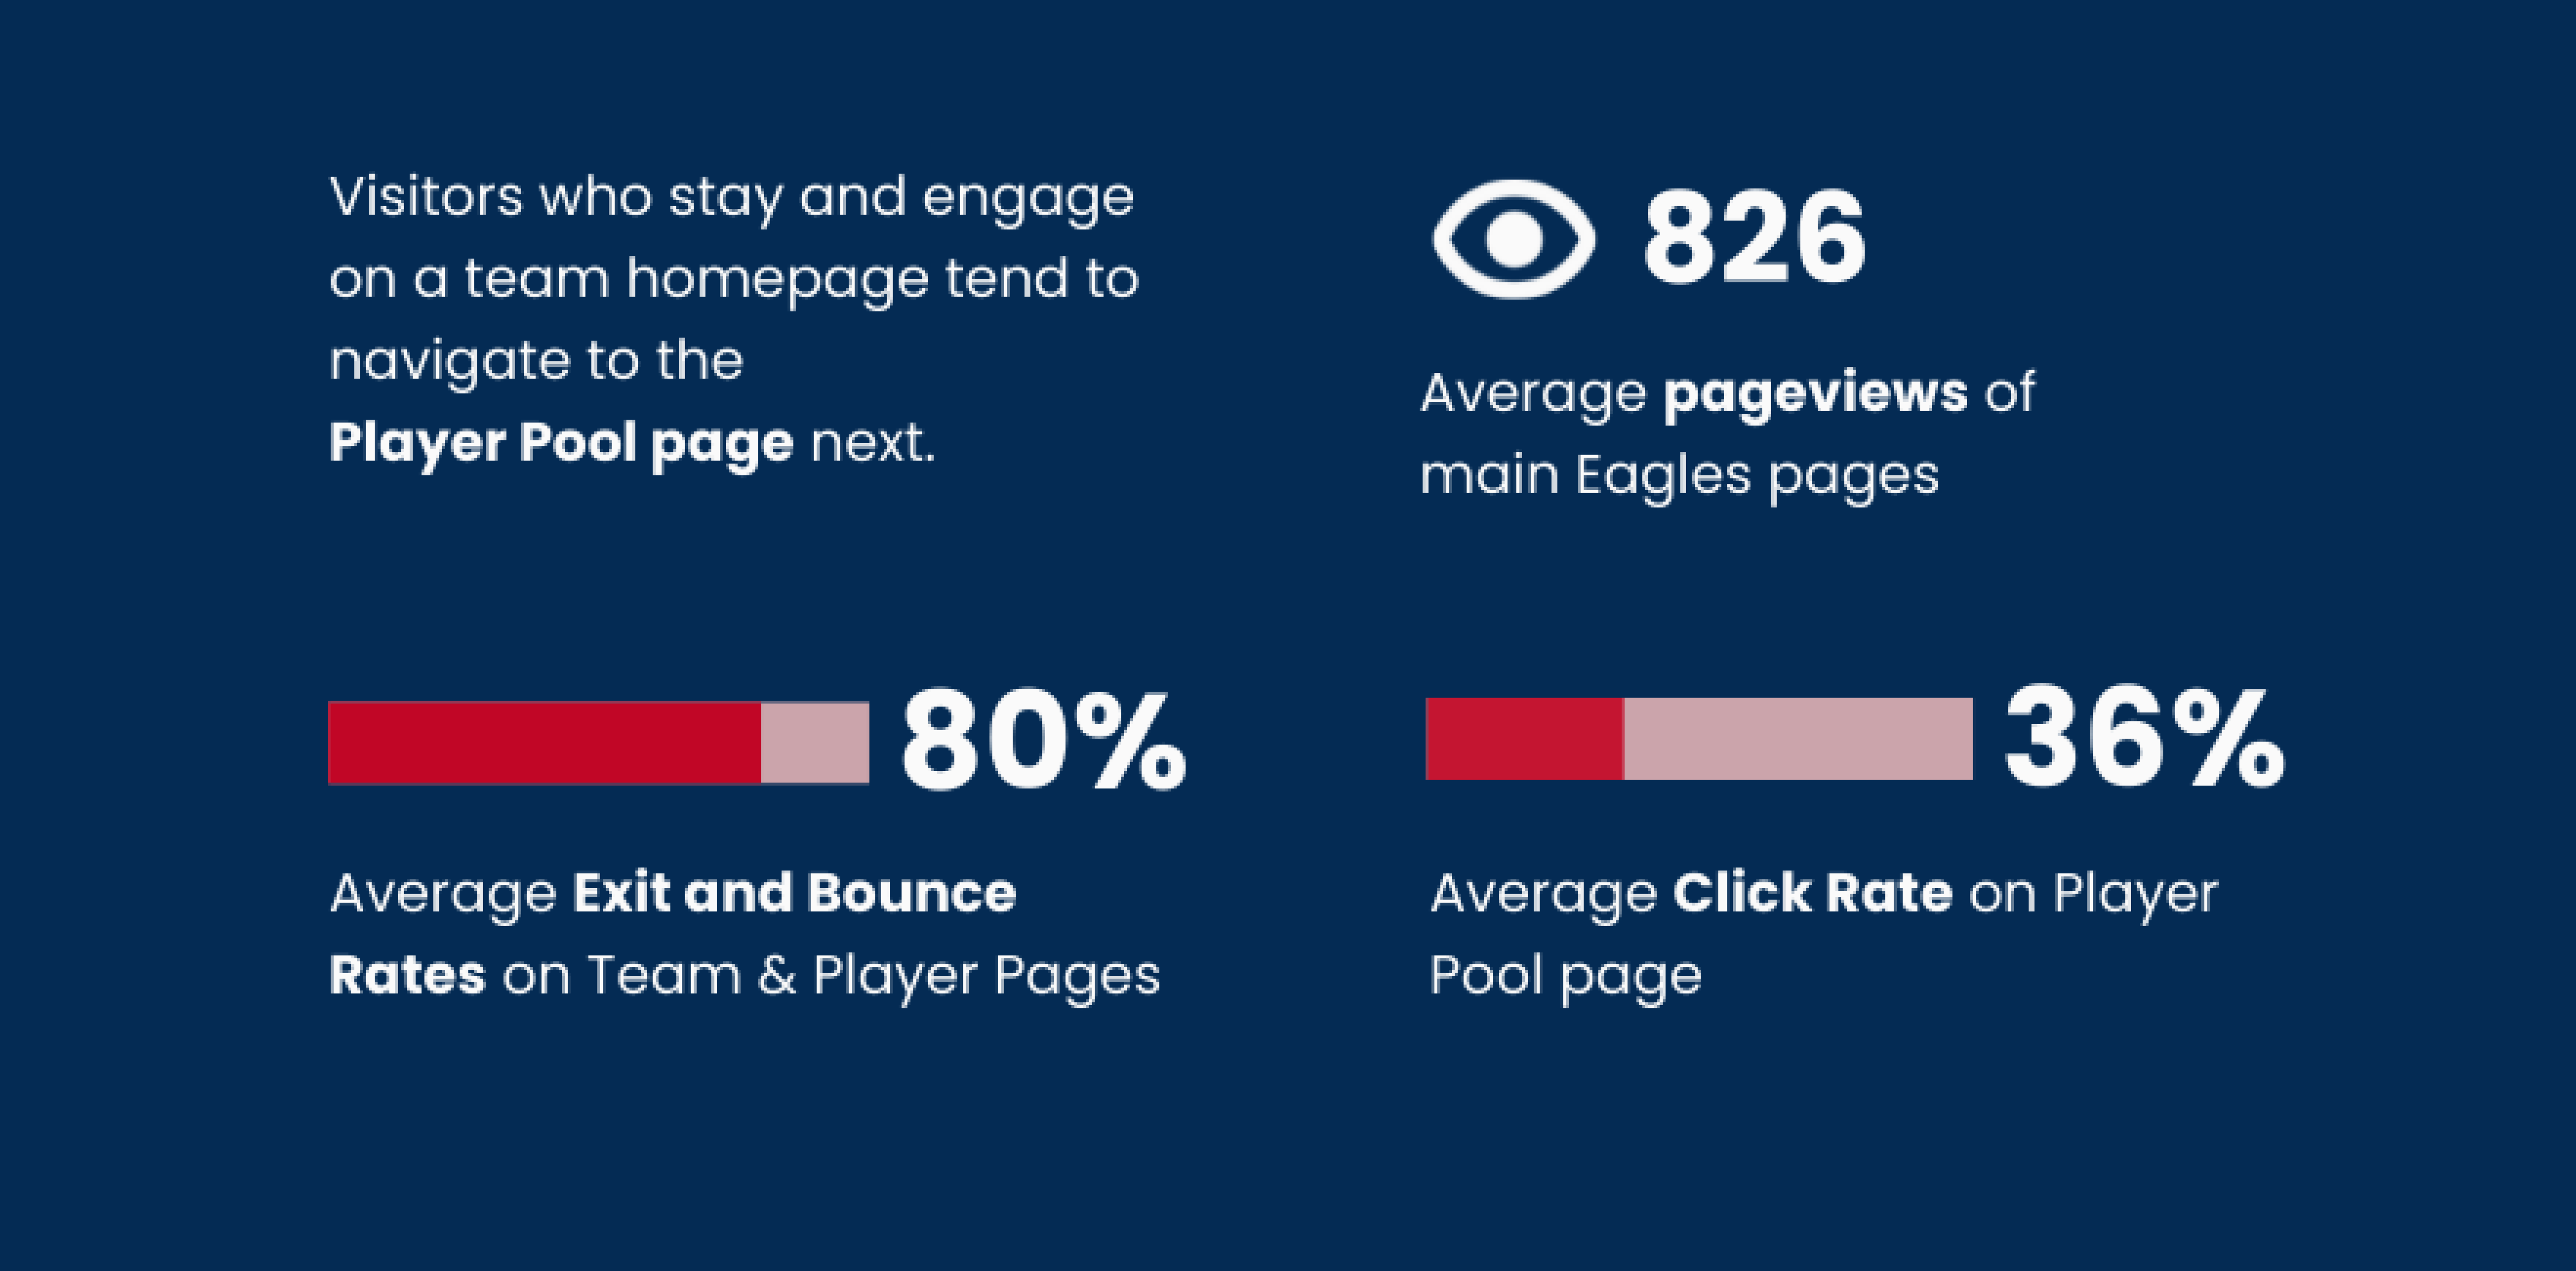
New and returning visitors frequent the team home pages but favor other page categories differently – especially Player Pool pages.
New visitors rarely attempt to discover more about the national teams. If they do, most of their attention is on the team’s roster.
The Team homepages account for the majority of new visitor pageview activity; but, that page may not have enough information to encourage unwilling or casual fans to interact further. Although the Player Pool and Schedule/Results pages account for 25% of new visitor page views, visitors spend more time on them than any other page category. News headlines could be found on both the News and Team Home pages, with categories ranging from score outcomes to community support and lineup changes. This sort of content may be relevant to all types of fans; then again, the News page receives the least visits.
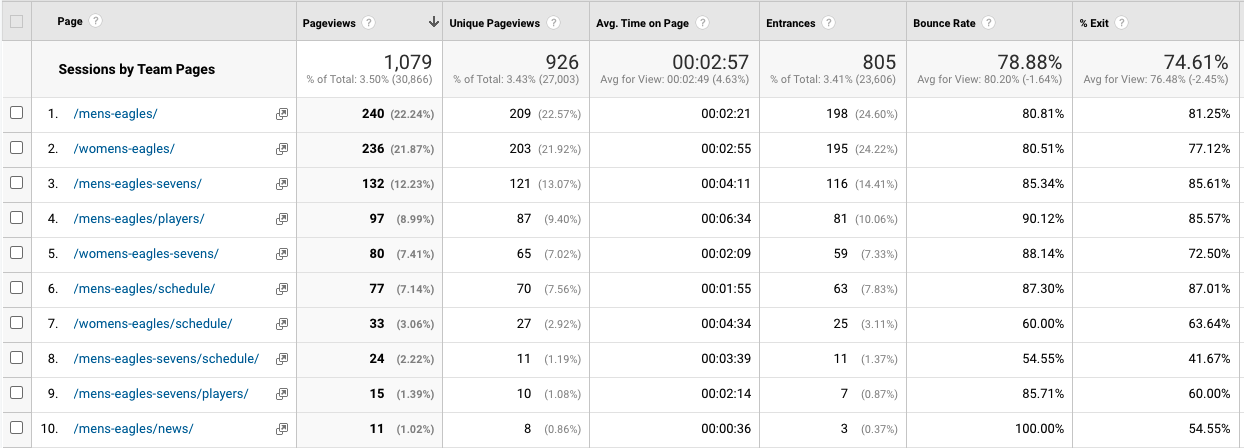
New users commit to seeing all team pages, including the home, news, schedule, and player pool.
Bouncing from certain pages at a rate ranging from 80% to 100%.
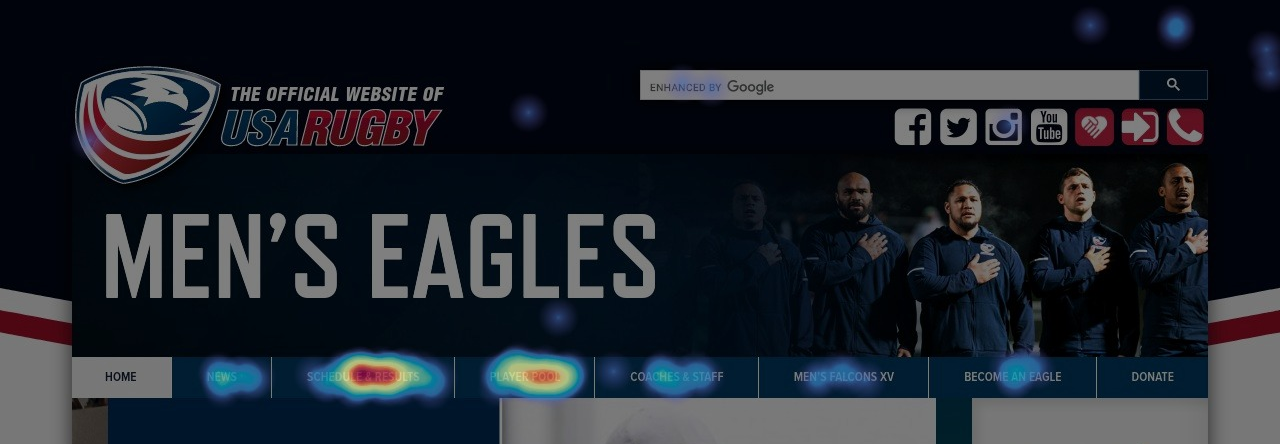
When they come, they almost always land on the homepage. Other page types are viewed by less than 40% of new users.
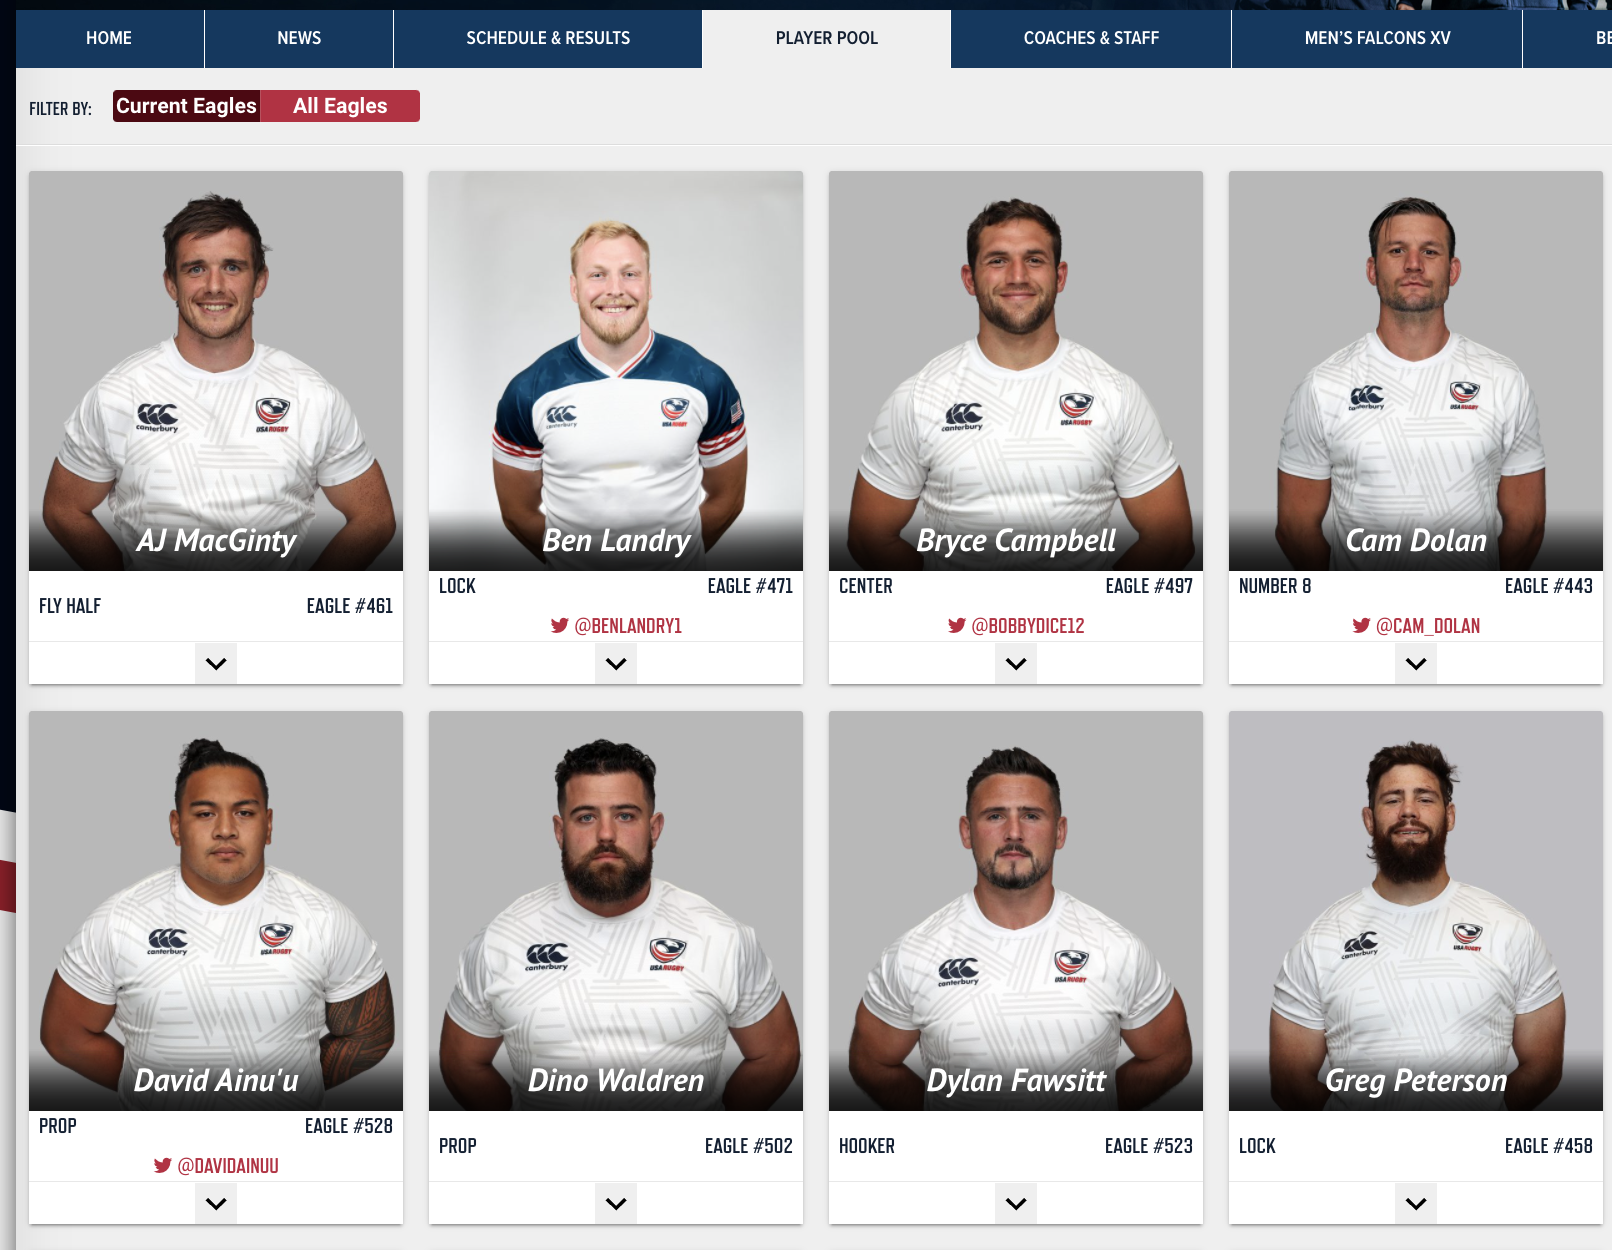
The player profile page receives 1.5% of all traffic. 1.74 % of visitors on the site arrive at a player page initially. 0.51% of visitors on the site land on the schedules page first. People are more interested in the player than in the team. Hotjar demonstrates that the new user often visits the schedule/results and player pool pages.
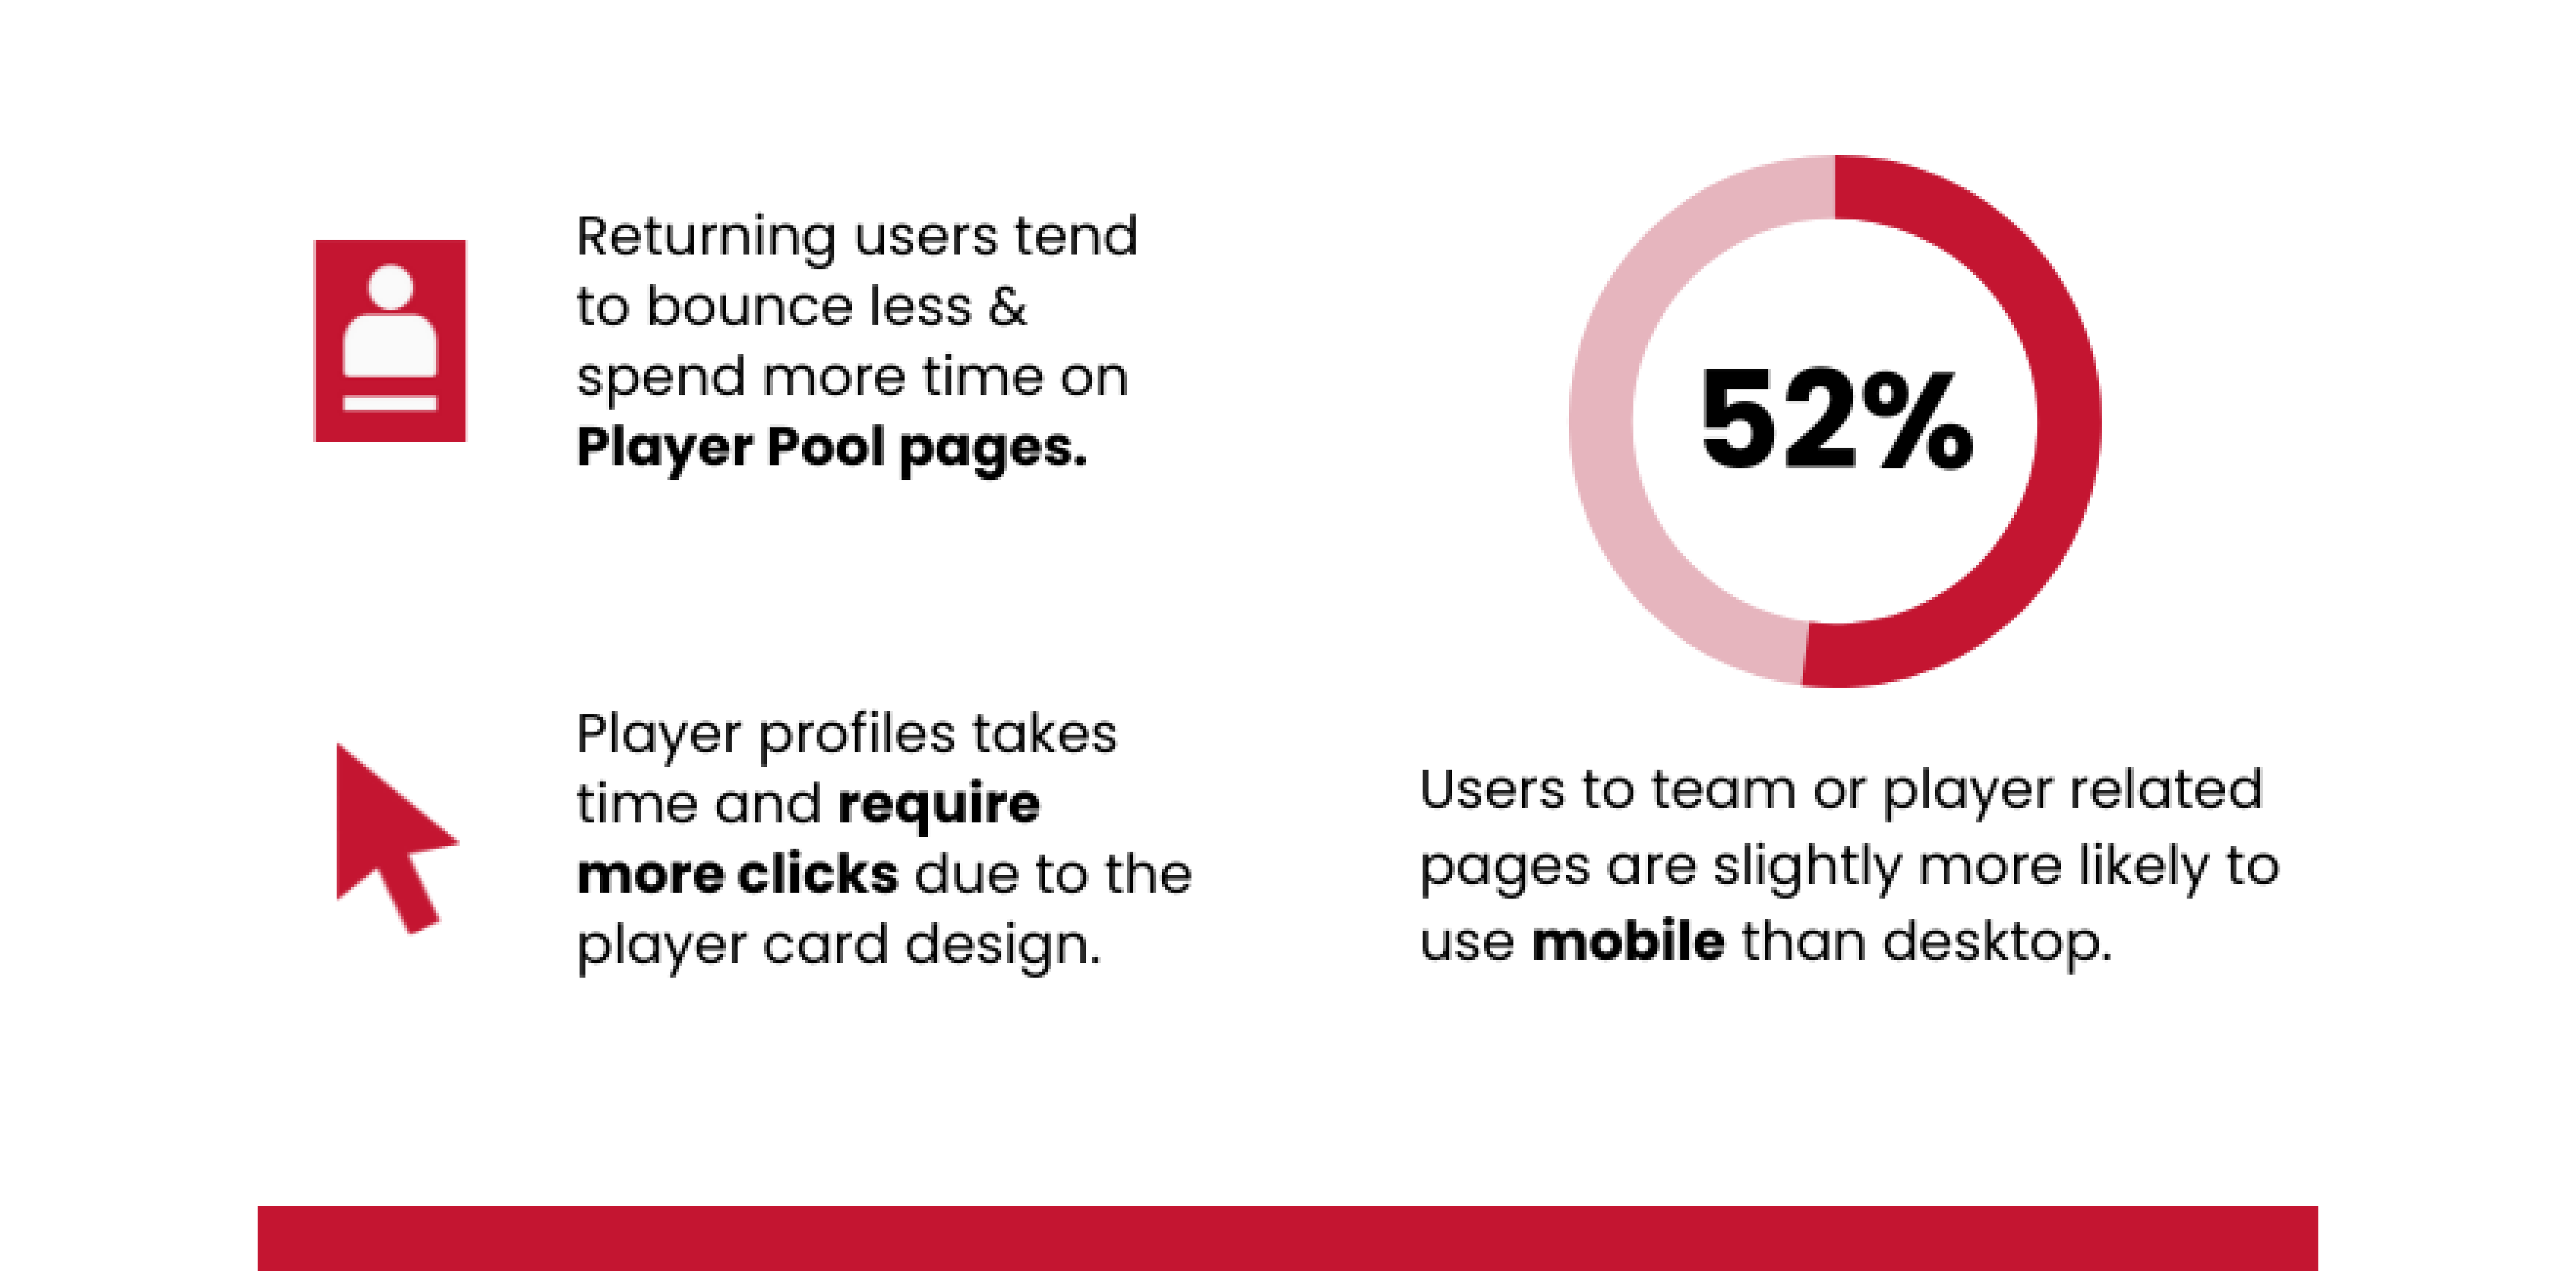
Returning visitors are more thoughtful and focused with their clicks since they know where they want to go and how to get there. They are more prone to invest more time in getting to know a certain team, particularly its lineup.
While Team Homepage gets the most page views from returning visitors, users who browse the schedule and player pool sites pages broaden their information collection. Returning visitors spent more time on the Player Pool page than any category. However, that page only accounts for 12% of their page views. Schedule/Results pages rank second in terms of page views but rank third in terms of time spent on the page. Returning visitors spend the least amount of time on the News pages as well. We feel the website provides enough information in the headline for returning readers to easily choose which article they would or wouldn’t read.
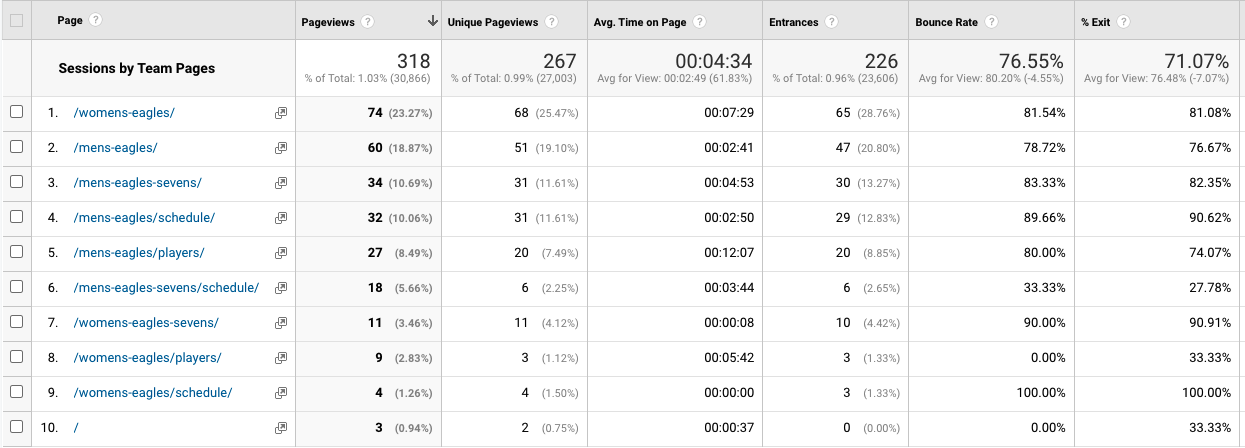
Returning visitors view fewer pages than new users but spend additional time on them. Since the news section is on the homepage, returning users may find the news section redundant. They are more likely to exit than to bounce, get what they are looking for, and then leave.
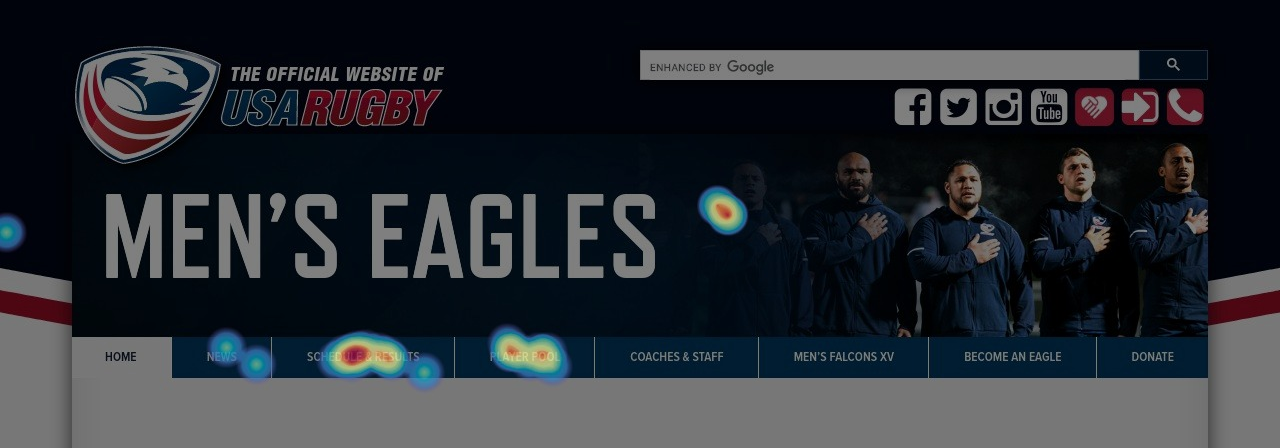
In comparison to the other categories, they spend the most time on player pool pages. They spent 54% more time on team-related pages. The Player Pool page receives 75% more engagement than any other form of the team page. On the navigation bar, Hotjar indicated a lot of activity on the schedule/result and roster pages.
Comparing the activities new and returning visitors do when they arrive on the USA Rugby team web pages
The majority of page views came from team home pages; maybe returning visitors had a better understanding of where they wanted to go while new visitors were browsing. When comparing new and returning visitors, the bounce rates for team-related sites were relatively similar. When comparing these two sorts of visitors, this was the most notable variation in bounce rates across page categories. The Player Pool page appears to be particularly beneficial to returning visitors.
- The team homepage got the most visits; as it is the main center where a visitor would go to start understanding the USA Rugby teams.
- We observed that returning users never make it to a News-related page through hotjar and that current news updates can be accessed under the hero image on the team homepage.
- Since no returning visitors were found visiting the News pages, we could only show bounce rates from new visitors on that page category. This also contributes to our first notion that returning visitors only see news on team home sites.
- In nearly every category, returning visitors spend considerably more time on team-related pages than new visitors.
- They spend more time on Player Pool pages than on any other page category.
- This did stand out to us as a significant suggestion that the Player Pool page could be the most relevant to a returning visitor.
- Returning visitors, on the other hand, behaved quite differently on the Player Pool pages, with lower bounce rates than new visitors.
New v/s Returning visitors’ behavior on schedule & results pages
Summary of Findings from Web Analytics and Heatmaps
Recommendations
Improving Player Profile pages’ accessible options
New users are more frequent to the team pages but returning users spend more time on those pages, especially the roster page. Both types favor the schedule/results and player pool pages over the news section or other pages on the home navigation. Neither type uses the site search on this page or hovers/clicks on the icons below the site search page. We believe that areas connected to the team roster could be improved because of these findings.

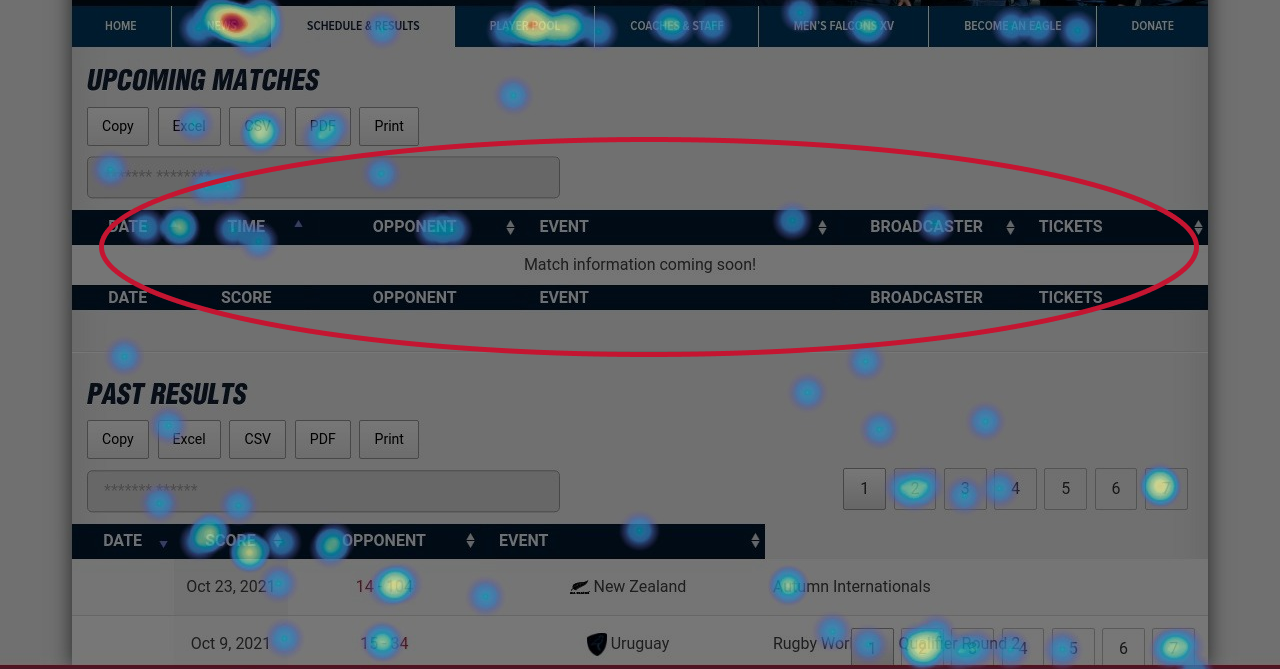
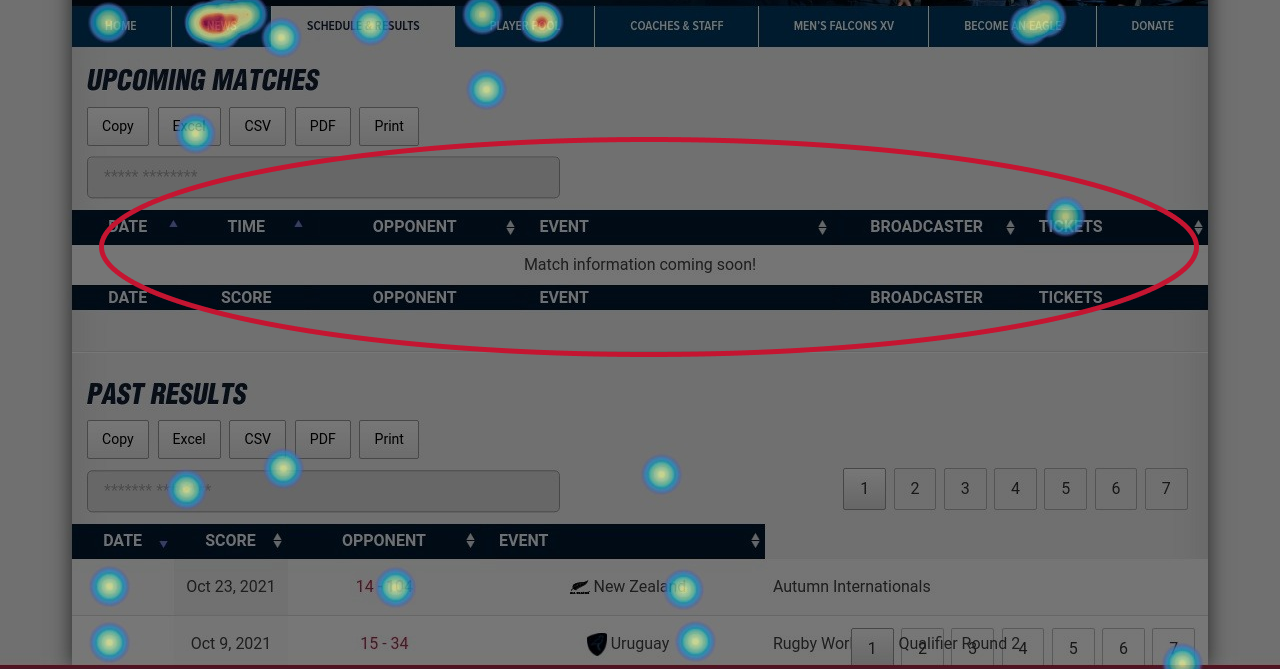
Clear alternatives to reduce uncertainty about upcoming matches
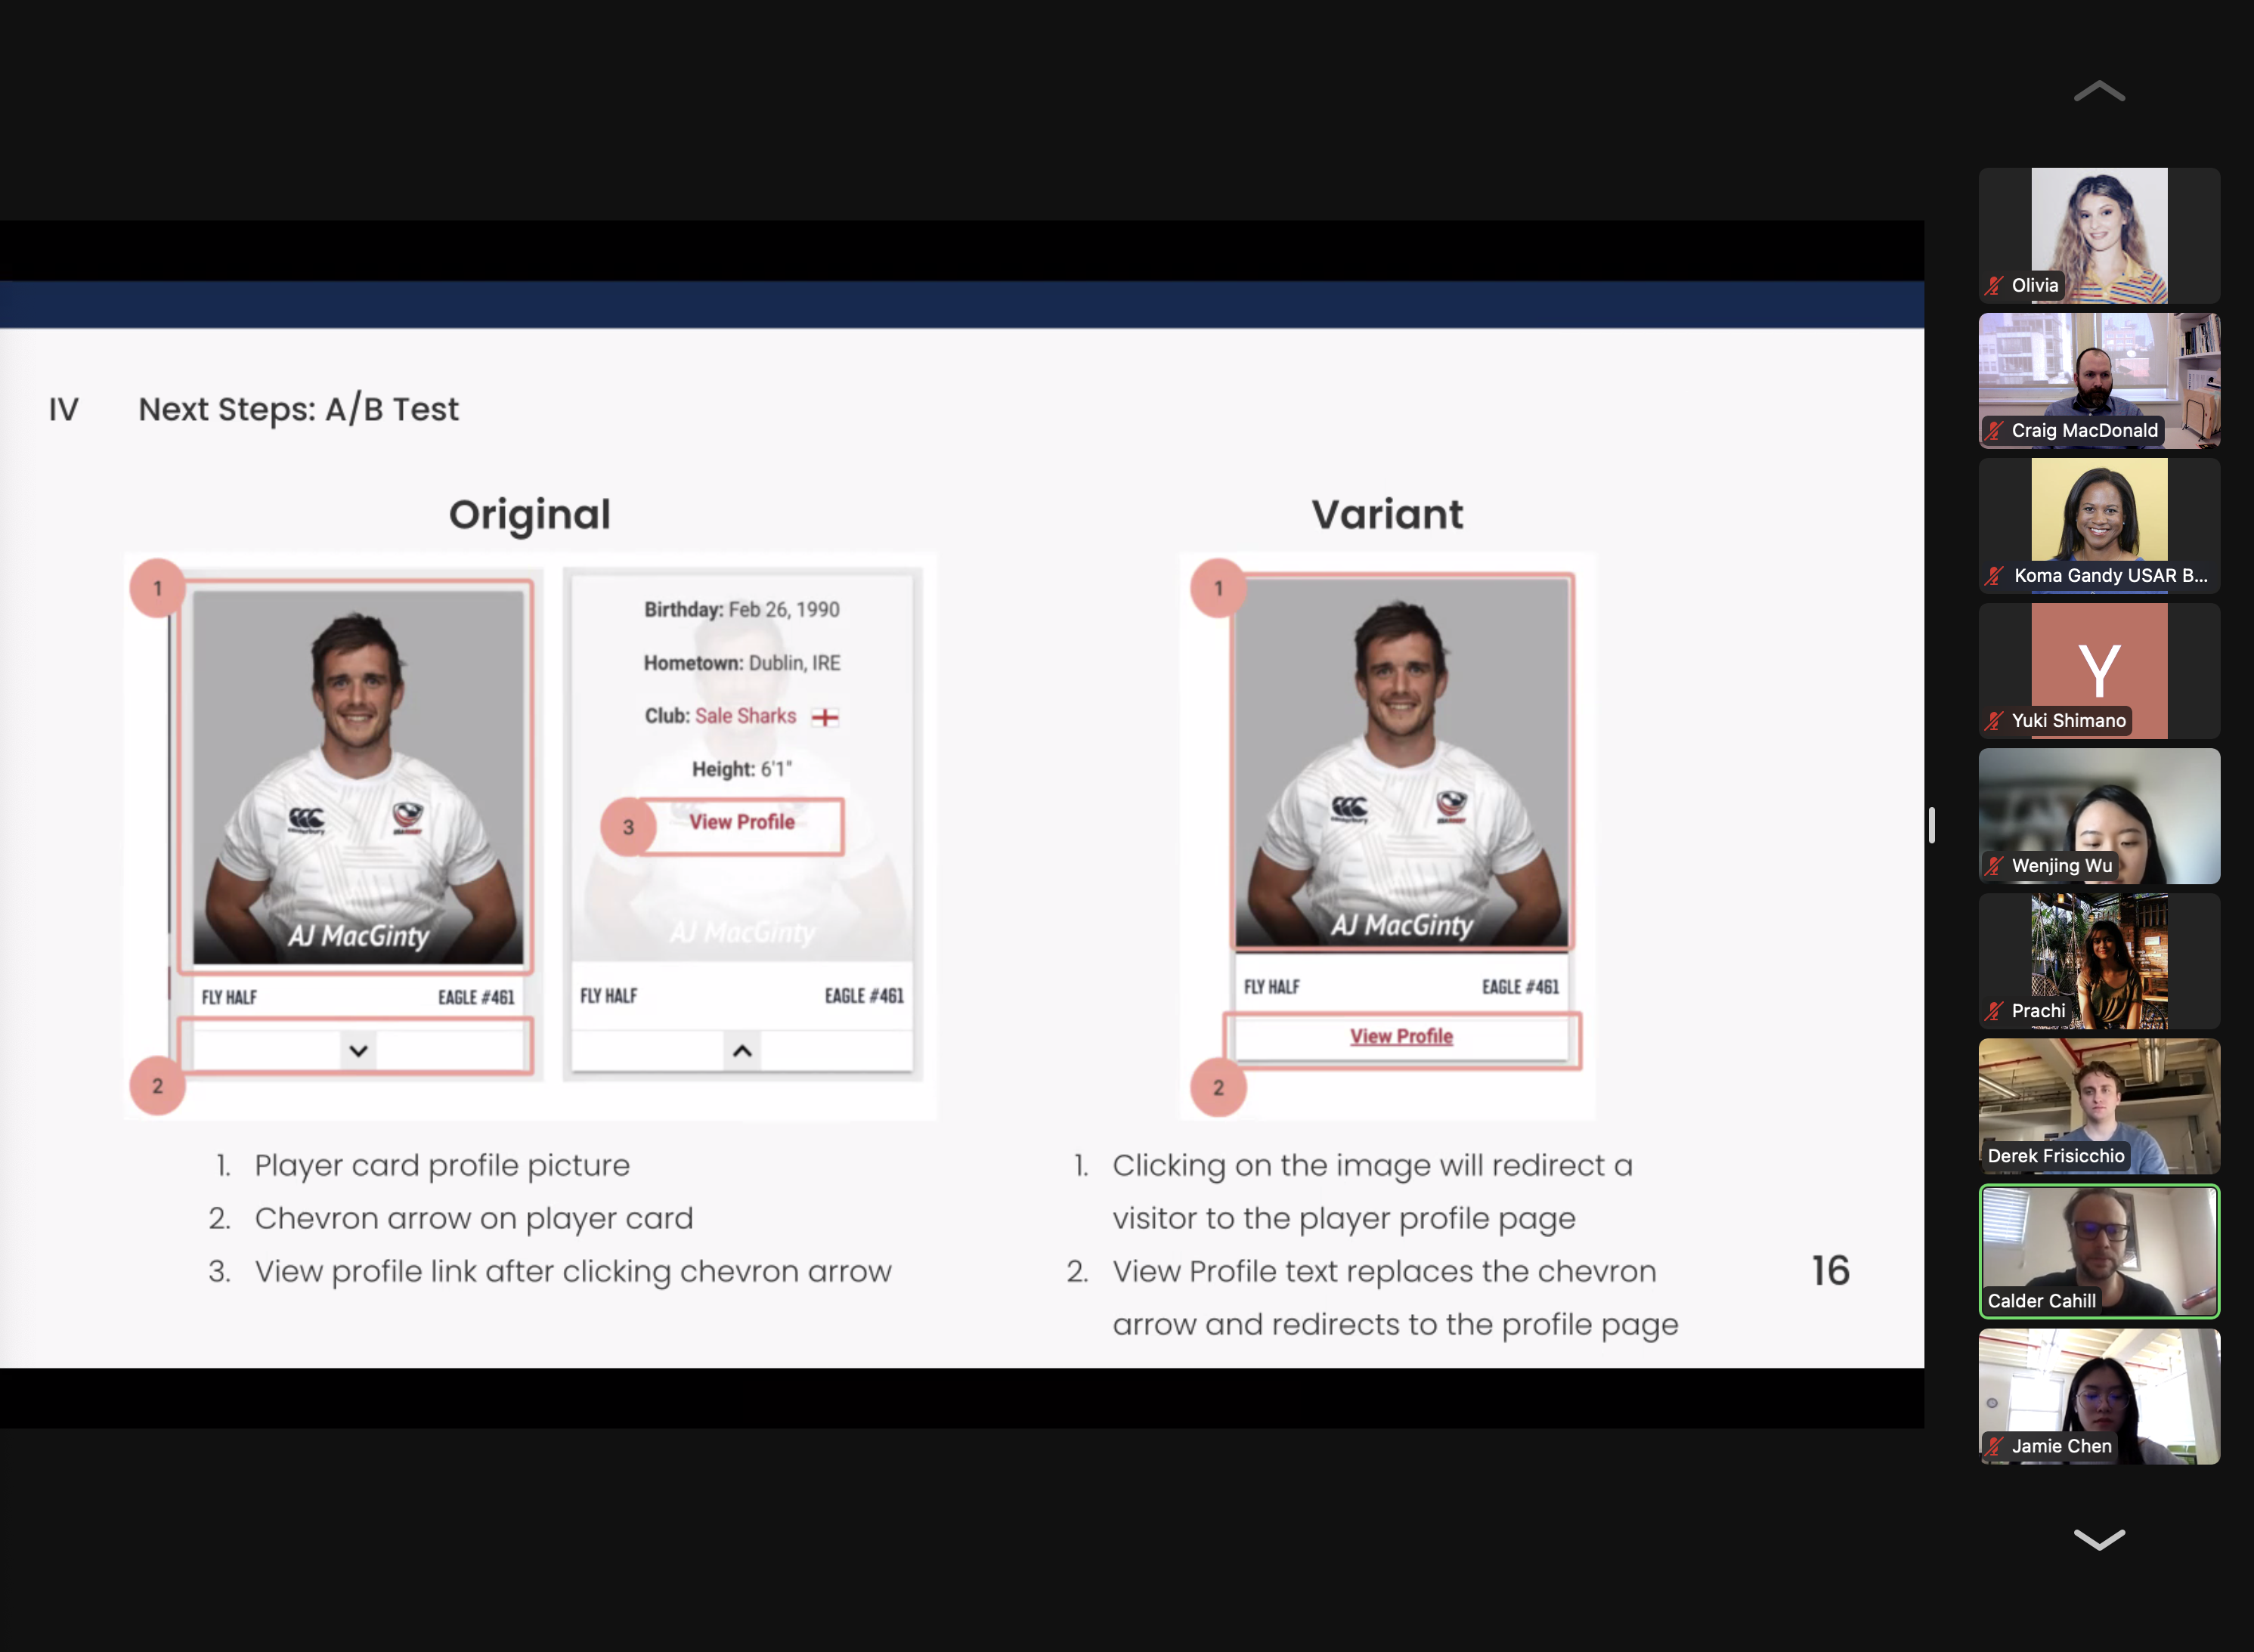
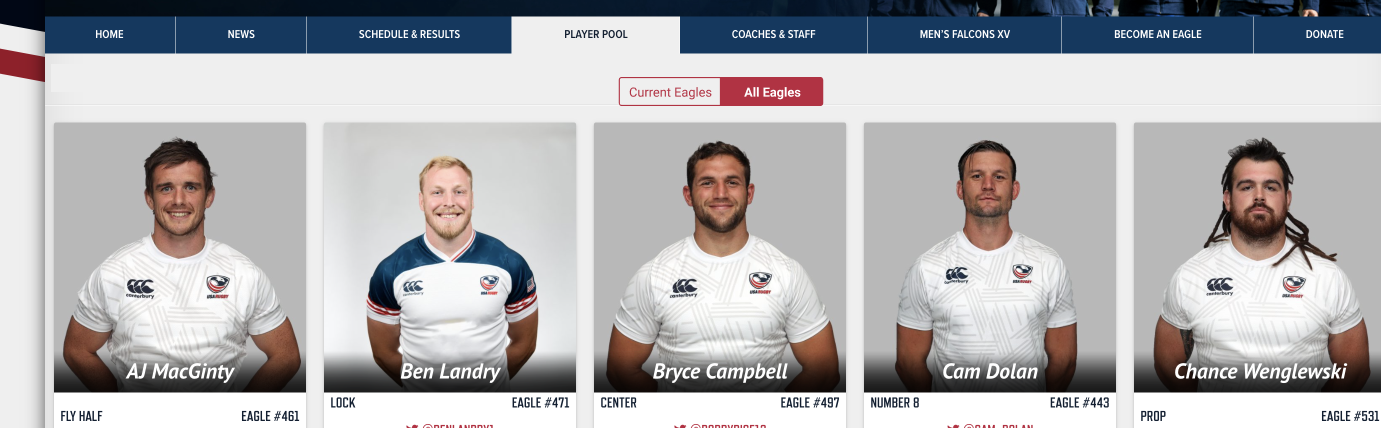
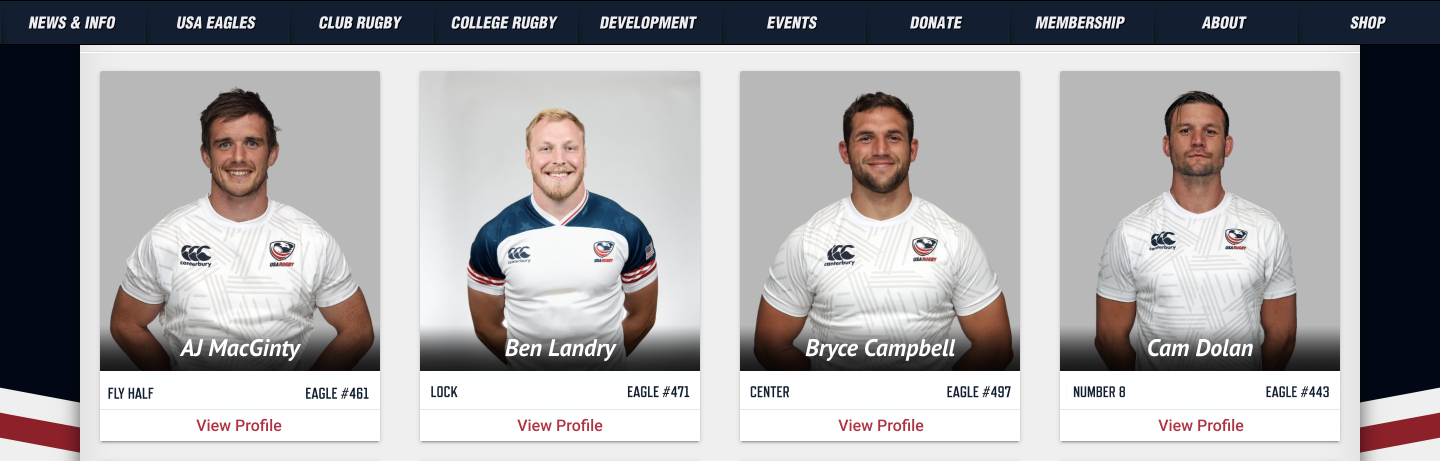
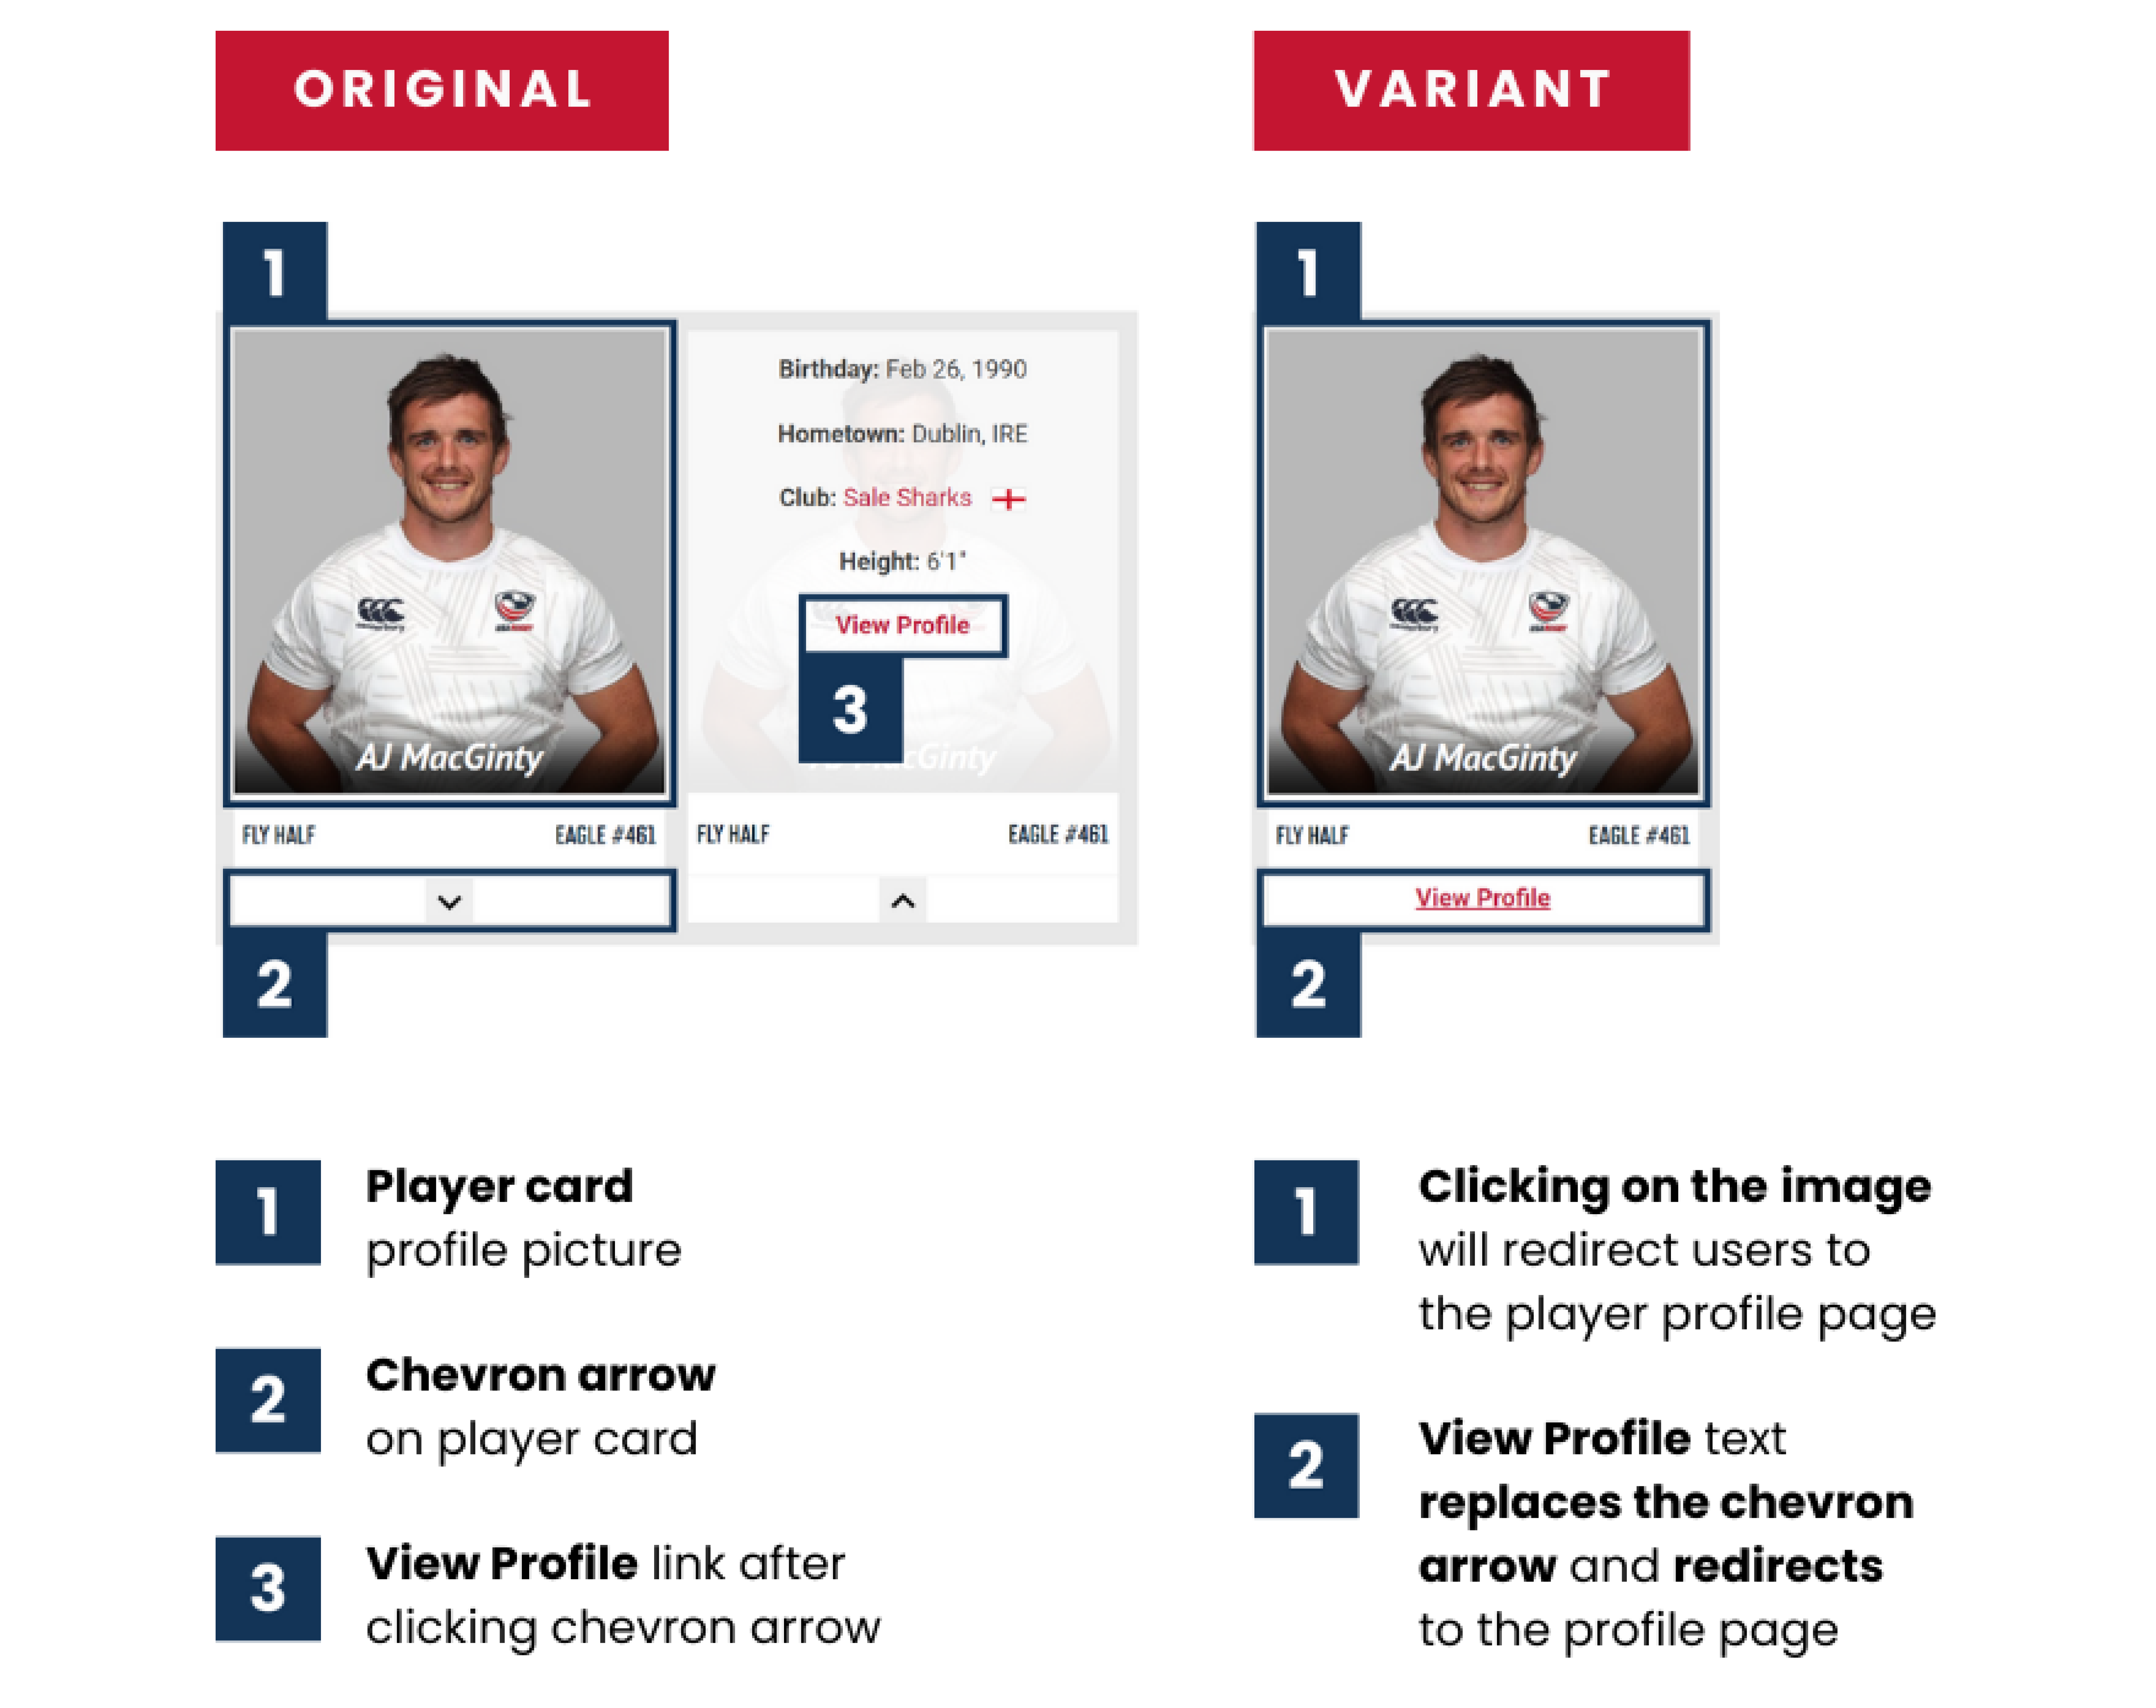
The filter is not intuitive for users, and they prefer to use chevron arrows for players (e.g. clicking to open to close). Visitors were not spotted effectively using the chevron or going to a player profile page. Maybe there wasn’t sufficient content to explain to new visitors how they can or cannot interact. They were interacting with the player card by intending to click the chevron arrow. They would then be sent to the Player Profile page. We can create a default experience that can make navigation and wayfinding easier for all visitors. Adding the View Profile link to the player card instead of hiding it behind the chevron arrow can create a faster, more understandable way of finding specifics about a player.
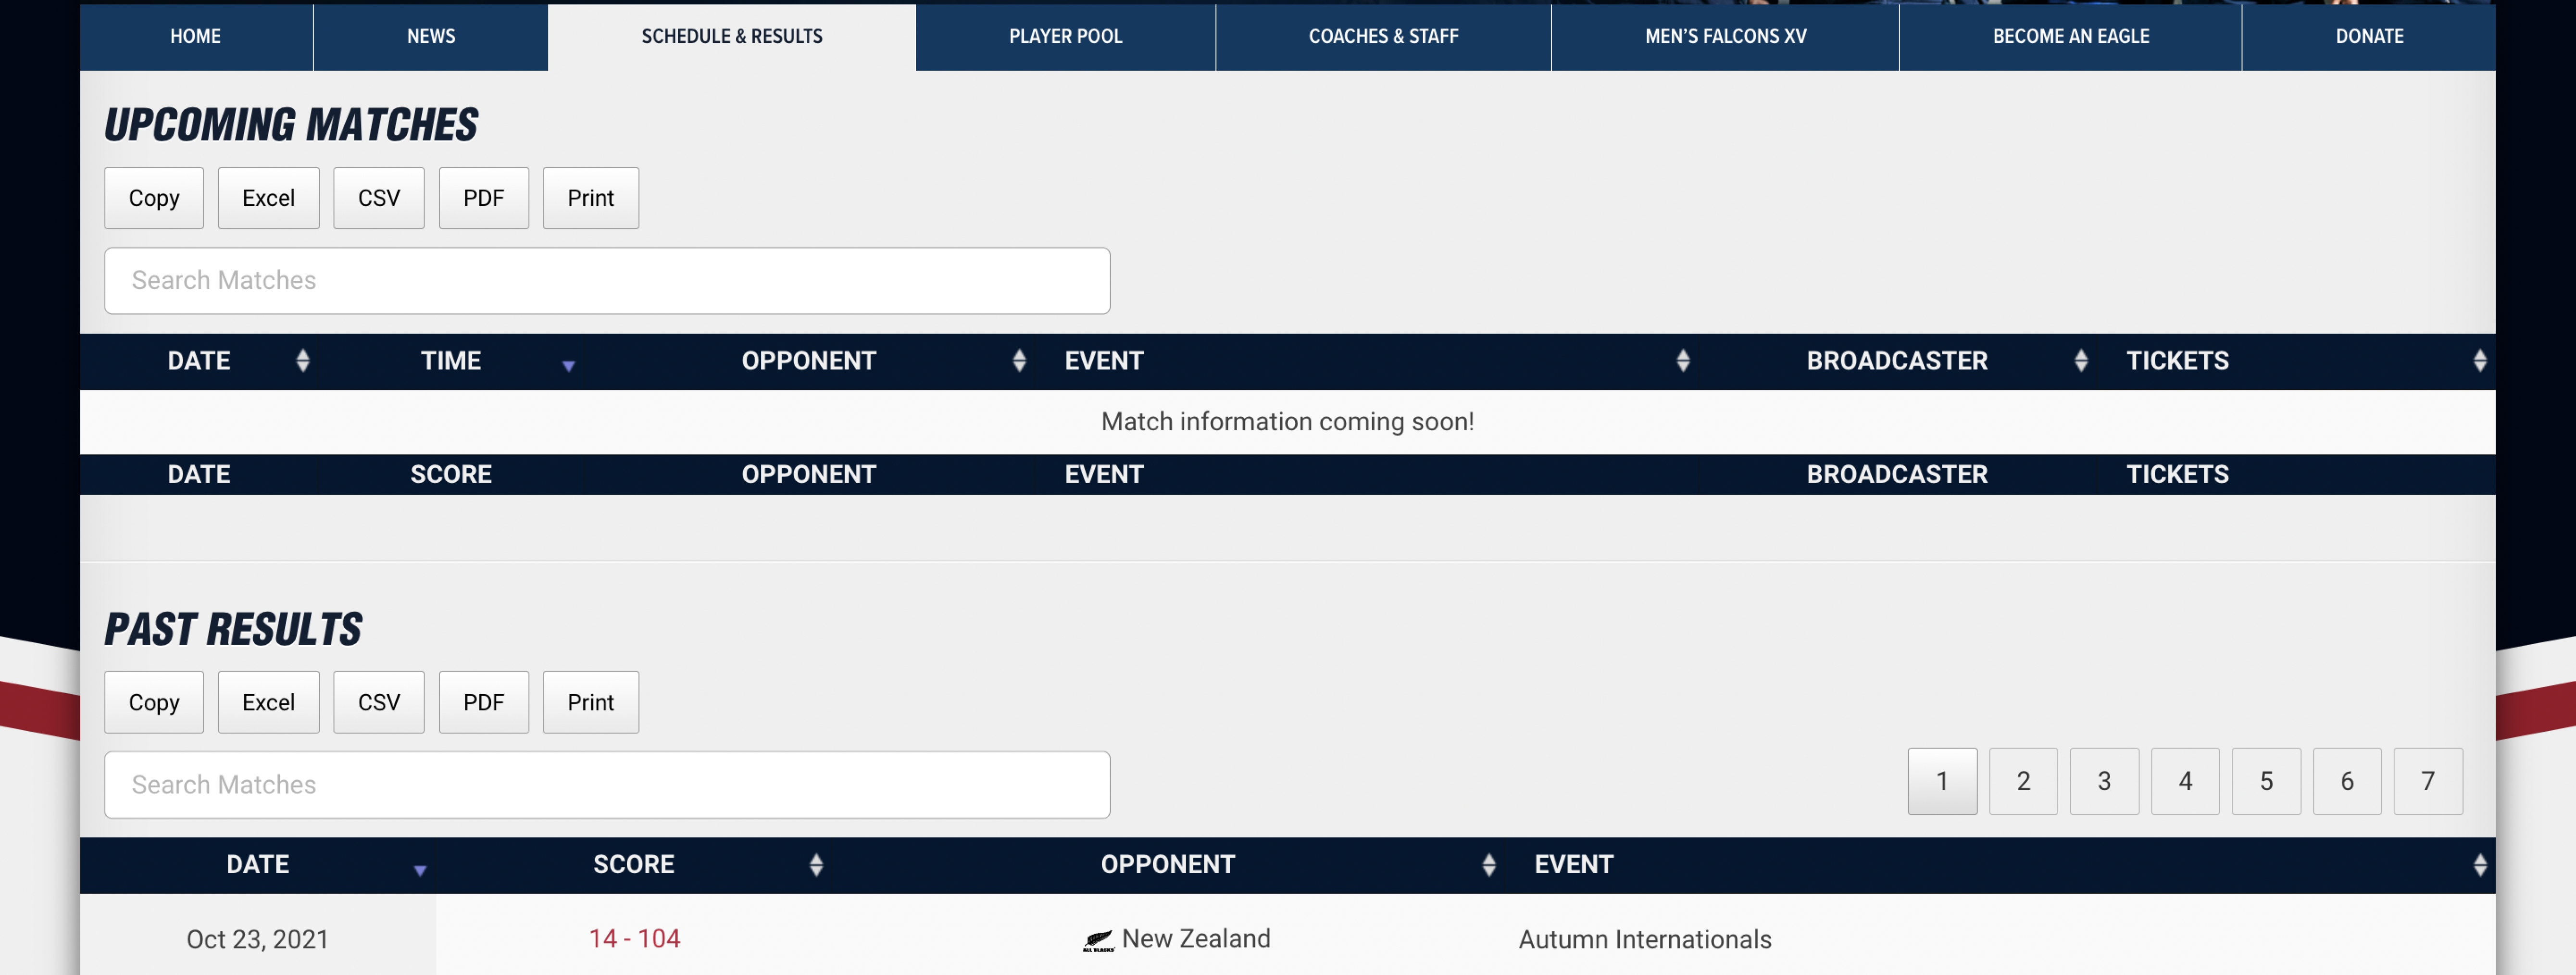

Disabling the ability to sort out upcoming matches if no information is provided will facilitate reducing ambiguity. Also, not displaying the bottom column headers in this section may help grasp the fact that there is no actionable feature. We’ve put a button in each row to make it easier for people to check up on prior matches and browse for additional details about a match they’re interested in.
Next Steps
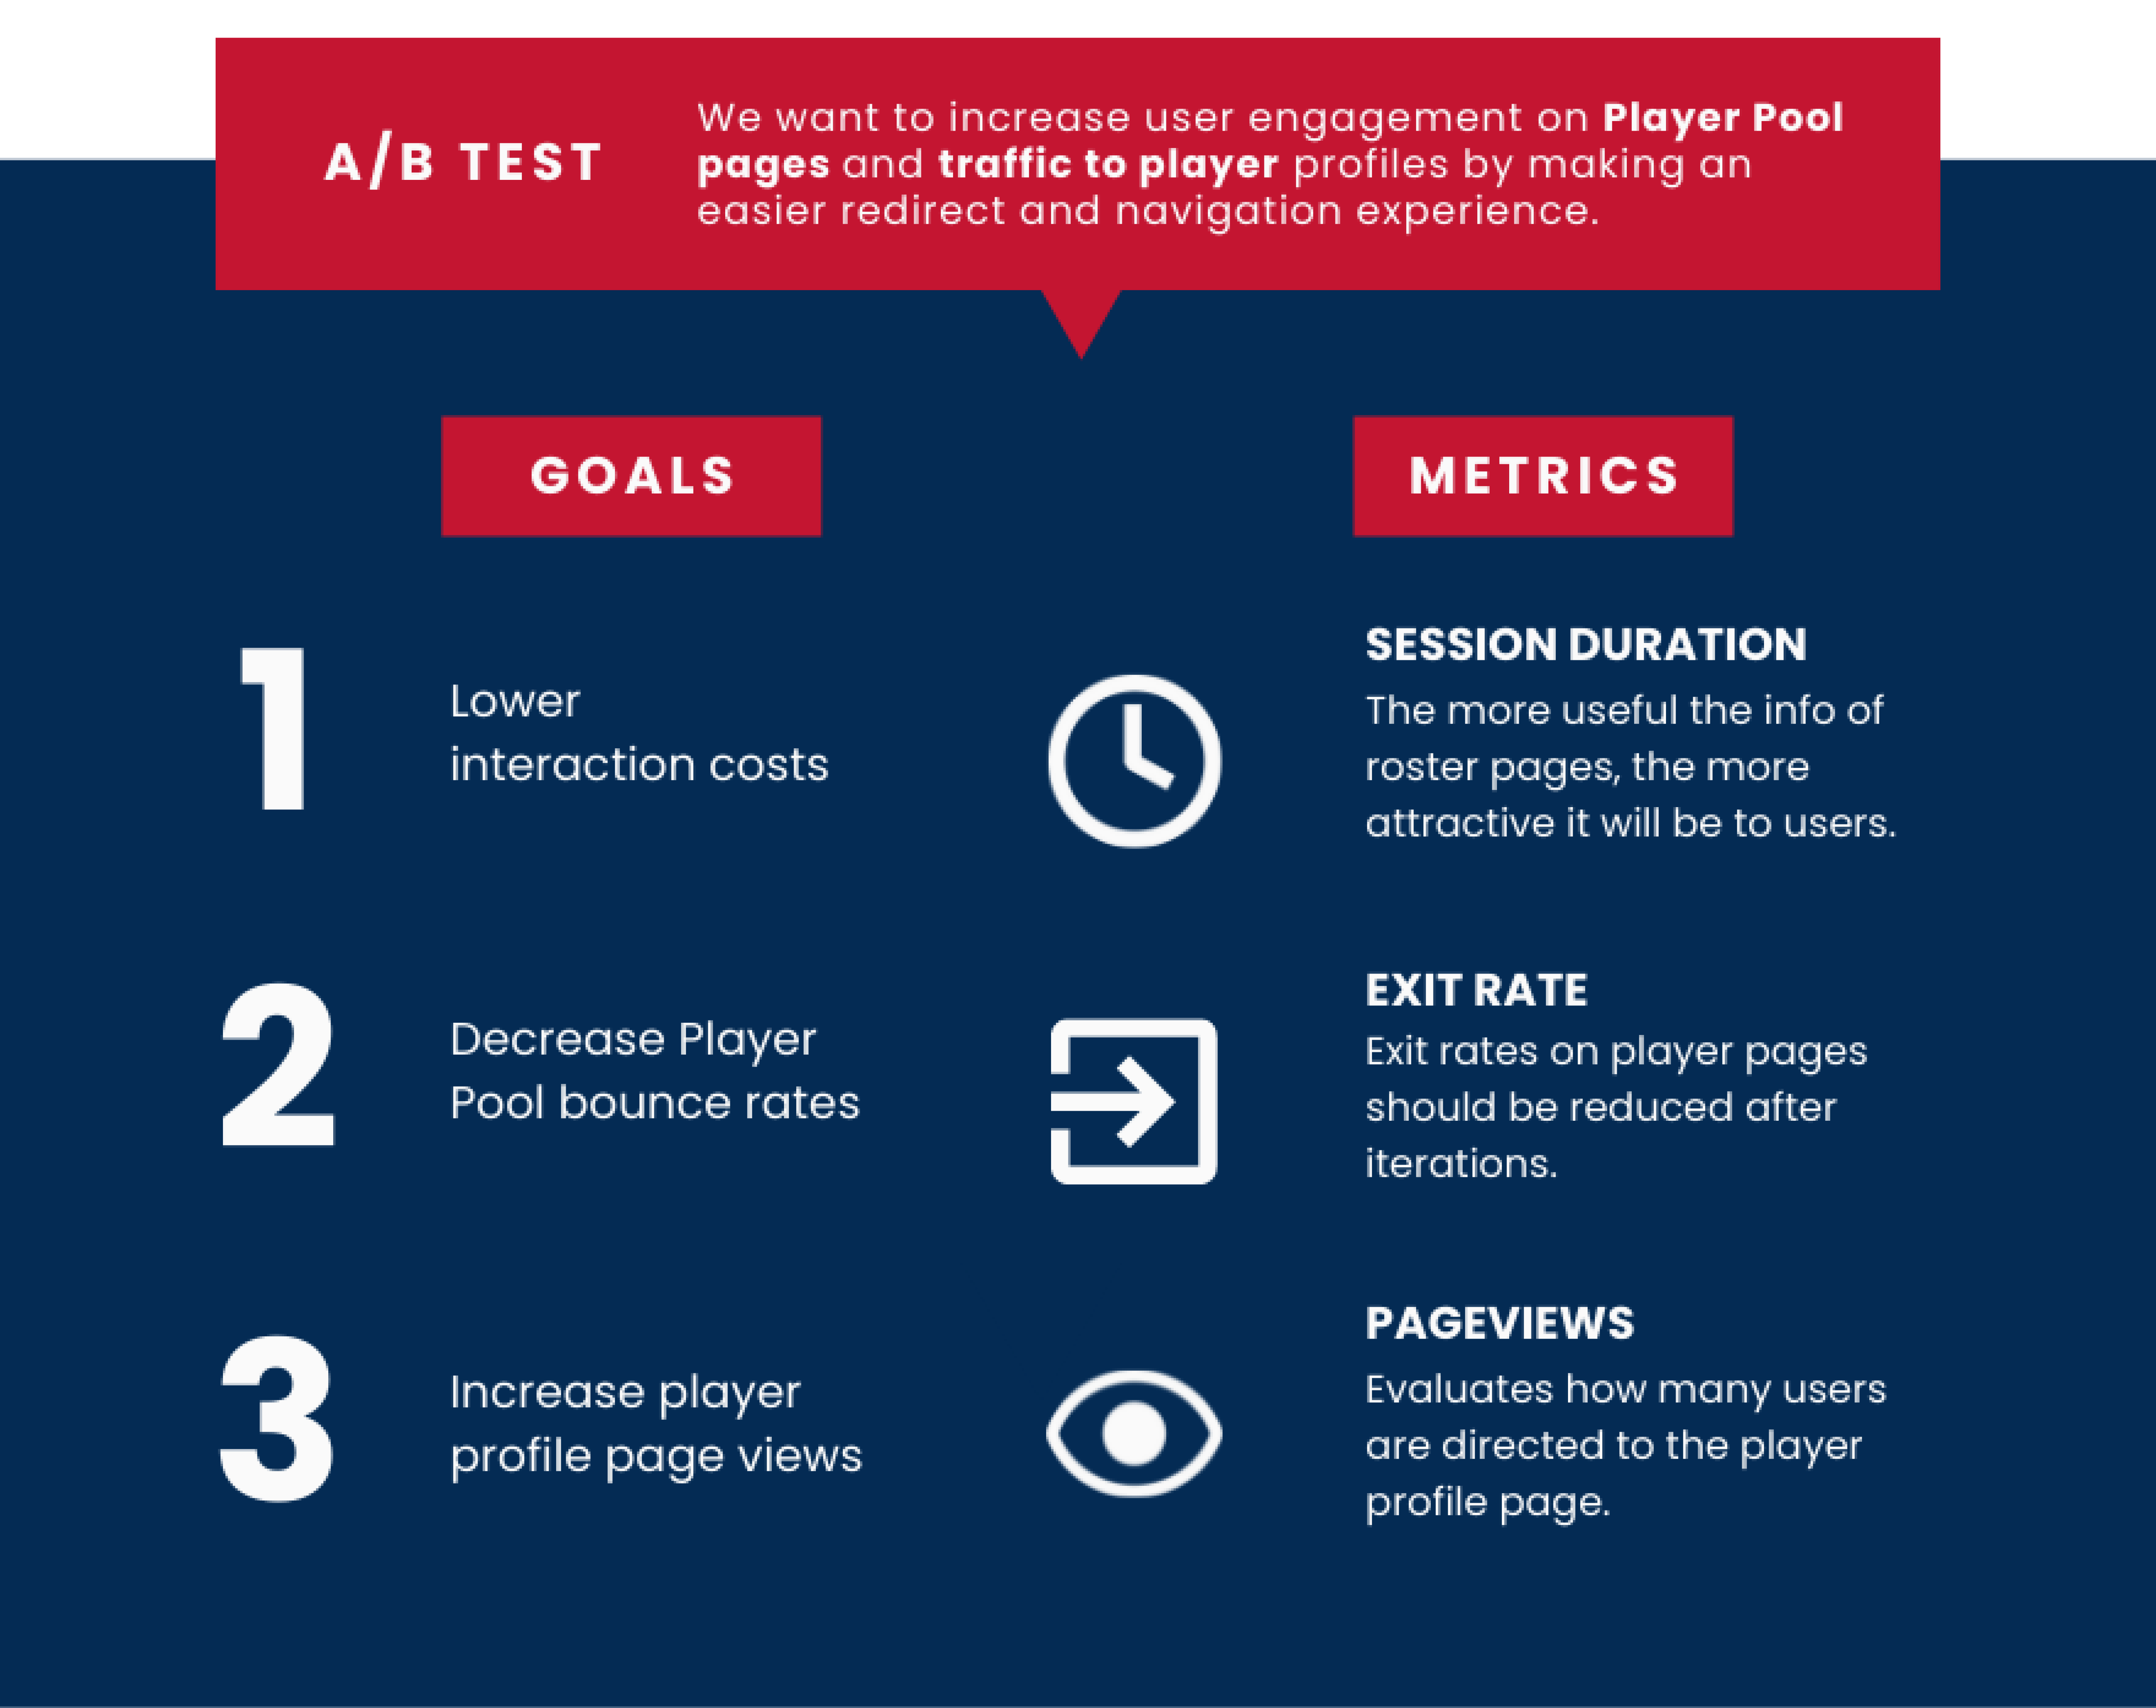
A/B Test
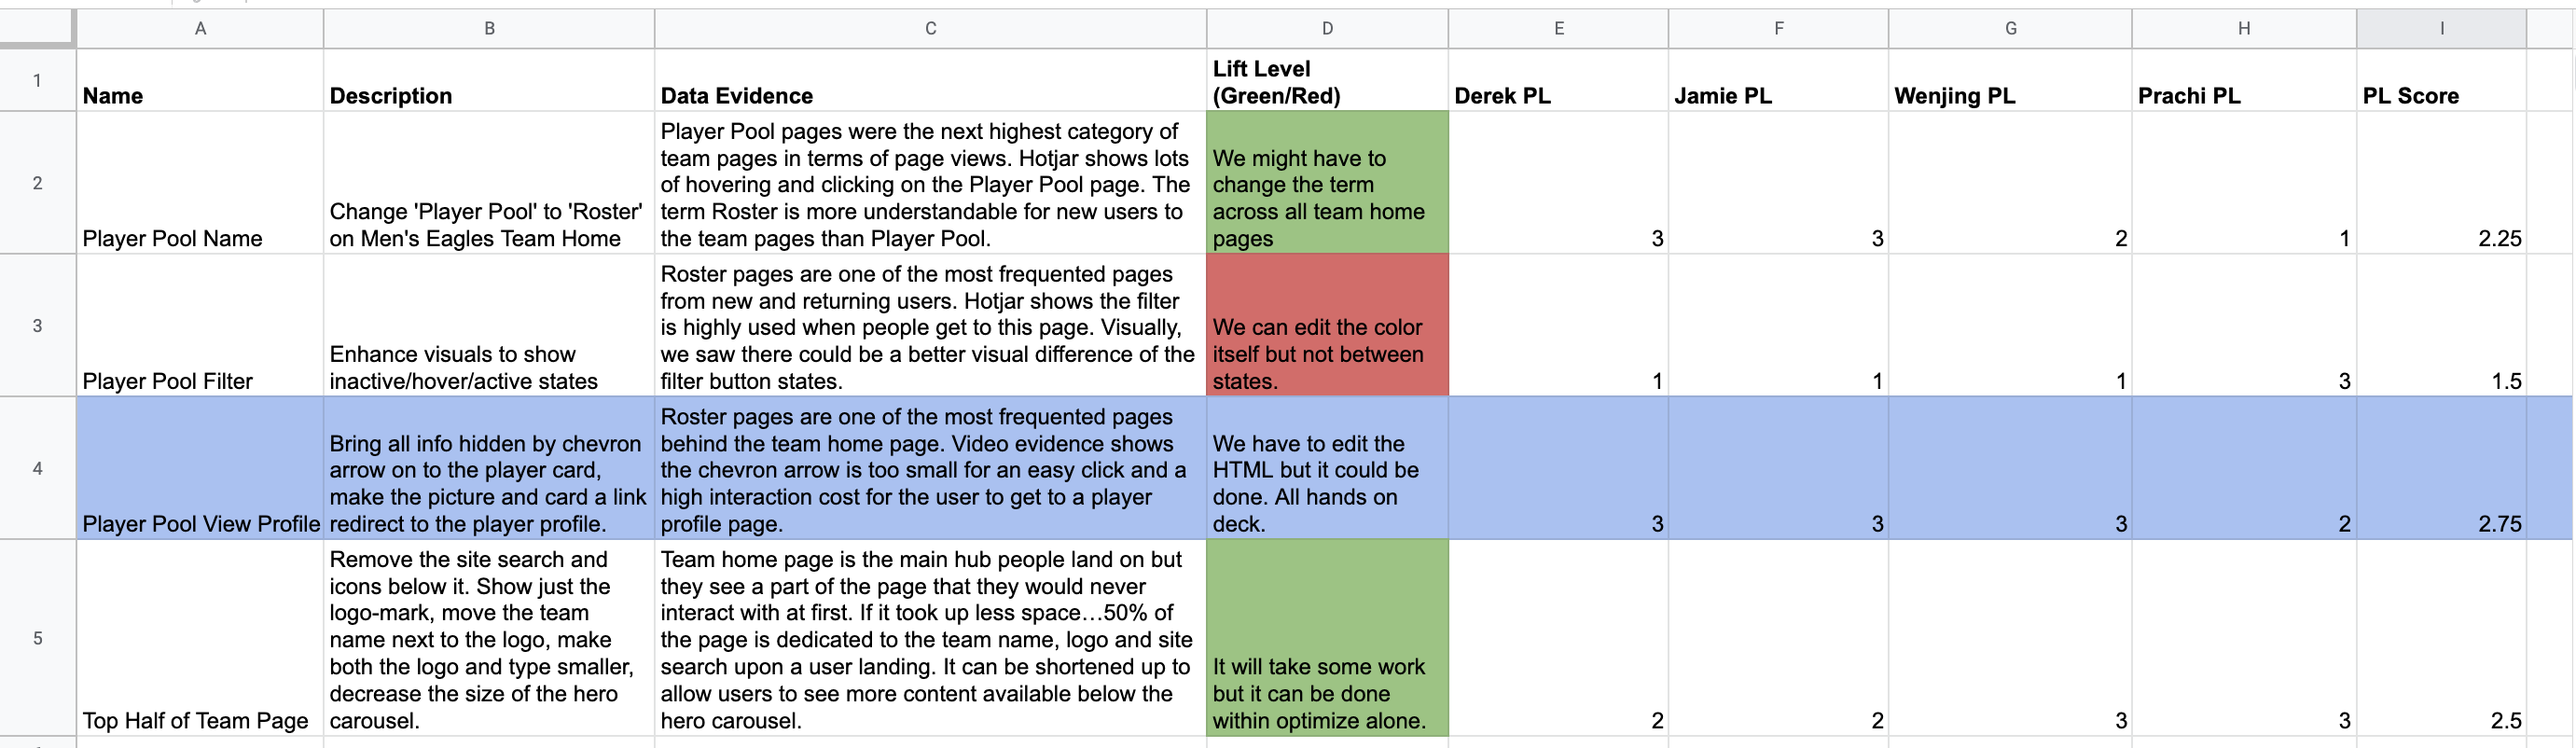
Out of all the recommendations to optimize the fan experience, our team aligned on first updating the player card would show an immediate improvement. By adjusting the HTML of each card component, the design was relatively simple to generate with Google Optimize. Our primary objective is to enhance user engagement on Player Pool pages and increase traffic to player profiles by improving the redirect and navigation experience. We believe that having the ‘view profile’ link and making the image clickable will reduce bounce rates from all rugby teams’ Player Pool pages.
My team and I presented our results and ideas to USA Rugby, The deliverables included a slide show and a one-page summary that outlined our findings of the study.
We were happy to see that the USA Rugby representatives found our findings and recommendations thoughtful and actionable. They are excited to share our findings with their colleagues which might come in handy if they want to propose a new design for the website.
I am pleased that we were able to extract conclusive results from raw data once we have defined the questions to ask and chosen our research goals. It was amazing to be a part of this since we were able to convey our key points while showing that little updates in the design can possibly make a huge difference in the overall experience.