User Search Tool Evaluation Report
SPRING 2022 Smithsonian Learning Lab Digital Analytic Conducted by Pratt Institute School of Information
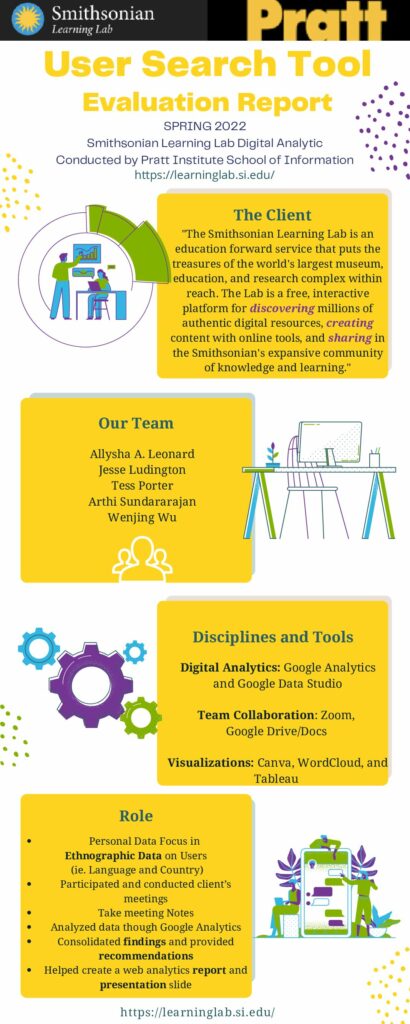
THE CLIENT
“The Smithsonian Learning Lab is an education forward service that puts the treasures of the world’s largest museum, education, and research complex within reach. The Lab is a free, interactive platform for discovering millions of authentic digital resources, creating content with online tools, and sharing in the Smithsonian’s expansive community of knowledge and learning.”
OUR TEAM
Allysha A. Leonard, Jesse Ludington, Tess Porter, Arthi Sundararajan, Wenjing Wu
DISCIPLINES AND TOOLS
Digital Analytics: Google Analytics
and Google Data Studio
Team Collaboration: Zoom,
Google Drive/Docs
Visualizations: Canva, WordCloud, and Tableau
ROLE
- Personal Data Focus in Ethnographic Data on Users (ie. Language and Country)
- Participated and conducted client’s meetings
- Take meeting Notes
- Analyzed data though Google Analytics
- Consolidated findings and provided recommendations
- Helped create a web analytics report and presentation slide
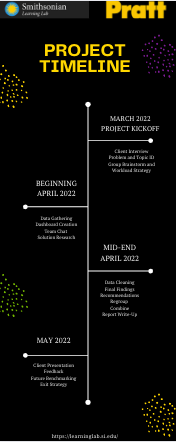
PROJECT TIMELINE
- MARCH 2022 PROJECT KICKOFF: Client Interview Problem and Topic ID Group Brainstorm and Workload Strategy
- BEGINNING APRIL 2022: Data Gathering Dashboard Creation Team Chat Solution Research
- MID-END APRIL 2022: Data Cleaning Final Findings Recommendations Regroup Combine Report Write-Up
- MAY 2022: Client Presentation Feedback Future Benchmarking Exit Strategy
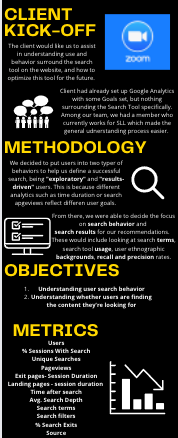
Client Kick-Off
The client met us through ZOOM and would like us to assist in understanding use and behavior surround the search tool on the website, and how to optimize this tool for the future. Client had already set up Google Analytics with some Goals set, but nothing surrounding the Search Tool specifically. Among our team, we had a member who currently works for SLL which made the general understanding process easier.
Methodology
We decided to put users into two typer of behaviors to help us define a successful search, being “exploratory” and “results-driven” users. This is because different analytics such as time duration or search pageviews reflect different user goals. From there, we were able to decide the focus on search behavior and search results for our recommendations. These would include looking at search terms, search tool usage, user ethnographic backgrounds, recall and precision rates.
Objectives
1. Understanding user search behavior
2. Understanding whether users are finding the content they’re looking for
Metrics
Users
% Sessions With Search
Unique Searches
Pageviews
Exit pages – Session Duration
Landing pages – session duration
Time after search
Avg. Search Depth
Search terms
Search filters
% Search Exits
Source
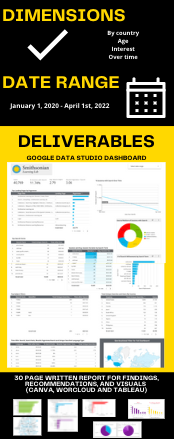
Dimensions
By country
Age
Interest Over time
DATE RANGE
January 1, 2020 – April 1st, 2022
Deliverables
Google Data Studio Dashboard
30 Page Written Report For Findings, Recommendations, and Visuals (Canva, Wordcloud and Tableau)
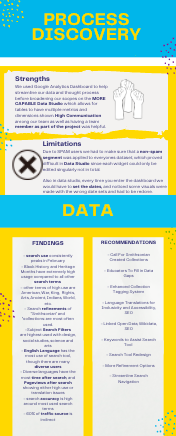
PROCESS DISCOVERY
Strengths
We used Google Analytics Dashboard to help streamline our data and thought process before broadening our scopes on the MORE CAPABLE Data Studio which allows for tables to have multiple metrics and dimensions shown. High Communication among our team as well as having a team member as part of the project was helpful.
Limitations
Due to SPAM users we had to make sure that a non-spam segment was applied to everyones dataset, which proved difficult in Data Studio since each widget could only be edited singularly not in total. Also in data studio, every time you enter the dashboard we would have to set the dates, and noticed some visuals were made with the wrong date sets and had to be redone.
DATA
FINDINGS
– search use consistently peaks in February
– Black History and Heritage Months have extremely high usage compared to all other search terms
– other terms of high use are American, War, King, Rights, Arts, Ancient, Indians, World, etc.
– Search refinements of “Smithsonian” and “collections: are most often used.
-Subject Search Filters are highest used with design, social studies, science and arts
– English Language has the most use of search tool, though there are many diverse users
– Diverse languages have the most time after search, and Pageviews after search showing either high use or translation issues
– search accuracy is high around most used search terms
– 60% of traffic source is indirect
RECOMMENDATIONS
– Call For Smithsonian Created Collections
– Educators To Fill in Data Gaps
– Enhanced Collection Tagging System
– Language Translations for Inclusivity and Accessibility, SEO
– Linked Open Data, Wikidata, SEO
– Keywords to Assist Search Tool
– Search Tool Redesign
– More Refinement Options
– Streamline Search Navigation
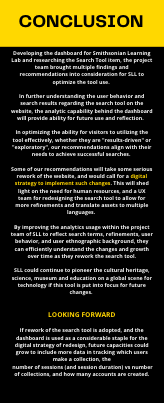
CONCLUSION
Developing the dashboard for Smithsonian Learning Lab and researching the Search Tool item, the project team brought multiple findings and recommendations into consideration for SLL to optimize the tool use.
In further understanding the user behavior and search results regarding the search tool on the website, the analytic capability behind the dashboard will provide ability for future use and reflection.
In optimizing the ability for visitors to utilizing the tool effectively, whether they are “results-driven” or “exploratory”, our recommendations align with their needs to achieve successful searches.
Some of our recommendations will take some serious rework of the website, and would call for a digital strategy to implement such changes. This will shed light on the need for human resources, and a UX team for redesigning the search tool to allow for more refinements and translate assets to multiple languages.
By improving the analytics usage within the project team of SLL to reflect search terms, refinements, user behavior, and user ethnographic background, they can efficiently understand the changes and growth over time as they rework the search tool.
SLL could continue to pioneer the cultural heritage, science, museum and education on a global scene for technology if this tool is put into focus for future changes.
LOOKING FORWARD
If rework of the search tool is adopted, and the dashboard is used as a considerable staple for the digital strategy of redesign, future capacities could grow to include more data in tracking which users make a collection, the number of sessions (and session duration) vs number of collections, and how many accounts are created.