Client Overview
The Smithsonian Learning Lab is a free platform for discovering millions of digital resources (objects, artwork, photographs, text, audio, video, and more) from across the Smithsonian, creating personalized interactive learning experiences (“collections”), and sharing in the Smithsonian’s expansive community of knowledge and learning. It is designed for PreK–12 teachers and students but is available for anyone to use.
The team behind the Lab, the Smithsonian Office of Educational Technology (OET), leads the Smithsonian in increasing digital access to museum resources for PreK–12 education.
Goals
Faced with the increasing number of users and user-created interactive experiences on the platform, OET wants to understand how users interact with the Lab’s primary feature: search.
Our research focuses on two guiding questions:
![]()
Search Behavior:
How are users using the Lab’s search?
![]()
Search Results:
Are users finding the content they’re looking for?
Answering these guiding questions will help OET better understand what users are looking for, how to improve the Lab’s search interface, how to support Smithsonian educators in building new educational content to fill gaps, and how to improve user supports for creating and publishing collections that are easily discoverable by others.
Our Team
Allysha Leonard
MS Museums and Digital Culture
Jesse Ludington
MS Museums and Digital Culture
Tess Porter
MS Museums and Digital Culture
Arthi Sundararajan
MS Information Experience Design
Wenjing Wu
MS Information Experience Design
In addition to my role as a Pratt student, I have worked with the Smithsonian Learning Lab since 2015 and am currently a Digital Content Producer at OET. My analytics research for this project focuses on understanding patterns in search terms, how users are using Refine Search filters, how users search for specific museums, and how software improvements and Smithsonian-created educational content can fill existing gaps and meet user needs.
Our Process
![]()
1. Client Kick-off Meeting
March 23, 2022
➜
![]()
2. Data Analysis
➜
![]()
3. Development of Findings
and Recommendations
➜
![]()
4. Client Presentation
May 4, 2022
- Client Meeting: This opportunity enabled our team to have a conversation with the client to hear their platform goals, ask questions, and gain data access.
- Data Analysis: In this phase, the team developed guiding questions for research and began assessing the provided data. This phase included the initial development of a Google Data Studio dashboard to track quarterly search analytics, later finalized in Phase 03.
- Development of Findings and Recommendations: This phase included multiple team meetings to discuss findings and recommendations, the development of the final report, and the completion of the Google Data Studio dashboard.
- Client Presentation: This opportunity included a 20-minute presentation to the client of our findings and recommendations with time after for a larger discussion. We also turned over control of the Google Data Studio dashboard to support OET’s future work.
Methodology
Data Source
The data was pulled from Google Analytics UA for the period January 1, 2020 to April 1, 2022. This period was chosen to capture data from the influx of users at the beginning of the COVID-19 pandemic as educators and caregivers sought remote learning resources.

Data Tools
I used Google Data Studio and Google Sheets as analysis and visualization tools for data pulled from Google Analytics UA, while other teammates also used Microsoft Excel and Tableau. Google Data Studio allowed me to pull data directly from Google Analytics UA and visualize it in more complex ways than Google Analytics dashboards could provide, and Google Sheets’ enabled the quick organization of data and development of flexible analysis charts.


Metrics studied include:
- Users
- Pageviews
- Unique pageviews
- Exit pages
- Session duration
- Landing pages
- Source
- Sessions with search
- Unique searches
- Time after search
- Average search depth
- Search terms
- Search filters
- Search refinements
- Search exits
Limitations of our research are as follows:
- Lack of event tracking for search on Google Analytics.
- Lack of search filter tracking, outside of Subject Filters, as search terms on Google Analytics.
- Lack of insight into user motivations through lack of qualitative data; dividing users into those who are exploratory and those who are results-driven is an assumption made based on search behavior.
- Lack of insight into end-use of content through lack of qualitative data; we do not have insight into whether sessions with search are based on independent use or teaching in the classroom.
Findings and Recommendations
View the full findings and recommendations in our final evaluation report and presentation linked above. The following is a summary of the key findings and recommendations I developed as a team researcher.
Findings
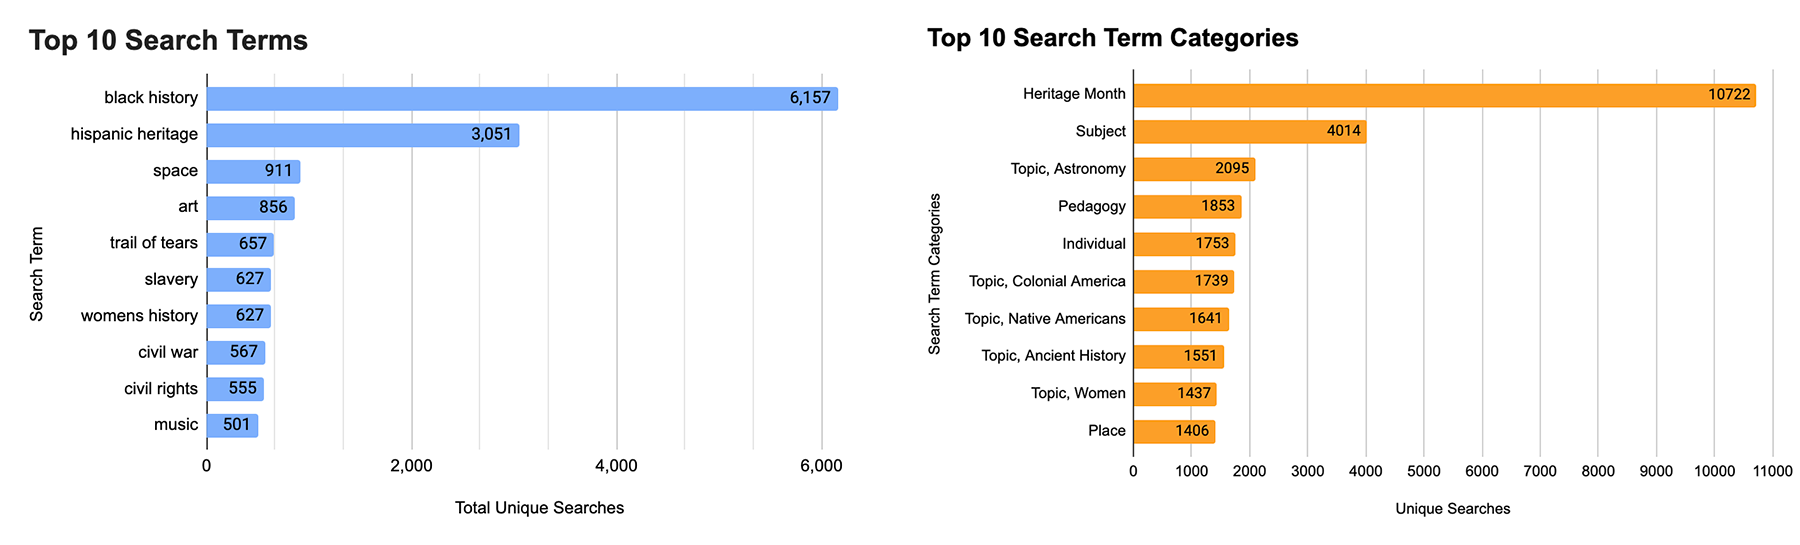
Finding 1: Searches related to heritage months, followed closely by subject areas, are the most popular. Searches related to heritage months include “black history,” “hispanic heritage,” “asian pacific american history,” “american indian heritage,” and “women’s history.” Searches for subject areas are highly varied and include both broad subjects (ie. science) and more specific subjects (ie. chemistry).
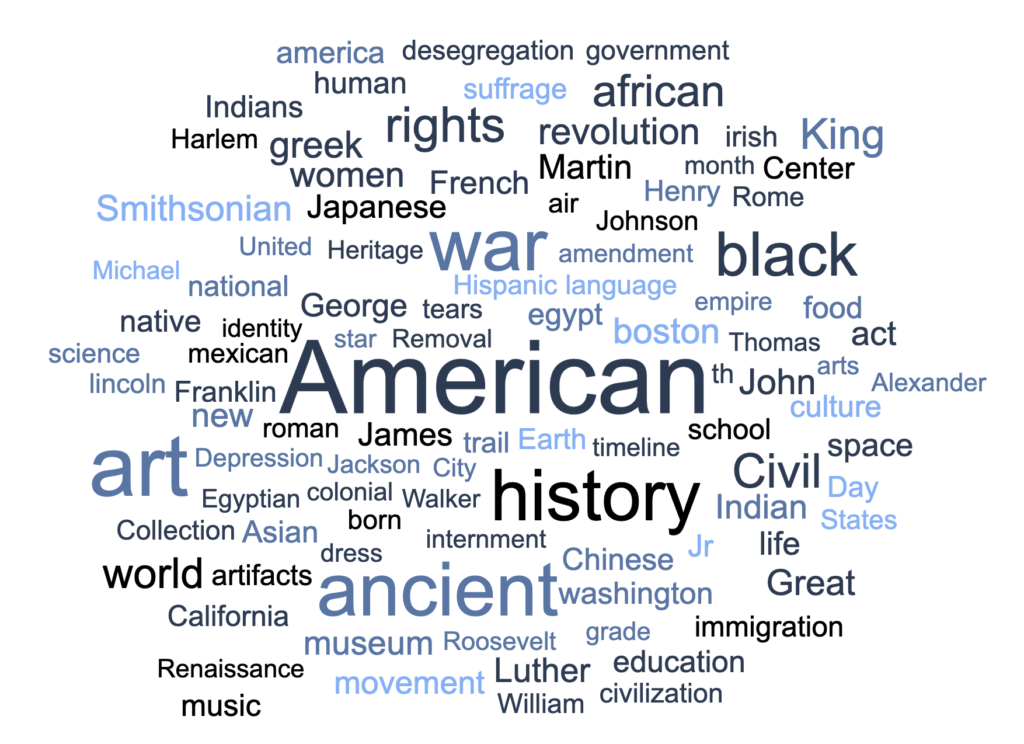
Finding 2: Words related to social studies and art topics are the most frequently searched. Top social studies terms include those connected to America, ancient civilizations, African Americans, and civil rights issues.
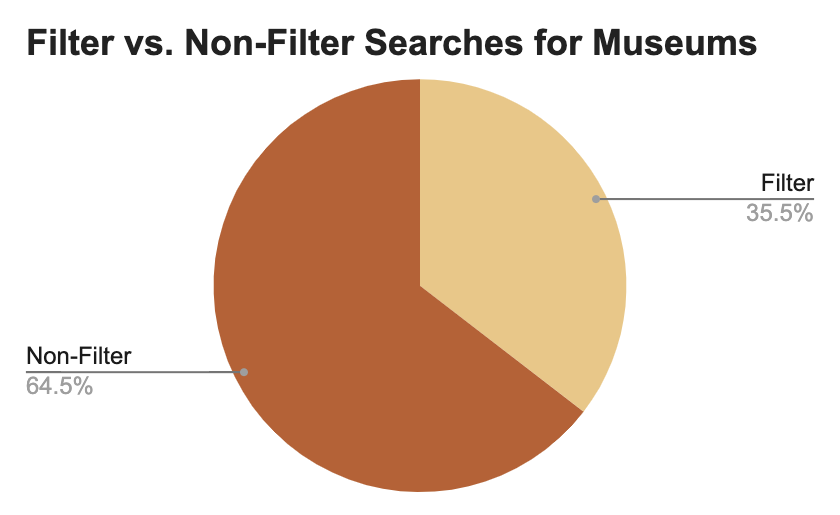
Finding 3: More users are hand-typing museum names than using the Lab’s existing filters. This may be influenced by the fact that these filters are only available in a resource search – not a search for collections.
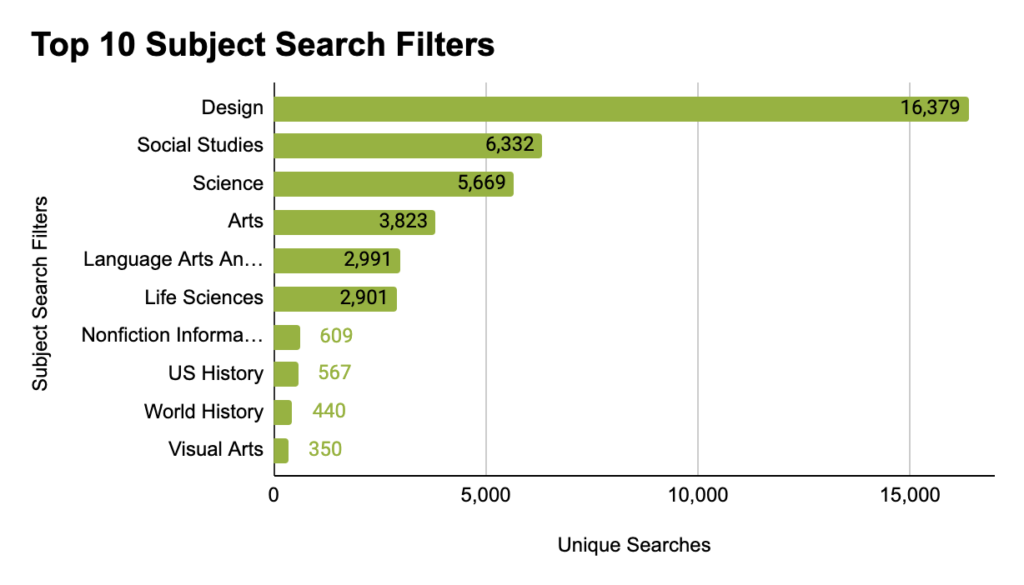
Finding 4: The most popular subject filter is Design. The popularity of the following filters – Social Studies, Science, Arts, and Language Arts, and English – may at least be partially attributed to them being highlighted and linked on the Lab’s home page.
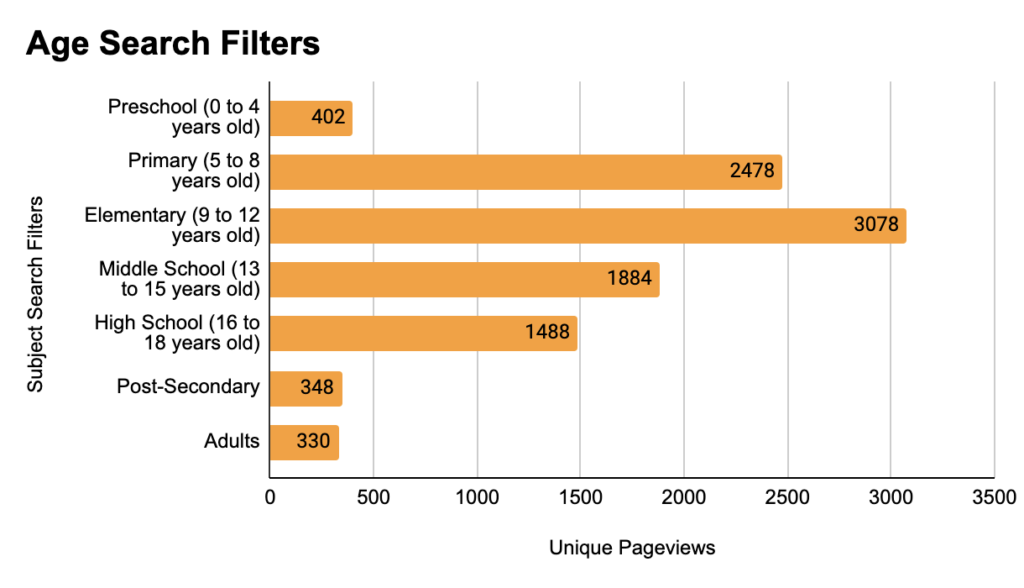
Finding 5: The most popular age level filter is Elementary, followed by Primary. The popularity of filters does not align with the total amount of collections available in the Lab.
Recommendations
Recommendation 1: Build a controlled vocabulary into the Keywords tool based on the most common search terms. This tool is currently an unrestricted text input field, and this change will increase the recall and precision rates of collection searches by regulating the terms used to tag collections, ensuring that collections are tagged with the most common words users search with, prevent tagging typos, and provide collection-creators with a starting place to brainstorm keywords.
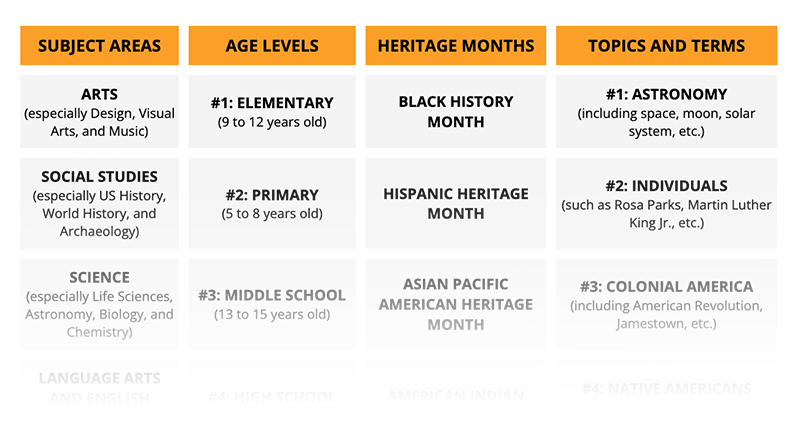
Recommendation 2: Develop a call for content from Smithsonian educators based on findings on search result accuracy and top search terms, categories, words, and filters to enable the creation of new educational resources based on user needs. A preview of preliminary focus areas, based on findings from this report’s analysis, are displayed above, while a full table is included in the evaluation report.
Recommendation 3: Make users and groups marked as white-listed in the Lab’s administrative back-end searchable in the Lab to support users looking for collections by searching for the museum or user’s name. The previously recommended controlled vocabulary may support this solution; consider pre-populating the keyword fields in collections published by white-listed users or groups with their name.
Conclusion
We met with OET leadership in a final meeting to present our key recommendations and findings, deliver the full analytics report, and share the final Google Data Studio dashboard we developed to continuously track search analytics data on a quarterly basis.
Client feedback
After our presentation, we met with our client to discuss our findings in detail. Overall, OET leadership was very pleased with the report and greatly appreciated the actionable nature of our recommendations. As a member of OET, I can say that we are seriously reflecting on findings and considering recommendation implementation, and we plan to have our first internal presentation of the report and discussion of next steps in late May.
key takeaways
![]()
A team with diverse background experiences is a major asset.
Our team came into the project with incredibly varied backgrounds and interests, ranging from writing, database development, graphic design, search platform development, user experience design, anthropology, and museum education. Being able to learn from each other’s diverse experiences as we discussed findings and brainstormed potential solutions made our recommendations much stronger than they would have been if we developed them with a more homogenous team.
![]()
Don’t be afraid to recommend drastic changes.
As a member of the OET team, fresh perspectives shake things up for staff who have been working on the same platform for years. As long as drastic recommendations are based on findings from thoughtful data analysis, they always help push a team to look at their platform differently.