Objective

Our goal was to provide better insight on ways to ensure that audiences have a seamless experience with The Andy Warhol Museum’s website by analyzing Google Analytics and answering the following questions:
- How is the navigation that was restructured (June 2021) performing?
- How does the behavior of local vs. non-local audiences compare since the museum’s strategy shift made during Covid-19?
- What content are the local audiences looking at?
Recommendations
- Adopt a mobile-first design approach
- Increase visibility & functionality of site search
- Present events upfront
- Track events on Google Analytics
- Invest in Google Adword campaigns more than Paid social media campaigns
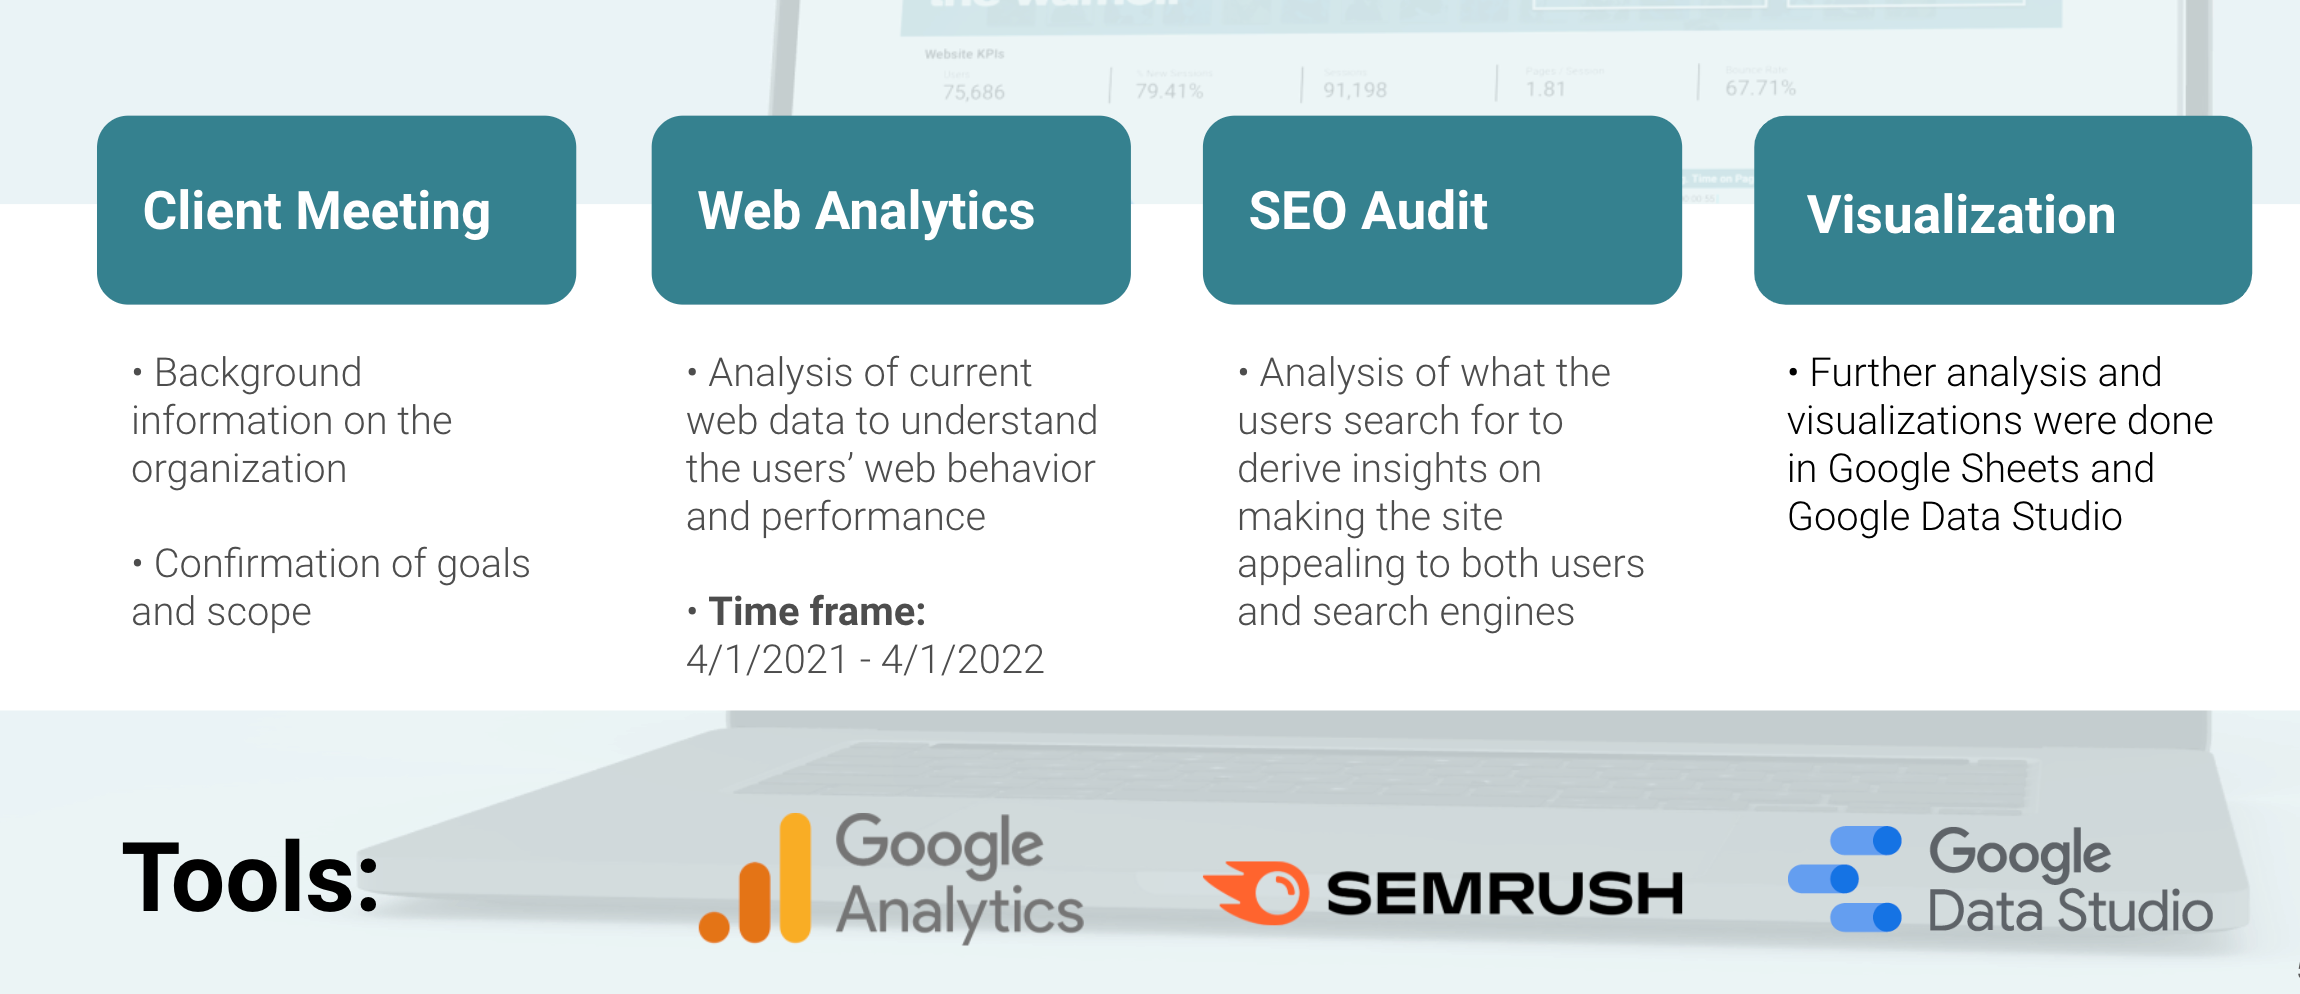
Methodology
Findings + Recommendations
Finding 1: Local audiences predominantly use mobile devices to access the website but spend more time on the website on desktop
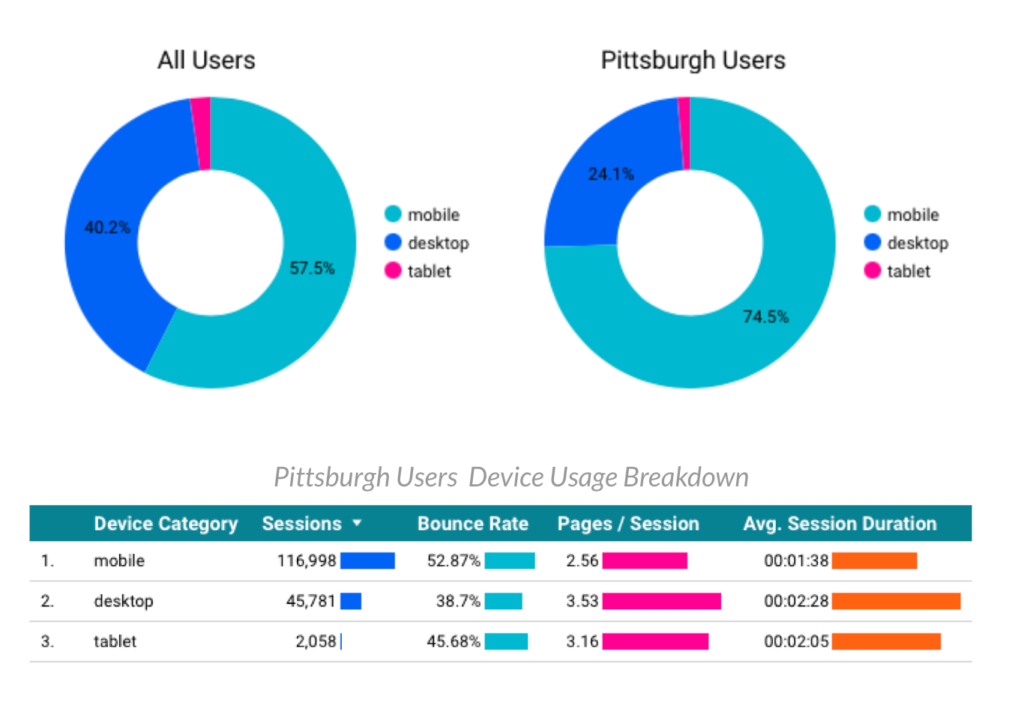
The majority of all users access the Warhol website on a mobile device, and users from the Pittsburgh area primarily use their mobile devices to view the website. In fact, 74.5% of Pittsburgh users accessed the website using mobile phones, compared to 24.1% who navigated to the website on desktop. while mobile devices are very popular, Pittsburgh users tend to spend more time on the website while using a desktop. The bounce rate, or the percentage of users who open a page on the site and then exit, is lower for desktop than for mobile.
Recommendation 1: Adopt a mobile-first design approach
Since mobile users account for the majority of all users, both local and non-local, adopting a mobile-first approach would be a good way to cater to that audience. The findings show that while using a mobile device is the most popular option for accessing the website, the pages per session users view and the average session duration are all lower than that of a desktop, whereas the bounce rate for mobile is also higher.
Finding 2: The updated navigation is a promising start, although some modifications can be made
Analyzing the user path from the homepage, before and after the navigation bar redesign, revealed that more people were interacting with the website after the redesign implementation. There was an increase in the number of entrances (+2.03%) and a decrease (-1.14%) in the number of exits from the homepage. When segmenting this information between local vs non-local audiences, the analytics showed that locals had a lower exit rate from the homepage (38.12%) compared to non-local audiences (43.71%). Locals were more likely to continue navigating the website compared to non-locals, and both audiences had the same page paths from the homepage, with most visiting “Admission.”
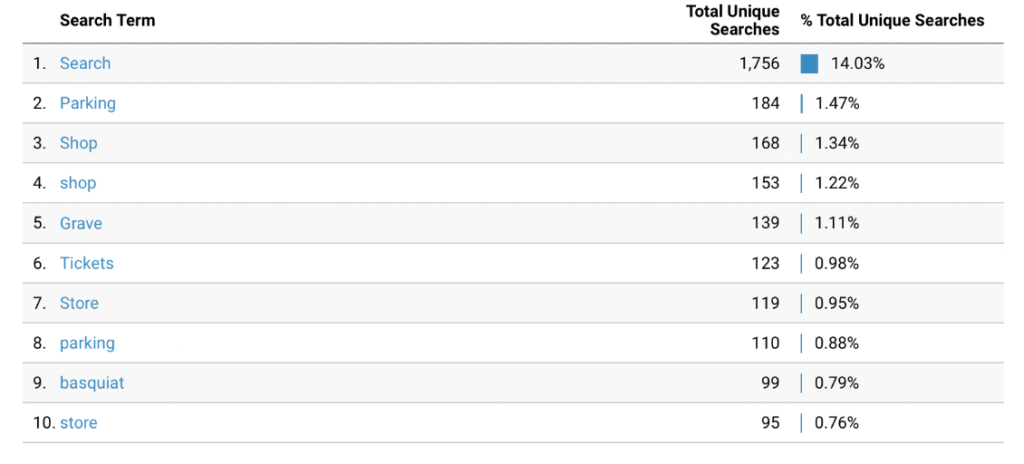
The Andy Warhol Museum currently has a search icon in its main navigation bar that allows users to search throughout the site. According to Google Analytics, only 1.03% of users used site search within the time frame in this report. This percentage is deficient because 98.97% of users did not use site search. The most searched term was “Search” (18.43%), and the second most searched term was “Shop” (2.41%). “Search” being the top searched term is part of a usability issue where users are double-clicking on the search icon and then prompted to a “results for search” page.
Recommendation 2: Increase Visibility & Functionality of Site Search
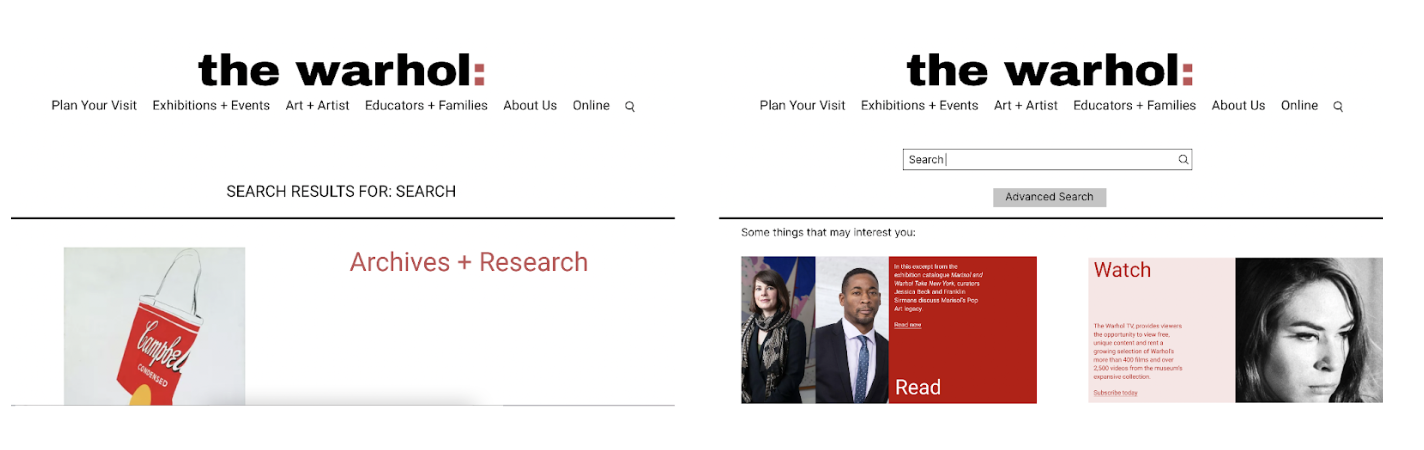
A search tool usability issue was identified; users are double-clicking on the search icon and then prompted to a “results for search” page. Instead of the landing page being “results for search,” we propose including a more extensive and detailed search bar on the landing page while including examples of information users can search for and/or links to content pages that will interest the users.
Finding 3: Local audiences check the Calendar for upcoming events more than non-local audiences
These local audiences from Pittsburgh were found to check the calendar for upcoming events and not visit Andy Warhol’s Life page more than the non-Pittsburg user (Figure 3C). This was likely due to the locals being more familiar with Andy Warhol, and more inclined to attend special events rather than relearning about the artist. It is also assumed that local visitors are more willing to find and attend events happening on the day of since they live close to the museum compared to non-local visitors.
Recommendation 3: Present upcoming events upfront
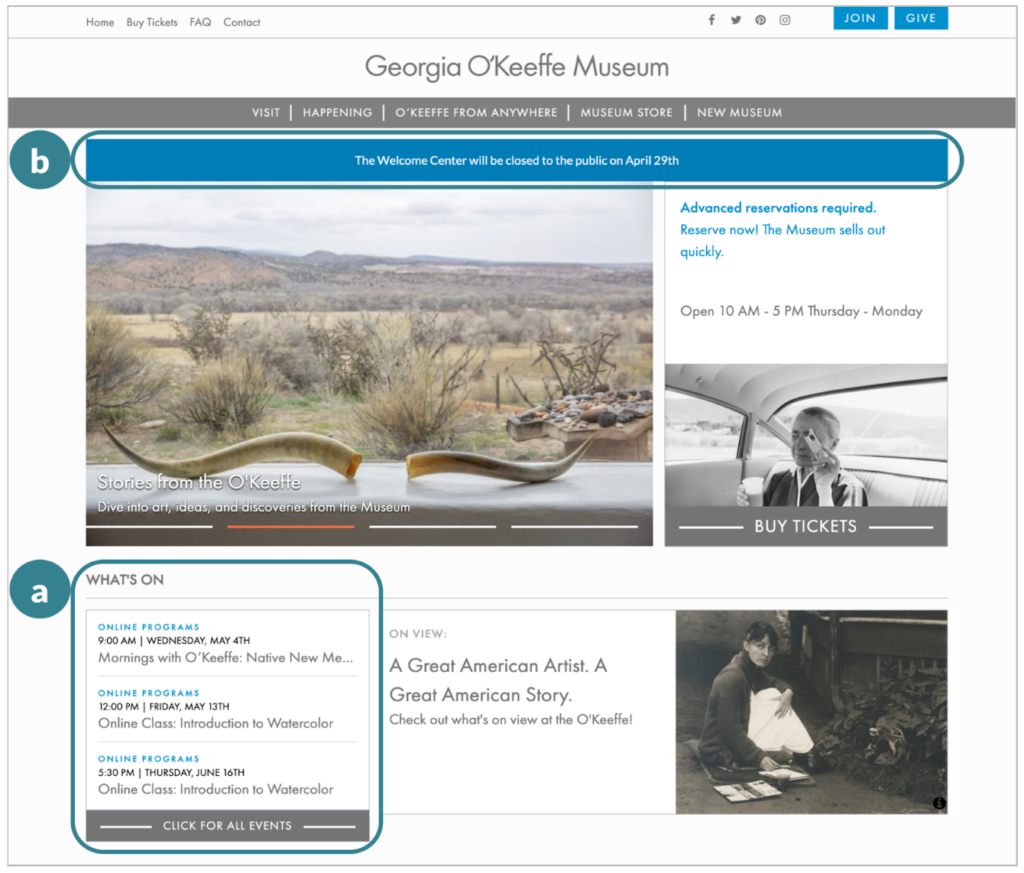
The calendar information can be presented upfront on the homepage to promptly address the needs of the local audience. Currently, the website requires the user to click at least two times from the homepage to view the calendar of events. A popular way to showcase the information or link to events on the homepage is to make a “What’s On” section. The Georgia O’Keeffe Museum website’s homepage for example, lists the community programs and events happening on that day or within the month in their “What’s On” section and has a designated section at the top of the page to post any urgent news or updates
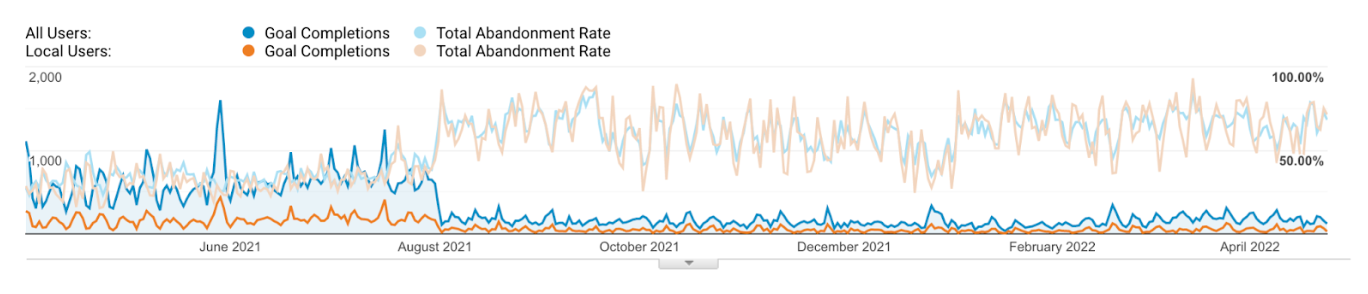
Finding 4: The lack of event tracking is a missed opportunity to gather insightful behavioral data and enhance keyword strategy
Since August 2021 there has been a decline in goal conversions and an increase in abandonment rates. User behavior can provide insight into why this is happening BUT events are not currently being tracked on the legacy account AND this is a missed opportunity to better understand what is going on.
Event tracking is a powerful Google Analytics tool that allows one to count or measure micro-interactions that don’t necessarily involve loading another page from the site. For example, an event can be the press of a button, the download of a file, the playing of a video, or even the scroll depth on a page. In other words, event tracking can provide insights into how users are completing certain goals.
Recommendation 4:
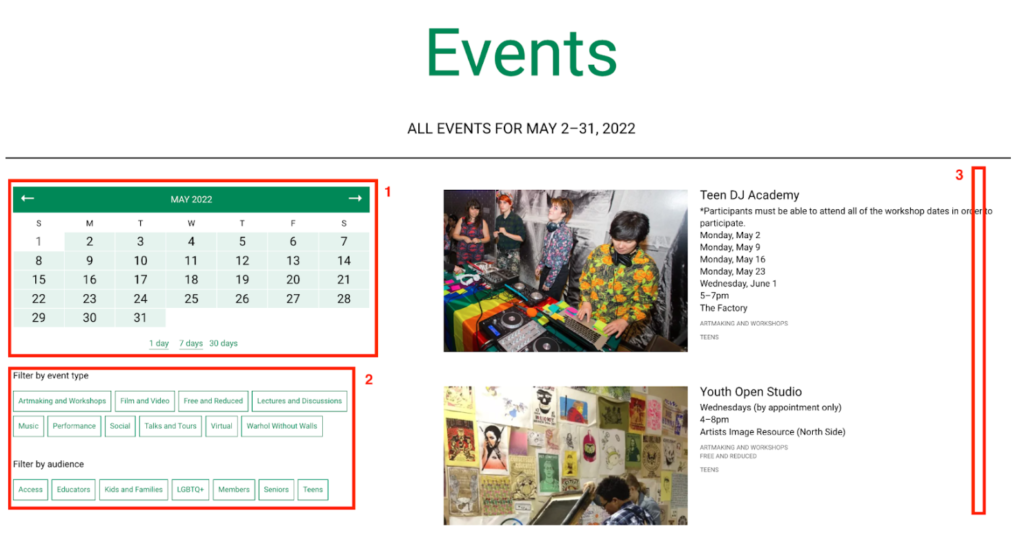
There is currently a goal set up on the legacy account that tracks how many users register for an event at the museum. With event tracking, the museum would be able to track micro-interactions that occur before users even register. Buttons, links, or images that users interacted with prior to completing a registration goal could be tracked. For example, understanding how users filter events by calendar date, by event type, or by audience type can provide insight into what is popular amongst the users and how they prefer to filter the events listed. Tracking the scroll depth of the Events landing page can also provide insight to understanding how the users behave and interact with the events list – are they scrolling to the bottom of the page and viewing all of the available events? If not, down to where is the average user scrolling?
Finding 5: Referral traffic behaved better than paid social traffic
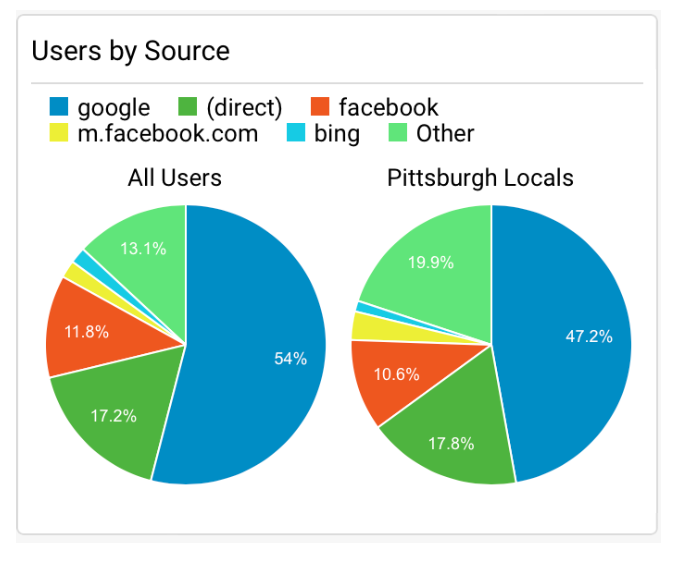
According to the Google Analytics source data, the top 3 sources that bring users to the website are Google organic search, directly typing in the URL, and Facebook. We derived from the data in the research period and dashboard we found an abnormal bounce rate through Facebook, with 11.8% user traffic from all users and 10.6% from local users.
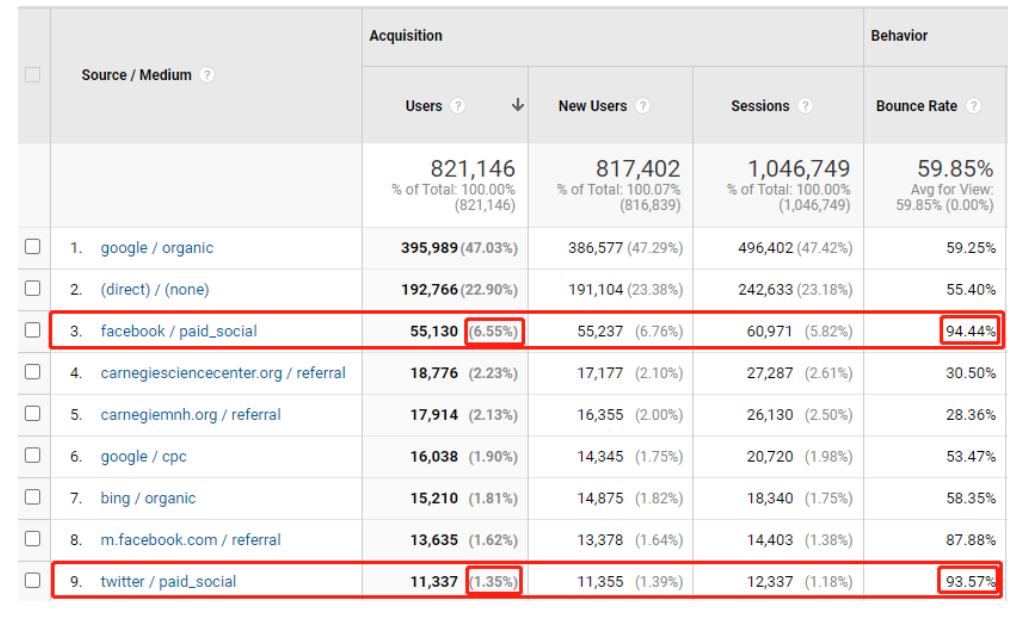
we see that paid_social overall occupies 8.14% of the users and 8.35% of the new users, which states that the whole categories rank as the fourth of the whole traffic medium. However, with an average bounce rate of 49% for the whole site, the paid advertisements under Facebook had a 92.91% local bounce rate and 94.4% bounce rate among all users. Twitter paid ads act almost the same with a relatively low ranking of incoming traffic, but still with a 93.6% bounce rate for all users.
Recommendation 5: Invest in Google Adword campaigns more than Paid social media campaigns
Warhol’s most engaged users come from Google, whether they directly searched or were referred to by Google pages. We recommend reevaluating the investment portion between paid Google ads and paid social media ads. With Google’s Smart Goals tool, Warhol’s Google Adwords campaigns would be automated to promote popular landing pages – eliminating the time and effort it takes to create, publish, and update campaigns.
Reflection
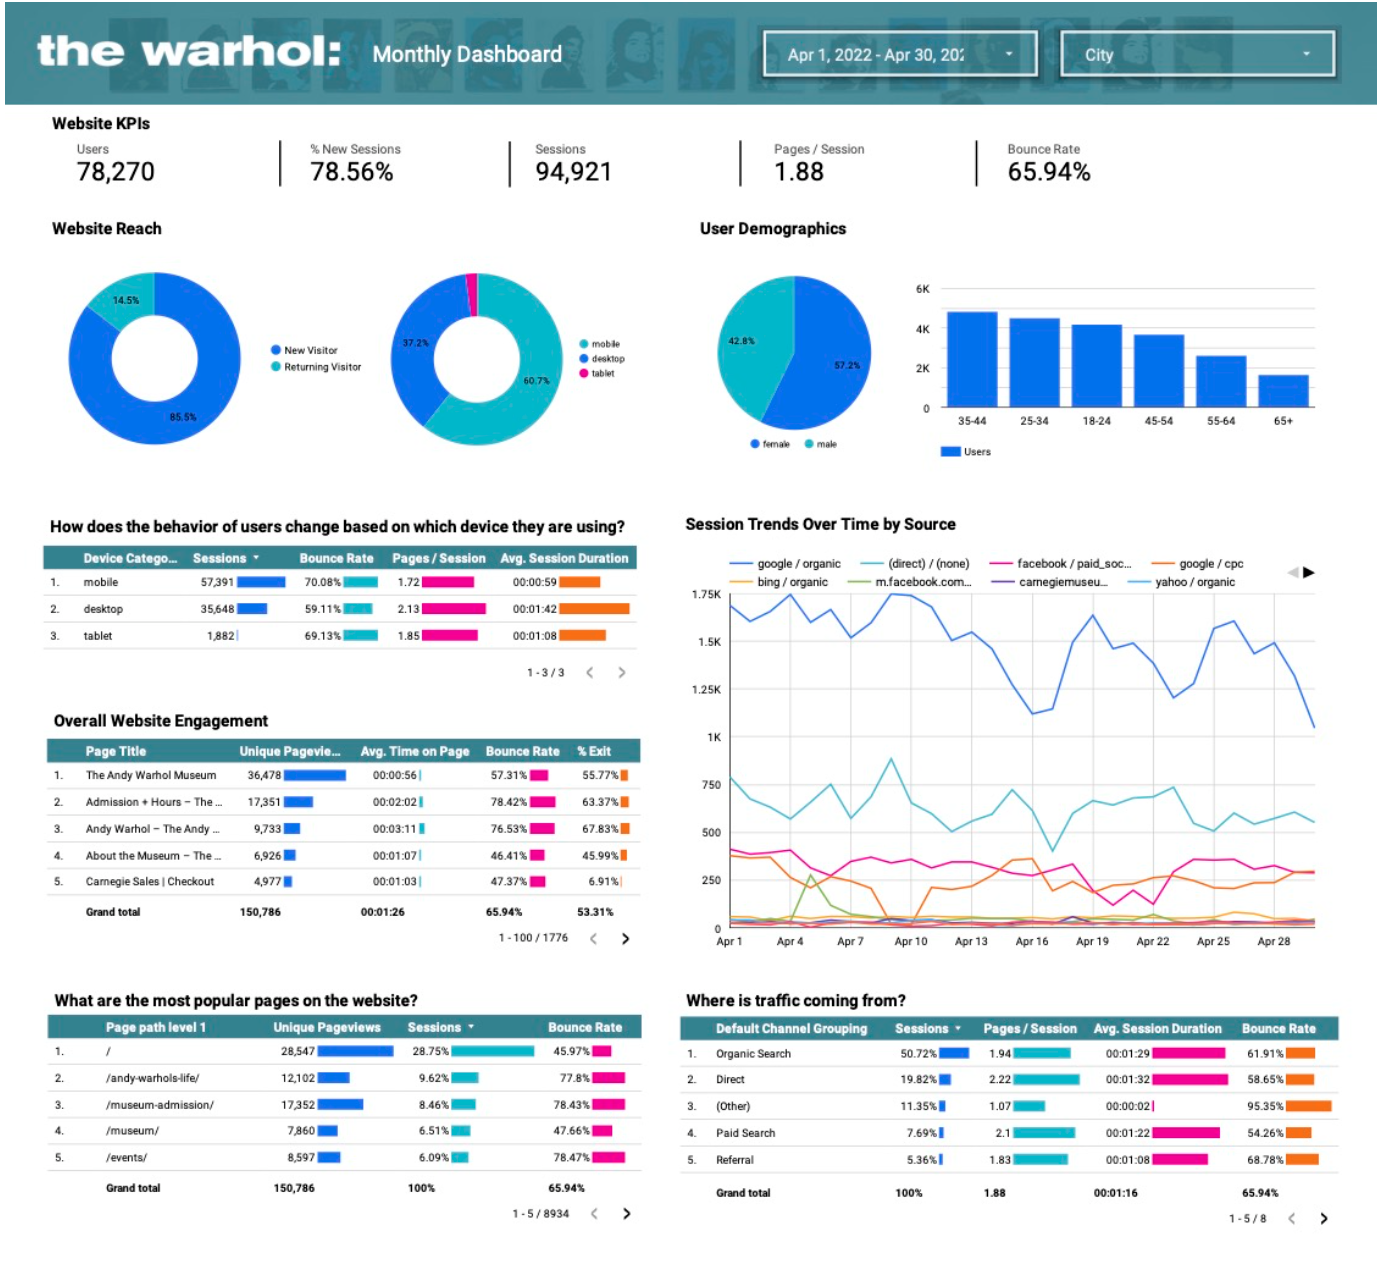
The analysis revealed insights specific to where traffic is coming from, which devices are being used to access the website, navigation system considerations, how users are interacting with the website, and Google Analytics capture practices. In addition, the analysis provided areas of further improvement for each of the findings and resulted in a customized dashboard using Google Data Studio.
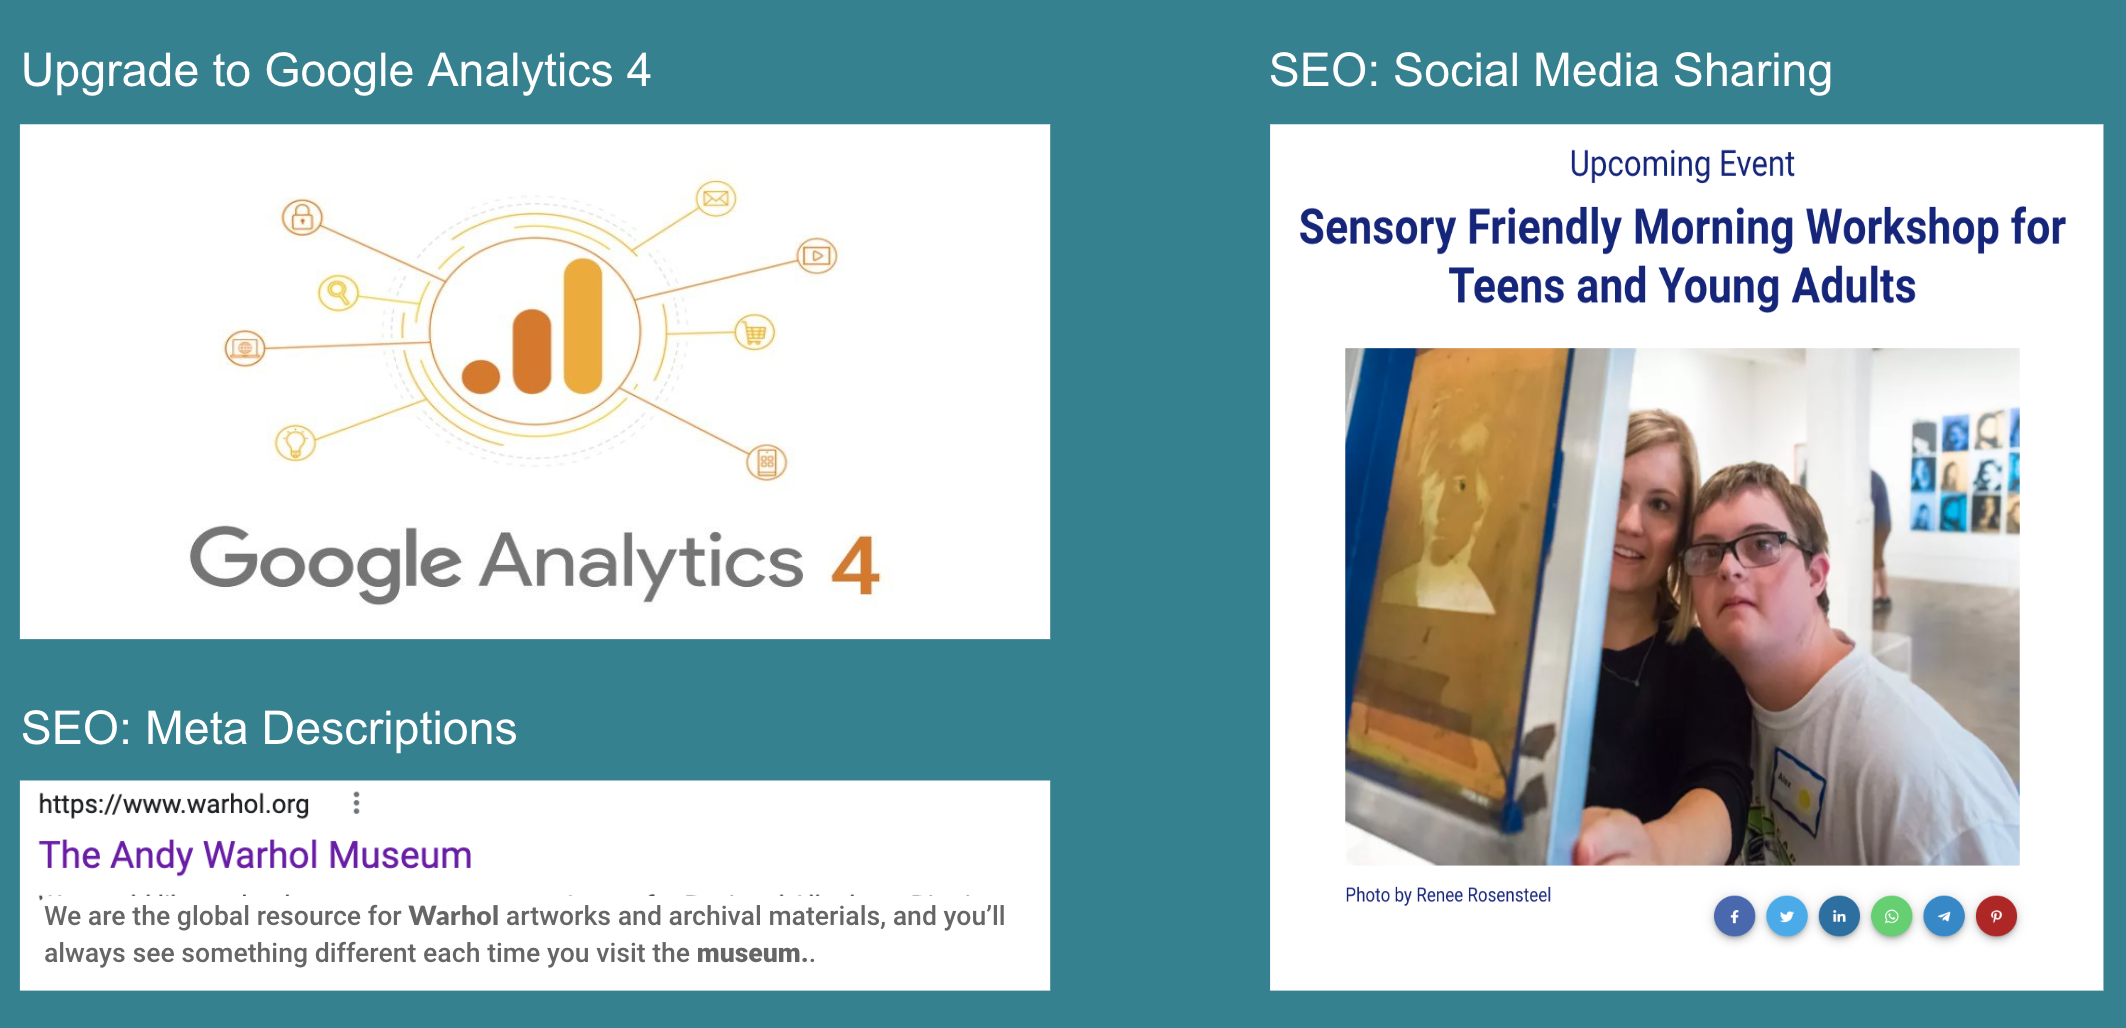
Another important next step would be for the Andy Warhol Museum to set up Google Analytics 4 in the near future, as Universal Analytics is retiring in July 2023. In addition, an SEO audit was conducted which revealed that the Andy Warhol Museum has above average SEO but would benefit from adding a meta description, as well as social media sharing options on key pages to create backlinks and promote the website’s content.
Implementing these changes would improve the overall website experience for local and non-local users, and help the Andy Warhol Museum utilize Google Analytics to its fullest extent.