As the City’s primary capital construction project manager, the Department of Design and Construction (DDC) builds many of the civic facilities New Yorkers use daily. They collaborate with other City agencies to design and improve the cities’ infrastructure. The DDC delivers roadway, sewer, and water main construction projects in all five boroughs, including sidewalks, street reconstruction, water mains, sewers, and pedestrian ramps.
This Ethnographic UX research project for the DDC explores the methods of providing up-to-date information about the City’s ongoing subsurface construction projects to NYC residents and visitors. In the context of UX design, ethnography is sometimes referred to as digital anthropology, field research, or contextual inquiry. Ethnographic UX research reveals user insights by allowing you to observe users in the context of their real-life technical and social environments.
Why is this ethnographic research important for the NYC DDC?
- There is residual frustration with construction sites as they have been disruptive for multiple years, and it “often seems like no one is on-site completing the work.” (The price of not having telephone poles, Tribeca Citizen, 2021) In reality, street excavations could be understood as a sign of a city doing its job-creating economic growth and improving the spaces we inhabit.
- The regular urban person encountering an open street excavation is rarely provided with the information to understand the complex network system that requires the streets to be disrupted.
My Teams
For our initial phase of research I was a member of the team that observed and interviewed community members at York Street in Manhattan including Ariella Brown, Akshata Karekar, Anamika Menon, Sagarika Konanru and Jun Kok. For the second phase of research I worked with Sagarika Konanru and Sharon Tao. My role was equal with the team of UX research through our chosen ethnographic methods. I observed the sites, interviewed community members, designed diary studies and workshops and presented research findings to the client over the course of the project.
Our Research Goals
After we met with the DDC and reviewed the documents the client provided, we synthesized our Research questions to:
Goal 1 ↗
Understand the public’s expectations from the DDC and current pain points and misconceptions. Identifying the public’s frustrations about the construction work and what they dislike about the current situation.
Goal 2 ↗
Find opportunities for meaningful engagement with the public.
Goal 3 ↗
Finally, to gain insights into points of interaction that the DDC could communicate with the public and communities of New York City.
How did we approach our research goals?
research methods
We utilized multiple research methods to verify the data we collected and deepen our knowledge of the subject. Each technique we used allowed us to build on our insights. We used four research methods, including:
1. Field Observations
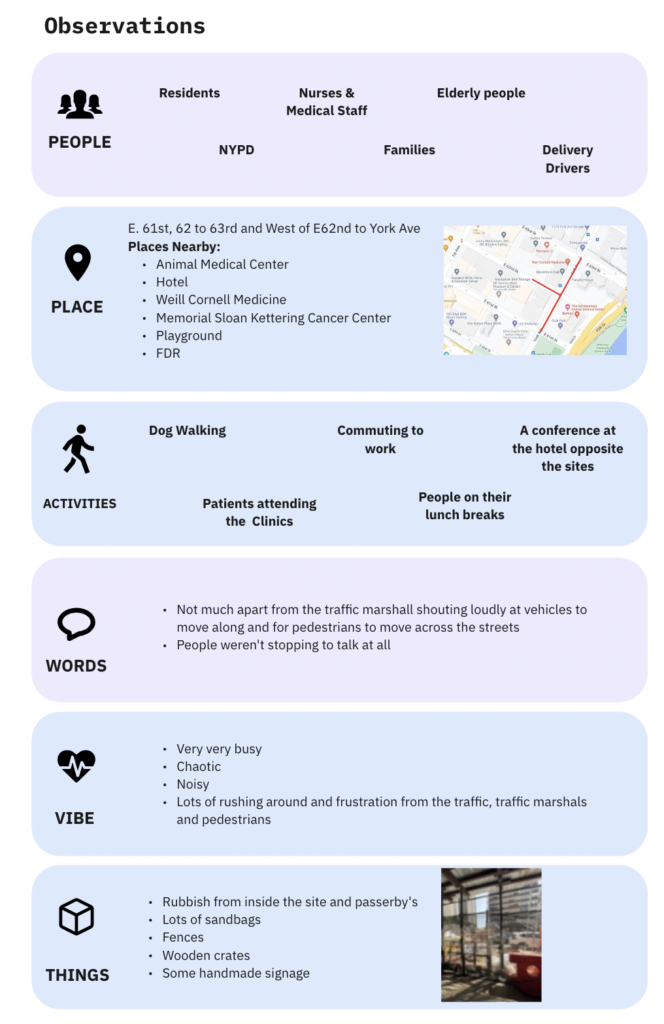
We visited the construction sites on multiple occasions that the DDC identified. We observed the location, community, and site using an observational framework. This framework took into account the people, place, activities happening, words overheard, the vibe and things around the space. It was a great chance to understand how the community interacts with and around the sites.
Why this method?
We chose to observe and then converse in an attempt to understand a combination of:
– what they do
– what they say
– what they express.
By speaking with the participants on site, we could further understand their backing for why they behave in a certain way.
2. Conversations & interviews
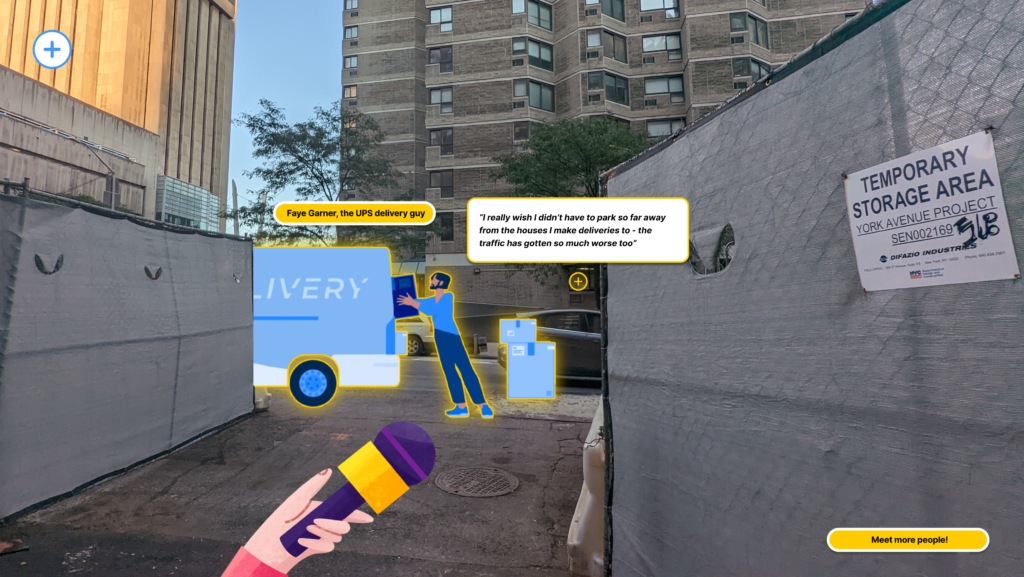
We returned to our sites on a different day and interviewed passersby, local employees, and neighbors about the sites. We also spoke with the Community Board Leader, who helps to communicate anything that arises in the area to the locality. All of our findings from the York Street Observations and Interviews were synthesized through a Figma prototype of the site, which you can view here. We presented the findings through an interactive cross-section map, including our observations of the space and key stakeholders. The area provides a critical view of our onsite activities.
Why this method?
Interviewing after observing allowed us to understand a variety of specific frustrations and queries arising with the community. The conversations also educated us about how information flows around the community.
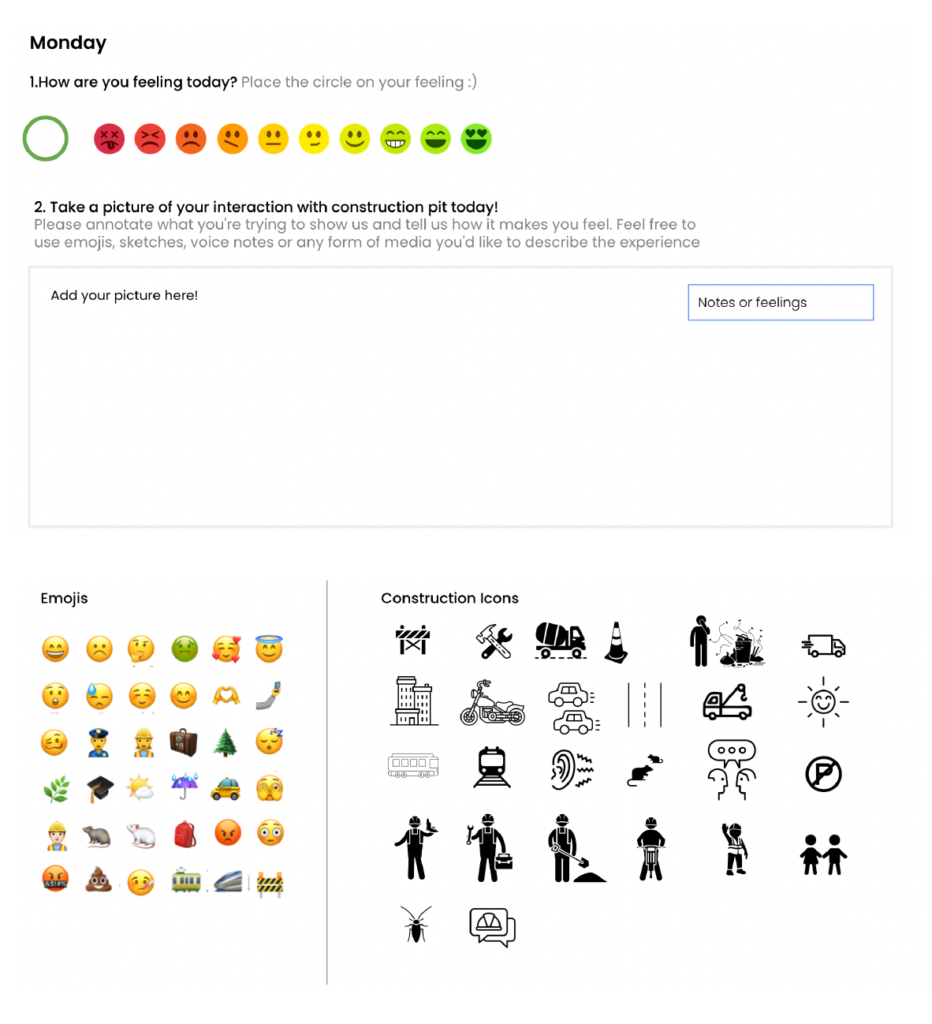
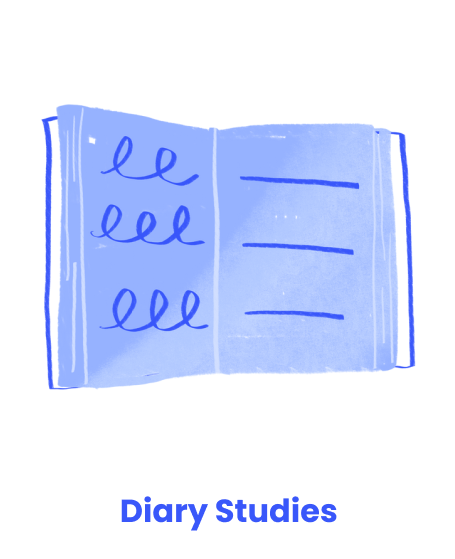
3.Diary Studies
A Diary study—is a longitudinal (running over a period of time) UX research method used to collect qualitative data, through participants keeping a diary to record their thoughts, feelings, and behavior, while they use a product.
We designed a workbook on google slides and invited 3 participants to fill in 5 days of their week.
We included:
- Emotion mapping to gather their mood
- Reflective prompt to ‘show and tell’
- Projective prompt to think in an ideal affect mentality
Why this method?
We chose this ethnographic method as diary studies take place over time and offer insight into people’s day-to-day lives. The data we collected was researcher-prompted and user-generated, providing space for the community to show us their experience in their own words.
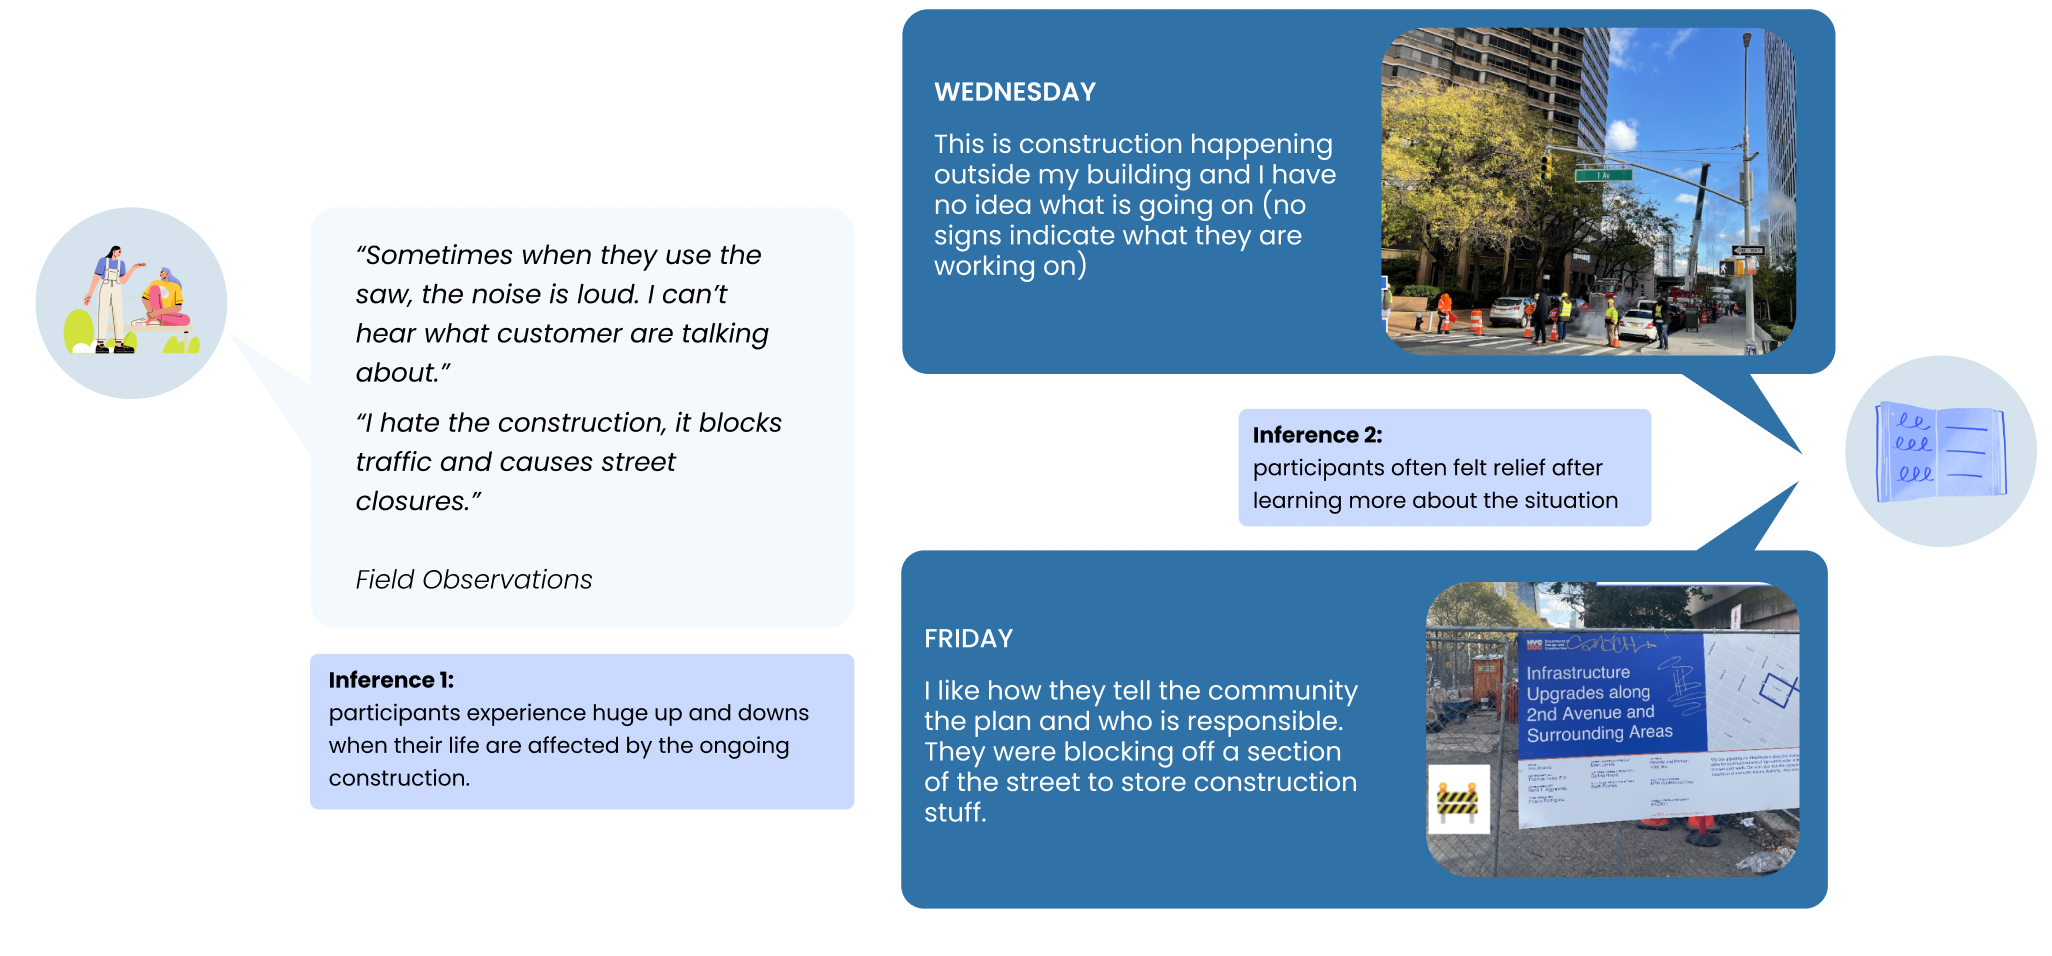
Example of a day from our Diary Study
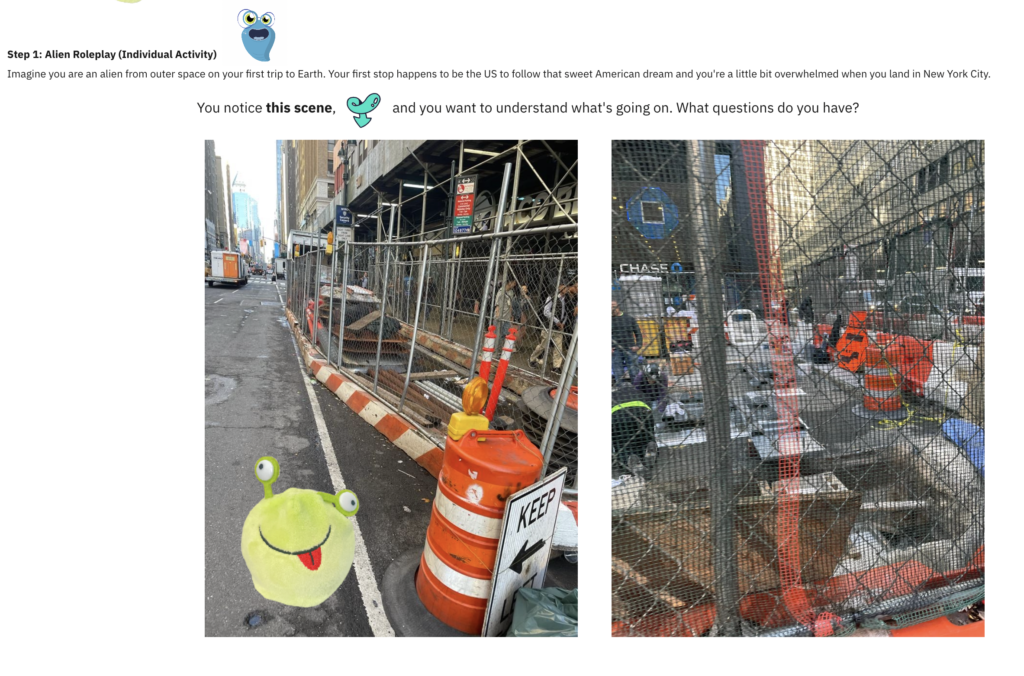
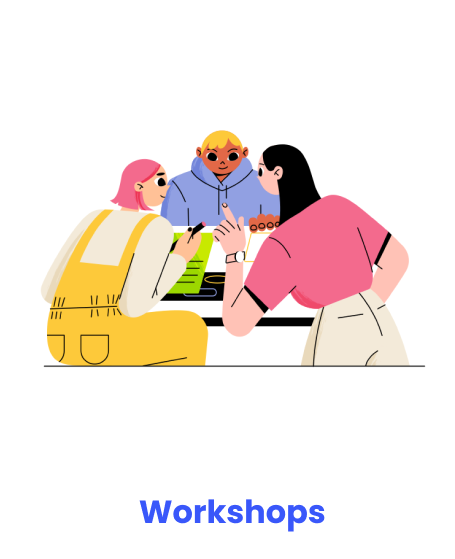
4.Co Design Workshops
We designed and hosted a Co-Design workshop to build on our insight into communication and understanding. Co-design workshops are a space for creative collaboration rooted in participatory and user-centered design. The workshops aim to involve stakeholders in the early phases of the design process.
Our workshop placed the participants as Aliens who had arrived in Manhattan. We prompted the participants to stand in the Alien’s position, listing as many of their questions about the construction site. We flipped the script and asked the participants to be passersby who stopped to help the Alien. The questions they previously asked now had to be answered.
Why this method?
Co-design workshops allow the stakeholder and participants to think freely and more playfully about the design process, problem solving and research. Fresh approaches to problem solving can arise when different prompts and perspectives are added.
Identifying common themes across our methods
Bottom up Analysis
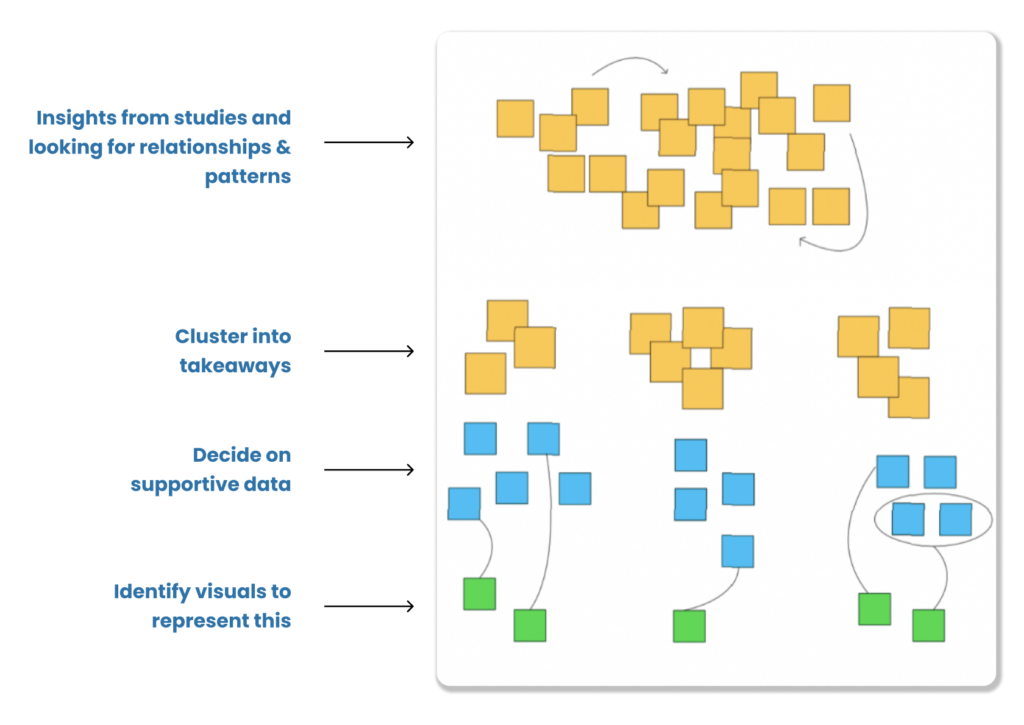
A bottom-up analysis starts by looking at the data, then clustering by themes, and then identifying patterns or relationships. This can be considered open coding. We analyzed each research method’s data and built upon our findings.
Our Insights & Recommendations

Key Insight 1
People tend to be annoyed or feel irritated when the construction affects their lives; but when they understand the situation better, they’re relieved.
2/3 participants were more tolerant of the project once they understood the goals of the construction (through signage or conversation) and how that would affect their life.
Where did we see this?
First Recommendation
Show you care about people’s emotional needs, make the situation clearer to them to relieve their irritation and annoyance
- Example: Making the signage bigger and obvious especially during late afternoon and night; A notification on their mobile device when they’re around the construction site or third party integration to apps like Citizen.
Key Insight 2
People don’t want to be educated, but they want to be aware.
3/3 of our diary participants often expressed their need for information ahead of time – so that they can plan their day and schedule accordingly (in terms of service disruptions, noise, and accessibilities), but do not show interest in learning about the project that they believe doesn’t impact their day-to-day life.
Where did we see this?
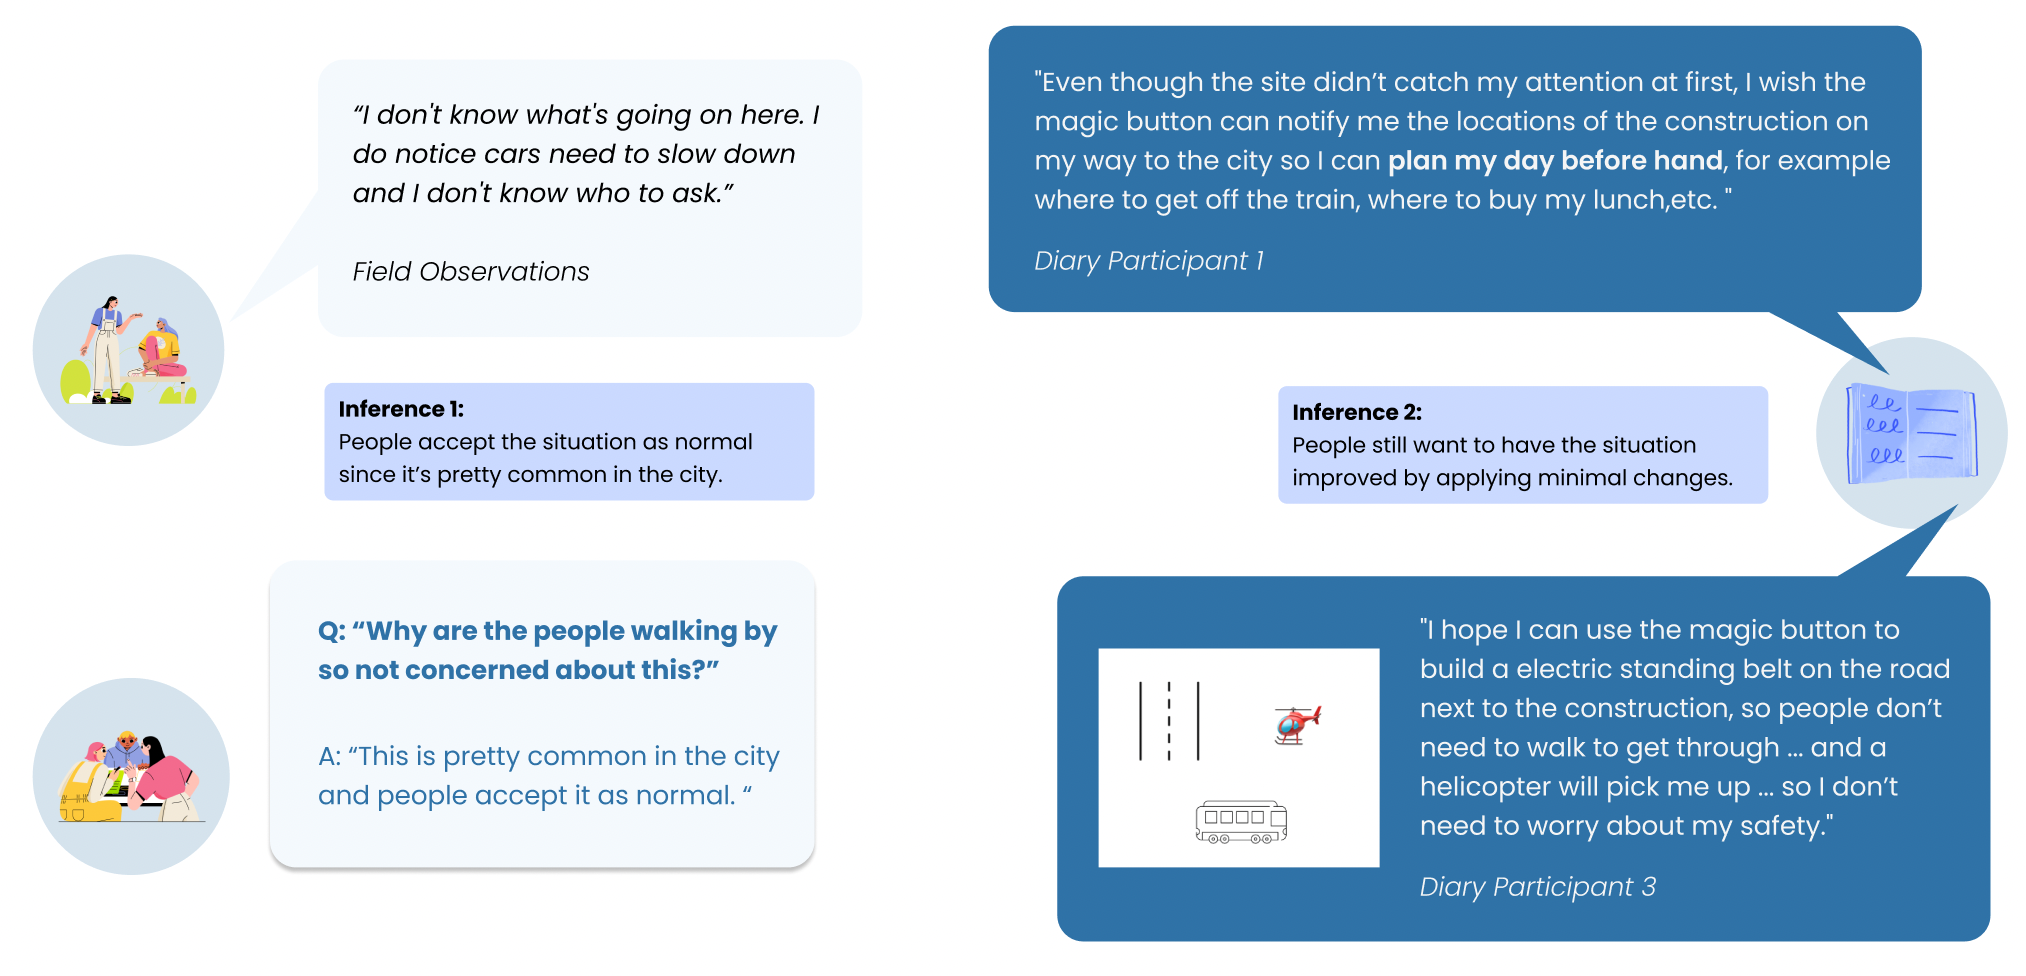
Second Recommendation
Do not educate them about the details of the construction site, but give them notifications or updates about live construction before-hand.
- Example: Utilizing map applications to provide notifications throughout journey planning and give more details to the user if they want to understand more.
Key Insight 3
People want feed-forward information, they don’t want to ‘look’ for it
3/3 Participants questioned the nature of the construction projects but never described any personal efforts to understand what was happening. Instead they described how they would like a visualization of when the project would end.
Where did we see this?
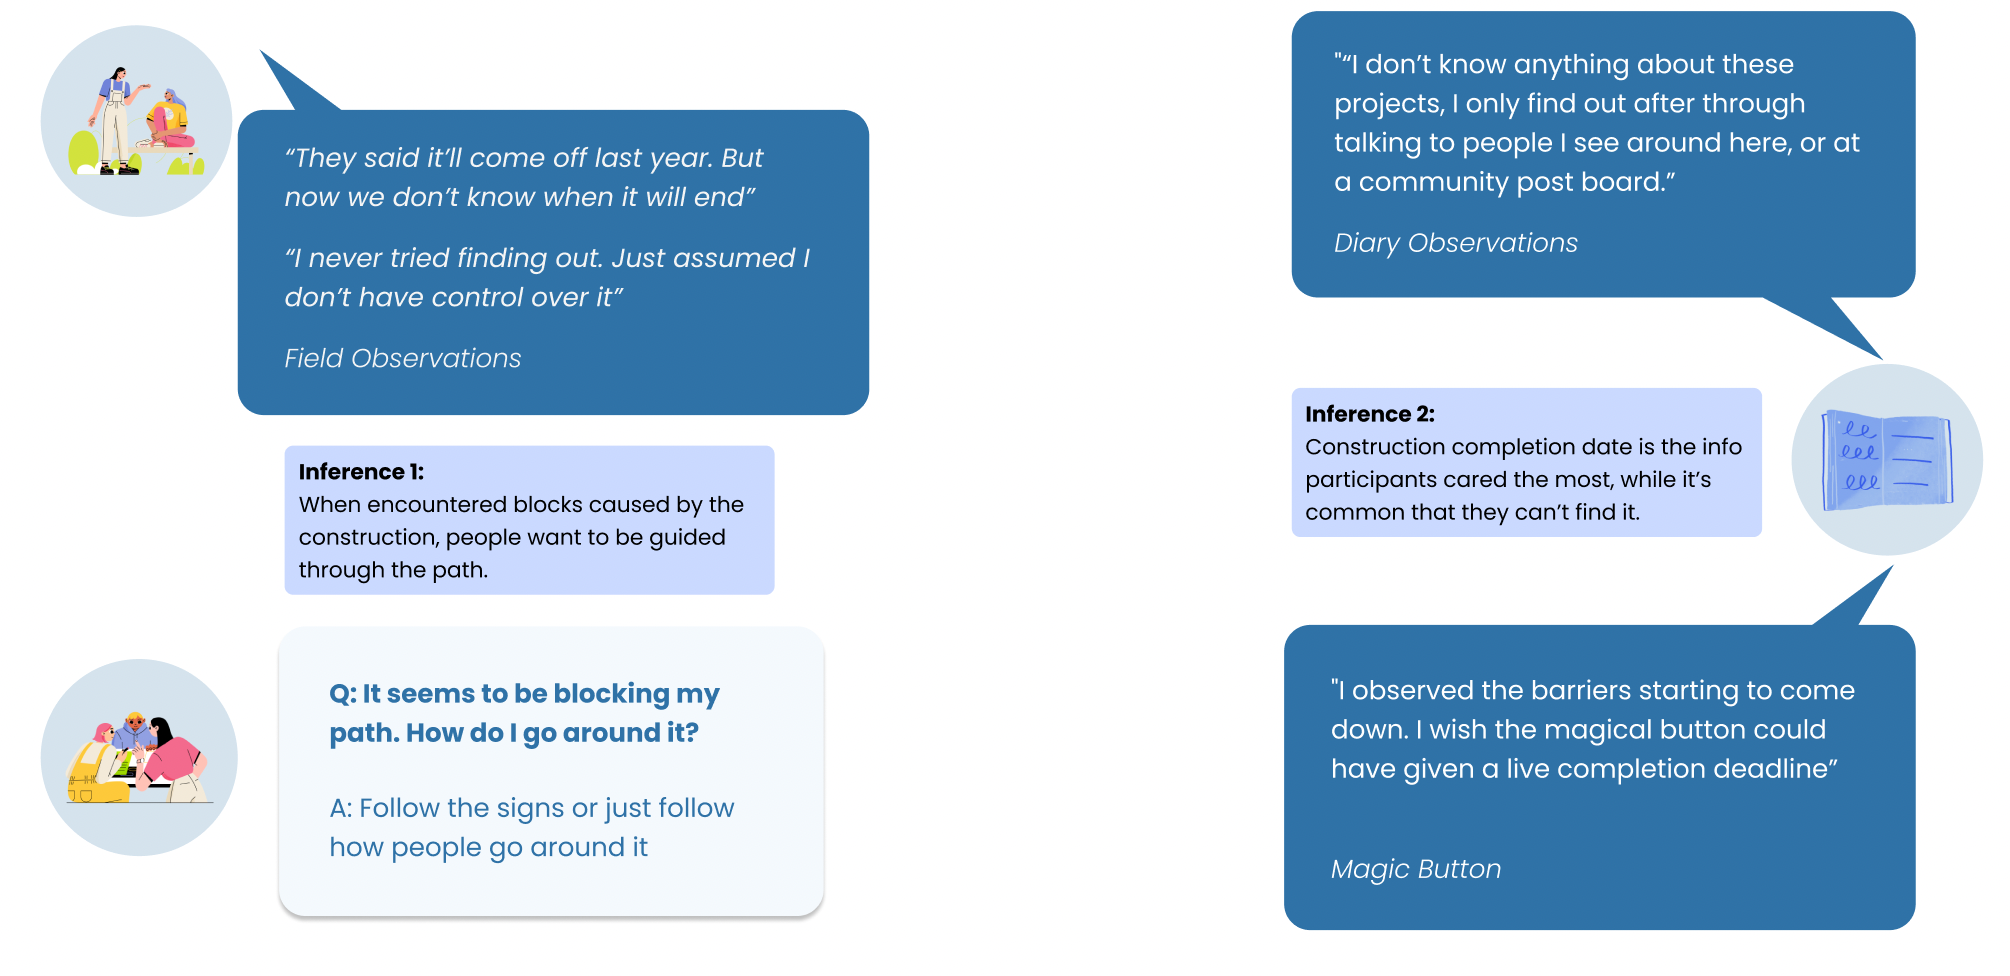
Third Recommendation
Provide a ‘big picture goal’ and the time schedule (yearly, monthly, daily) of the construction to people, including some reminders of what they could do to avoid the affects throughout.
- Example: Basic map overlay indicating traffic delays with the option to learn more about project and timeline details.
Conclusion & Next Steps
We utilized four research methods, including Observational frameworks, Interviews, Diary Studies, and Co-design workshops for the NYC Department of Design and Construction.
From our research, we found that the people of NYC:
- Tend to be annoyed when the construction affects their lives, but when they understand the situation better, they’re relieved.
- Want to be aware of what’s happening.
- Want to be told what’s happening and don’t want to look for the information.
To meet the communities expectations, the DDC could make three improvements through
- Making the construction situation clearer with improved signage or notifications on applications people in the community already use.
- Notify people digitally as they plan their travel during the day
- Provide projected completion signage with tips on dealing with the construction effects.
We presented our research process and findings to the New York City Department of Design and Construction in early December. We walked the client through our key recommendations and look forward to working with them to continue the design process. The Ethnographic research findings will now be passed onto the Spring 2023 Digital Product Design class and will inform their design process for the DDC.