
Project Background
We worked with Smithsonian Associates to analyze their Google Analytics data as they anticipate a full transition from Universal Analytics to Google Analytics later this year. The scope of this analysis includes customer demographics and behavior, acquisition through traffic channels, e-commerce data, and checkout behavior. This case study outlines our main findings and recommendations in these areas.
Approach
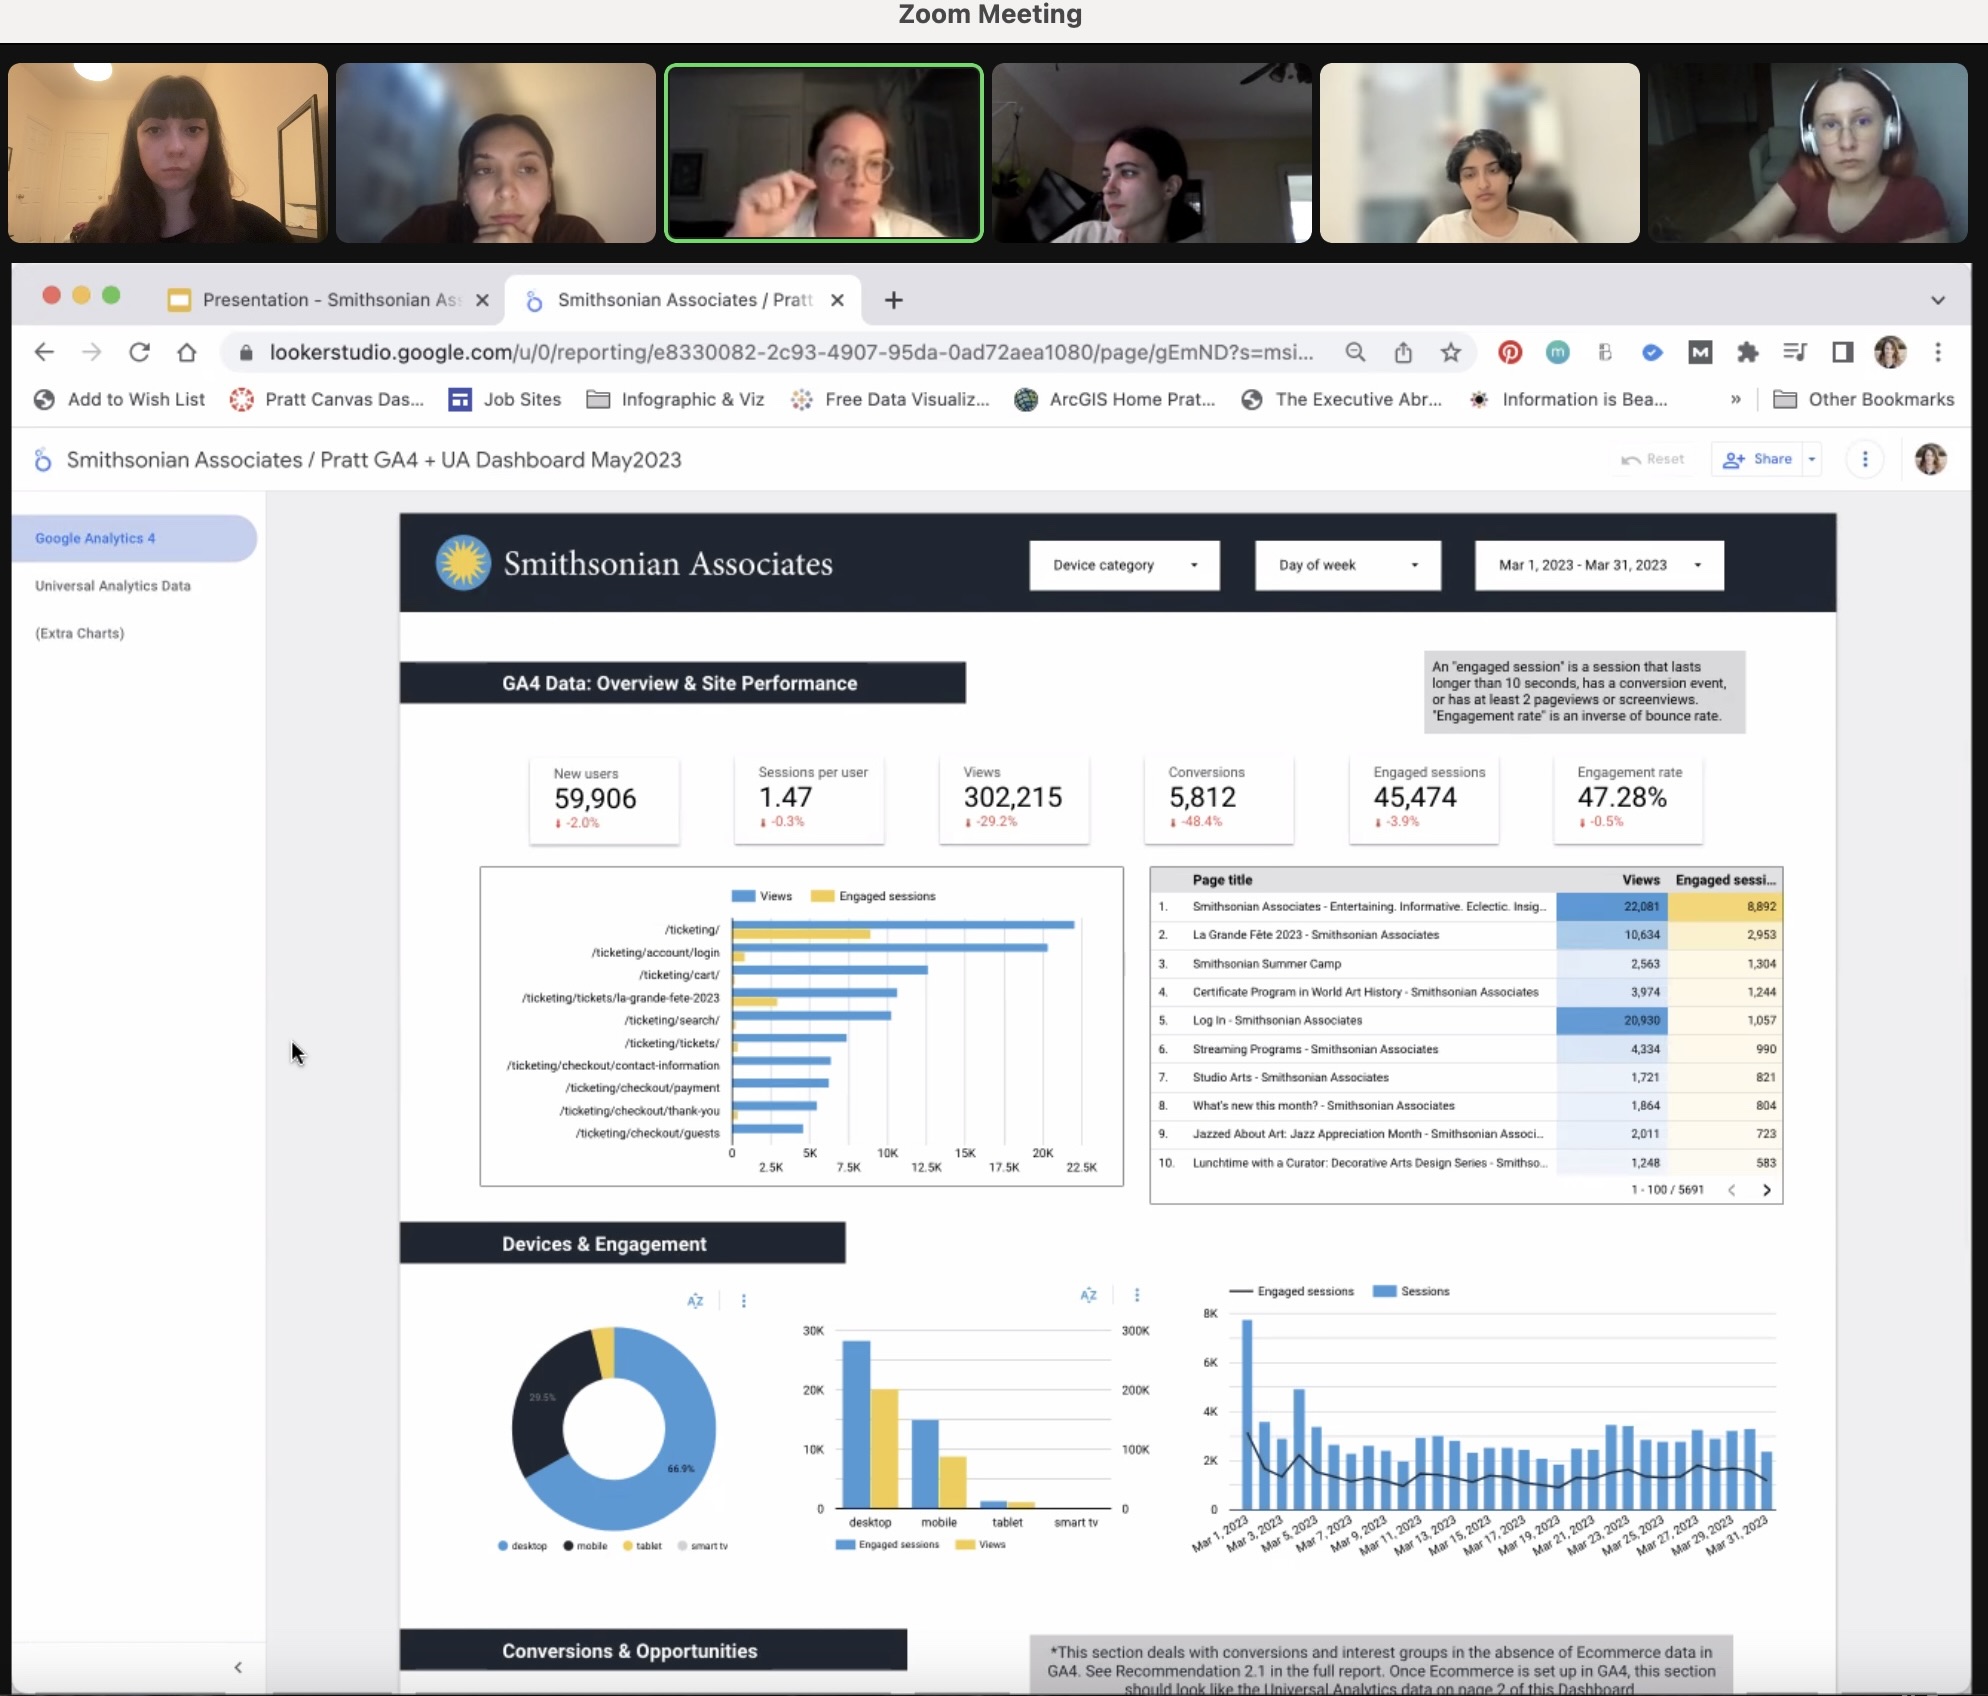
During our initial meeting with the client, we identified the main focus areas of our project: assess the popularity of various offerings, understand target audience demographics, and map user journeys of customers after arriving on the landing page. After receiving access to the client’s Google Analytics, we began to analyze the data and compile key findings. We utilized both Google Analytics and Google Looker Studio to visualize our findings, noting the limitations of visualizing e-commerce data from GA4 at this point, and also the differences in metrics between the two products (e.g., bounce rate vs. engaged sessions). After selecting our main KPIs, we created a dashboard that compiled insights from both Universal Analytics and GA4. We then wrote up our findings and recommendations into a report and created a related presentation for the client.
Client
Smithsonian Associates, the largest museum-based education program in the world, is a cultural organization that creates the educational programming used by the Smithsonian Institution. They provide a wide range of material, including lectures, performances, seminars, and studio art classes. With in-person and online offerings, Smithsonian Associates seeks to provide educational content and opportunities to an array of audiences.
Team
- Katherine DuVal
- Anna Feldman
- Brianna Casas
- Victoria Haber
- Medhaswi Paturu
My Role
- Interviewed client
- Analyzed client’s Google Analytics, with a particular focus on e-commerce data
- Helped conceptualize dashboard
- Contributed findings and recommendations to final report and presentation
Timeline
- 6 weeks
- March-May 2023
Key Findings and Recommendations
Section 1: Landing Page Experience
Finding 1.1: Pages that receive a high amount of traffic also show a strong correlation between slow load speeds and high bounce rates.
If pages take too long to load, users will abandon these pages.
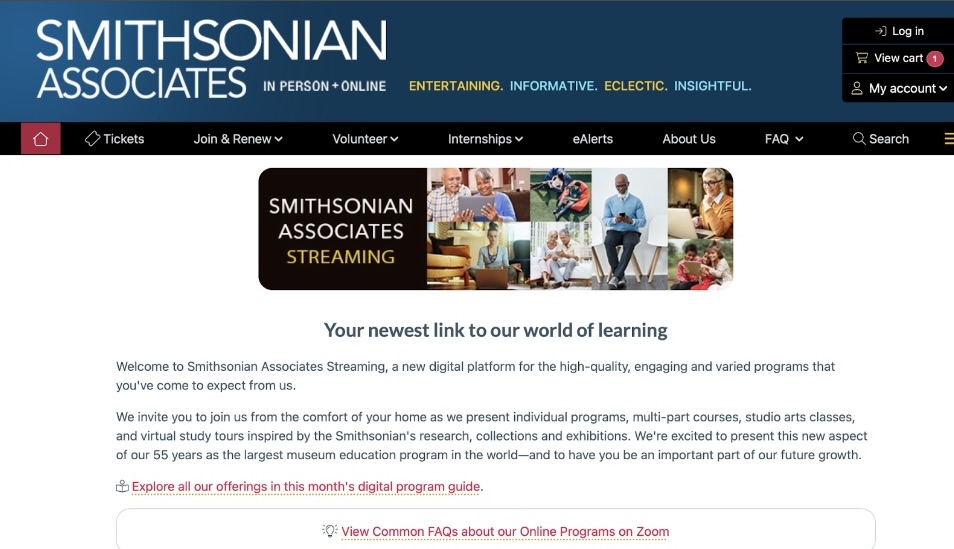
Smithsonian Associates ‘Streaming’ page – 42% bounce rate
Recommendation 1.1: Address slow load speeds and high bounce rates on pages.
Improve user experience by resolving potential technical issues and enhancing page’s content quality and relevance.
Finding 1.2: Top landing pages are also top exit pages.
Recommendation 1.2: Conduct a full SEO audit of the sites and follow up with user research to understand what content is engaging to the user and to test what content is clearly communicating the unique selling points of the products.
Finding 1.3: There is a higher bounce rate on mobile compared to tablet and desktop users, alongside a higher purchase rate on tablet and desktop users.
Table indicating acquisition and behavior of Mobile vs Tablet and Desktop Traffic
Recommendation 1.3: Address higher bounce rate on mobile devices and increase purchase rates on both mobile and tablet/desktop.
Section 2: Product Performance
Finding 2.1: The top three revenue earning products were identified as “Circle of Support,” “Contributor,” “Associate,” and “La Grande Fete 2023.
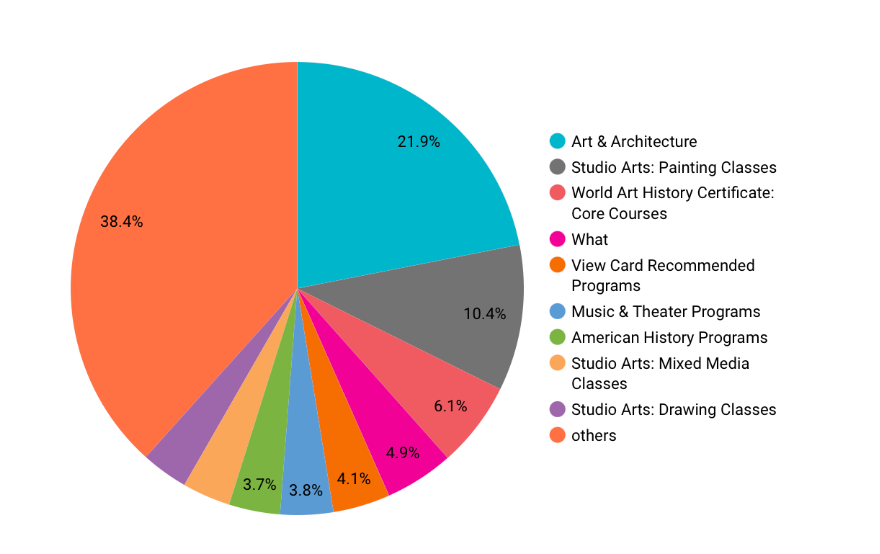
Course earned revenue in percentage based on category
Finding 2.2: The top revenue-earning products outside of donor-based products are courses under the Art & Architecture category.
Overall product views compared to total revenue generated by them
Recommendation 2.2: Analyze the target audiences for the categories and narrow down the promotional paths for these segmented audiences strategically based on user behavior and demographics.
Section 3: Acquisition and E-Commerce
Finding 3.1: Customer acquisition through paid search accounted for the highest e-commerce conversion rate among all traffic channels.
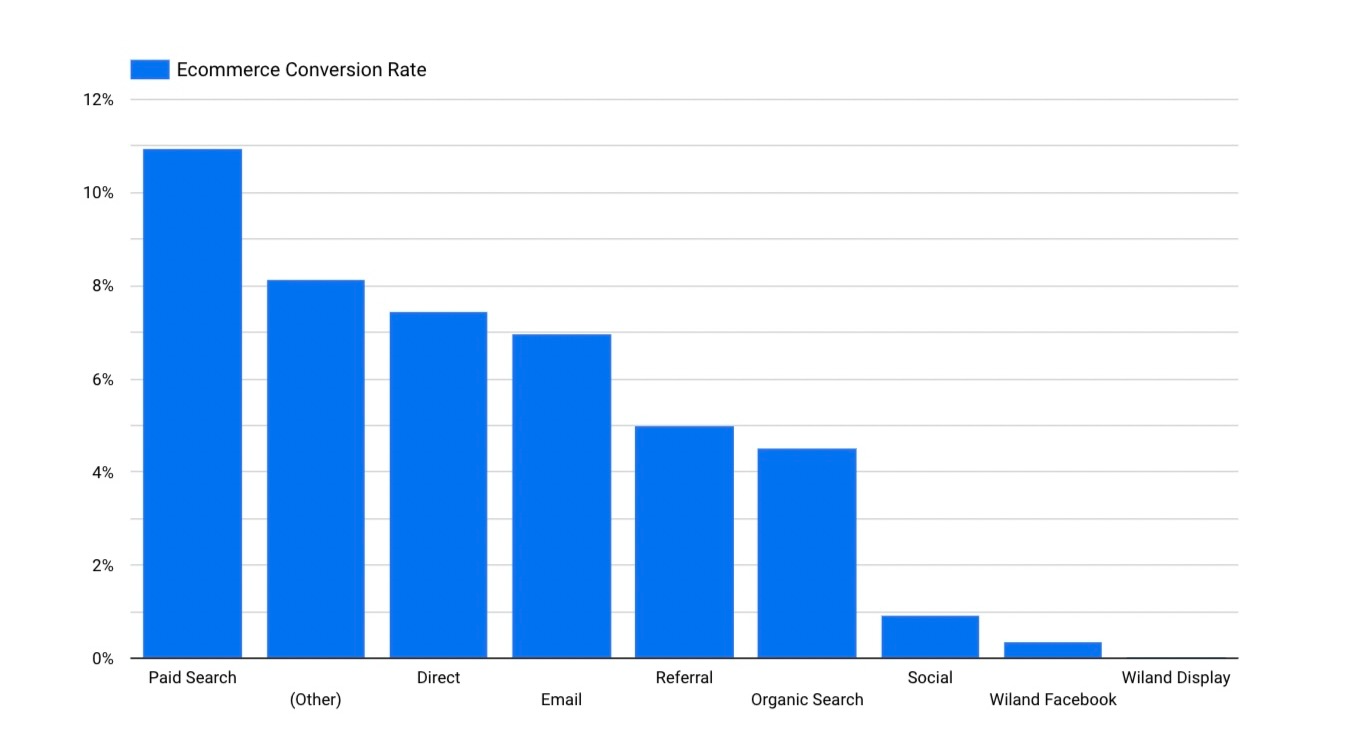
Ecommerce conversion rate by default channel group
Recommendation 3.1: Invest more in paid search.
Finding 3.2: Email efforts generated the most users between February 1 and March 31, 2023.
Recommendation 3.2: Increase email marketing campaigns. Investigate sources of direct traffic to determine how it can be optimized and how the users reflected in direct traffic can be properly tracked.
Finding 3.3: Wiland Display and Wiland Facebook have the highest bounce rates (96.32% and 84.28%, respectively).
Recommendation 3.3: Given the high bounce rate, consider moving away from marketing associated with Wiland Display and Wiland Facebook.
Section 4: Purchasing Behavior
Finding 4.1: The checkout process produces barriers to completing purchases.
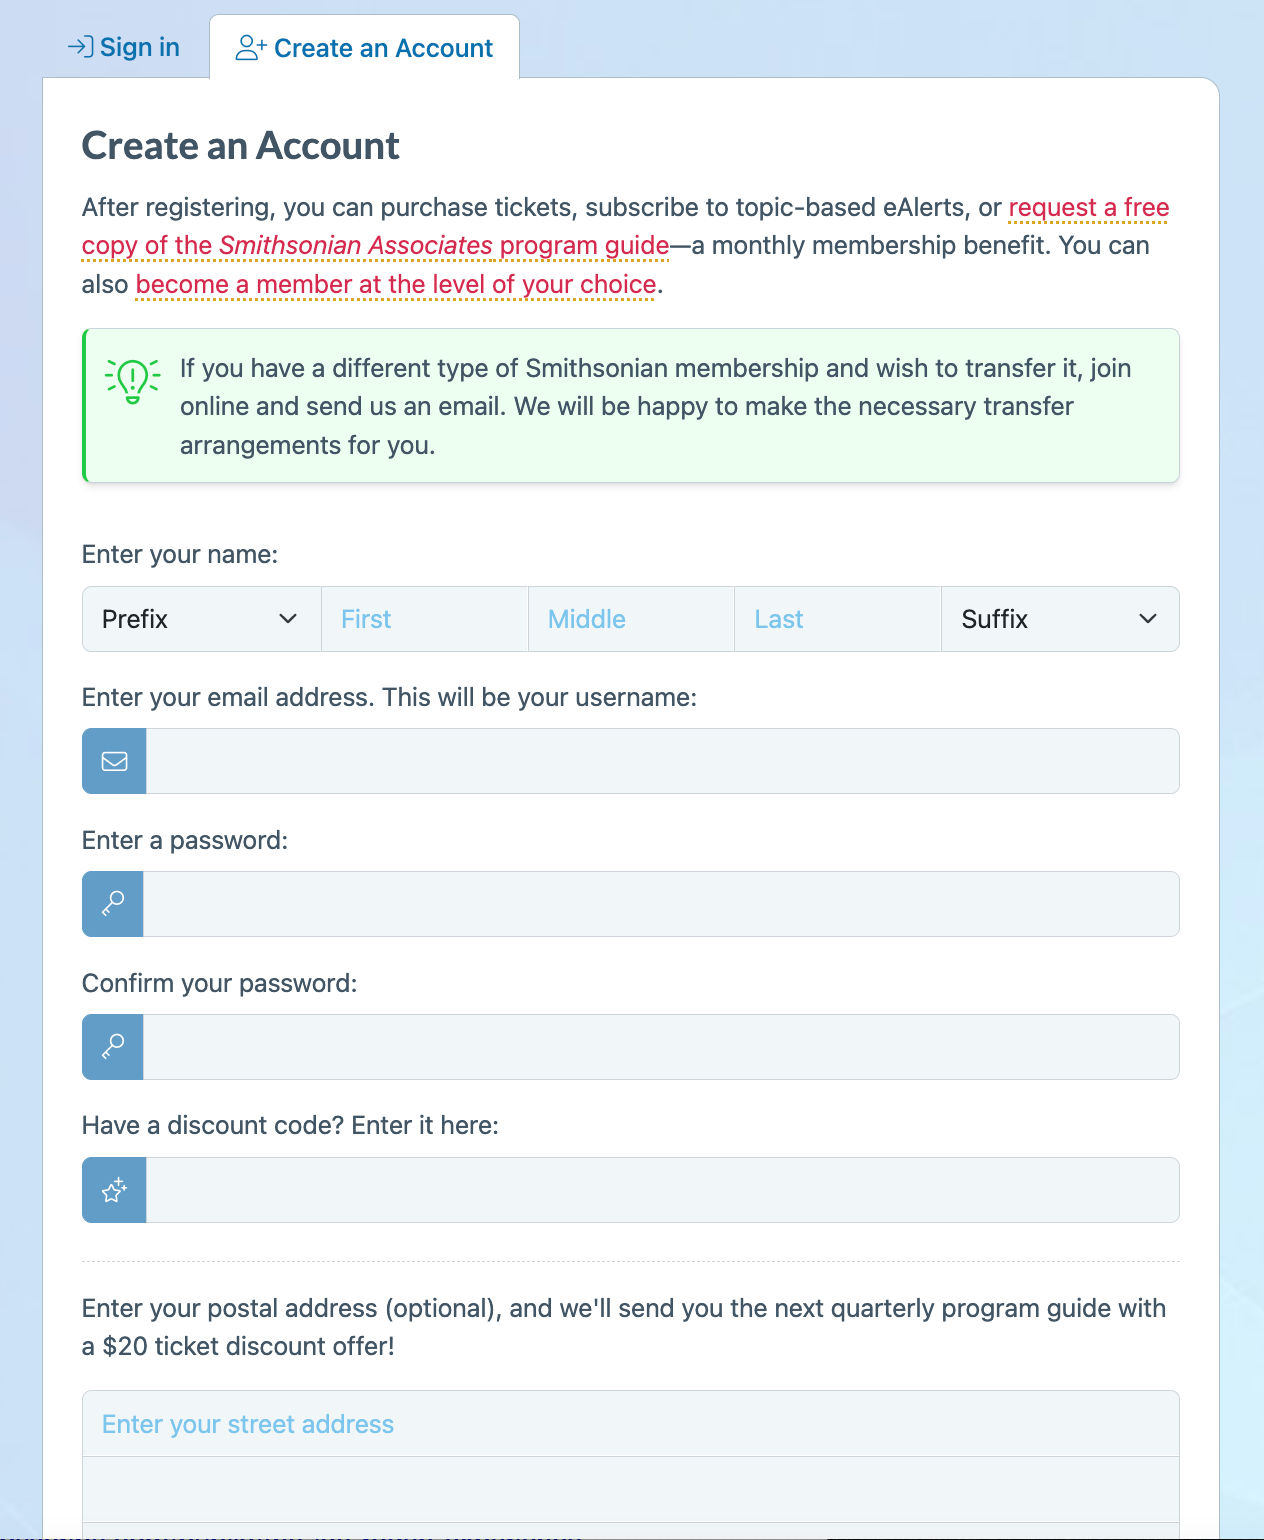
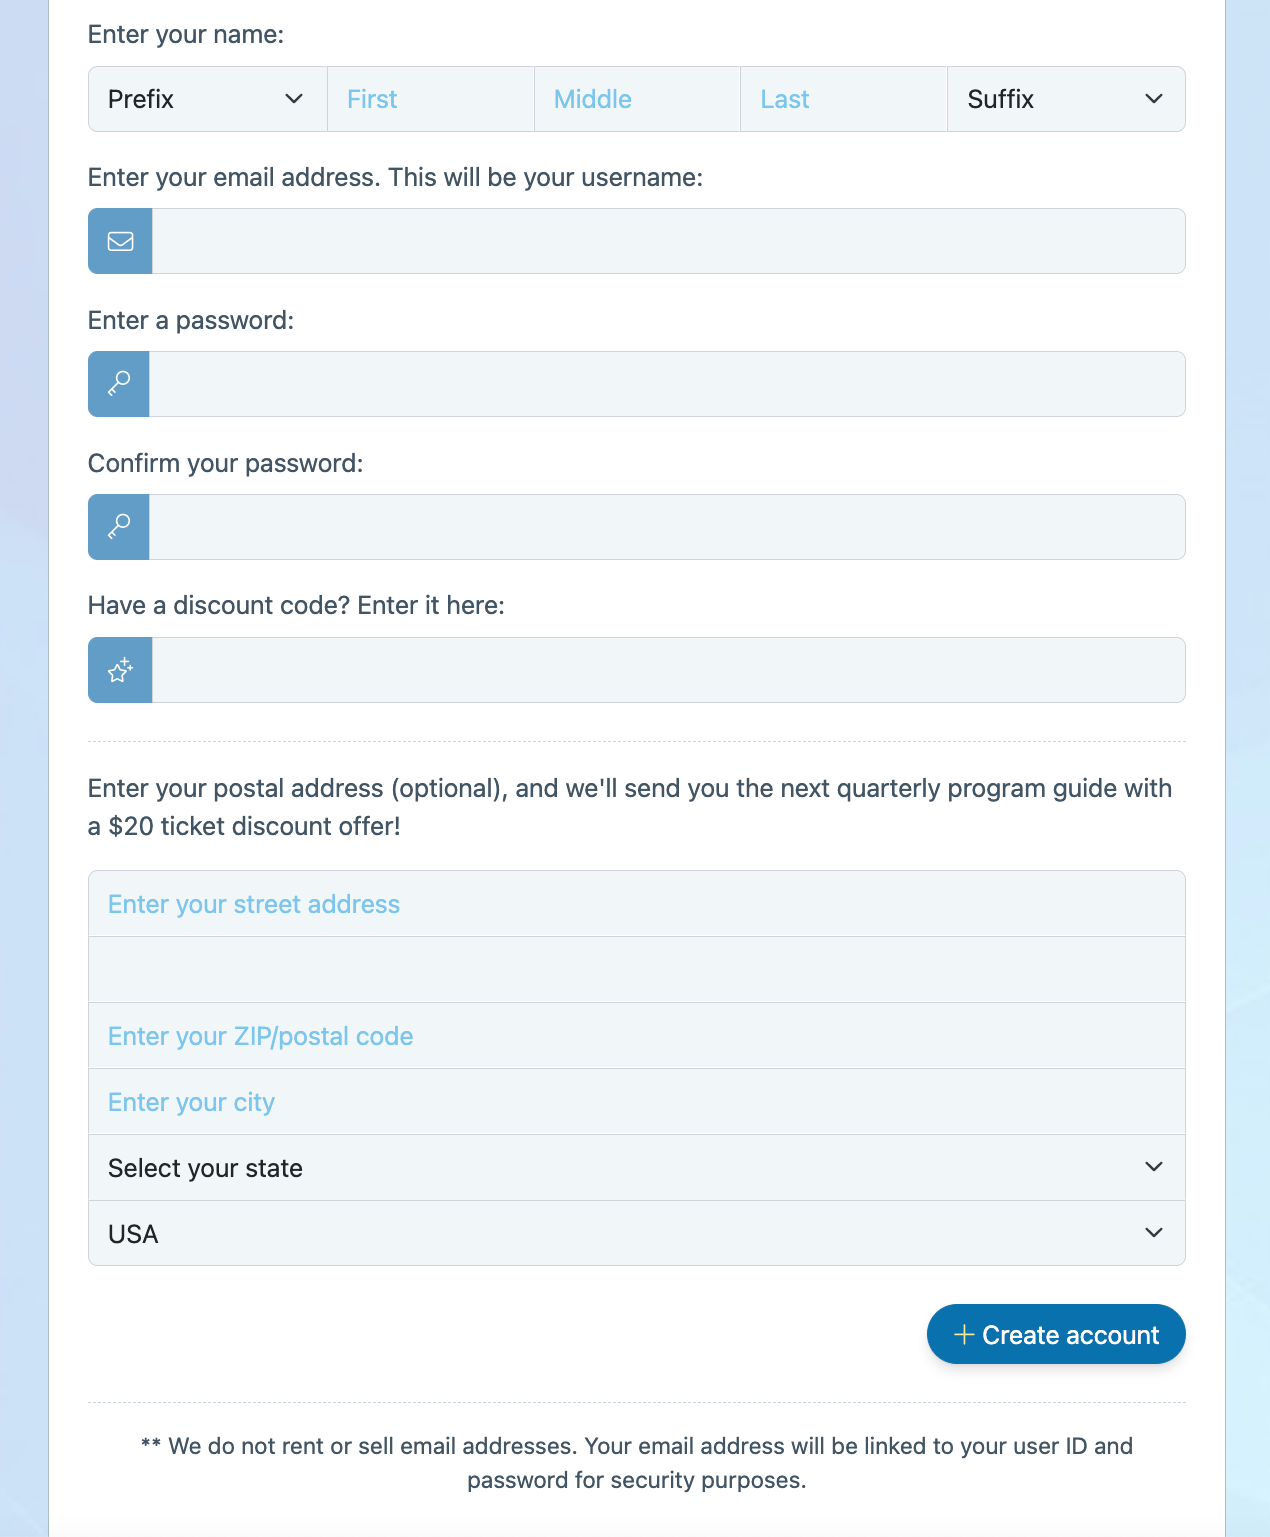
Checkout requires either a login or creating an account for new users; the first step in account creation is a more cumbersome process than necessary.
Recommendation 4.1: Address users’ cart abandonment rates by simplifying checkout.
Finding 4.2: Returning users bring in more value, revenue-wise, overall than new users.
Recommendation 4.2: Capitalize on returning user value through targeted campaigns and create incentives for new user purchases.
Section 5: Transition to Google Analytics 4
Recommendation 5.1 Set up ecommerce tracking within GA4.
Recommendation 5.2: Create additional conversions within GA4.
Recommendation 5.3: Track unassigned traffic in GA4 by using UTM parameters on campaigns.
Conclusion
Overall, Smithsonian Associates has been using Google Analytics, and primarily Universal Analytics, to successfully track a wealth of information on user behavior, especially as it relates to marketing and ecommerce. Our analysis of the Smithsonian Associates website data on Universal Analytics suggests that in order to lower bounce rates and further improve site engagement, streamlining user journeys and site experience, quickening page loading times, and making content more relevant to the user will all prove valuable.
Feedback and Next Steps
When Smithsonian Associates has fully transitioned from UA to GA4, particularly in terms of ecommerce data, more information about product and service success will be available. The team at the Smithsonian Associates plans to drill into GA4 more before the full transition in July. Of particular note to the client was finding ways to further analyze and optimize direct and unassigned traffic. Other relevant considerations included looking into the high rate of new users compared to returning users, as well as some of the bounce rates on various pages. Going forward, the dashboards created for this project will be utilized by the team to track real-time data and further implement changes from UA to GA4.