
Introduction
Quantitative Usability was considered as a statistic way to evaluate system and service efficiency and usability. However, it’s easy to mislead by the quantitative feedback, like Darrell Huff’s “How to lie with statistics”(Huff, 2010), without validity benchmarks, quantitative usability methods are delicate and useless. I introduce both advantages and drawbacks in this article, emphasize the bias of quantitative usability data, and give the solution.
Advantages of Quantitative Usability
The main advantage of quantitative usability feedback is the statistical significance(Budiu, 2017), which means by quantitative feedback either from post-tasks or during the tasks would be more objective than qualitative research, for qualitative research is no assurance to keep the neutral of user. Another favorable is with the comparable large group of the tester, it’s easy to compare findings in a broad view, which could not make it by little samples qualitative usability test.(Erickson, 2017)
Hidden Danger
But not all quantitative responses are reliable, sometimes quantitative data even more tricky than the qualitative one. Performance and preference data are primarily quantitative, in other words, can develop benchmarks to quantify user performance and experience.
Normally, performance data are based on users’ actions, contains time; the number of errors; recovery from errors; success or failure at task completion; use of help; embedded assistance and so on(Barnum, 2010), depends on the task content. The performance data reminds a central way of determining whether users are accomplishing their goals and how fast or efficiently do they accomplish.(Sauro & Lewis, 2016)
It seems safe enough and easy to conduct in every usability tasks, but there are several concerns about apply performance data into analysis.
- quantitative usability is limited in few scales, the time, satisfaction and accomplishment may not represent the usability of the system and service, because unless surrounding with the specific aim of the usability test, statistical data would be useless.
- Another backflow is quantitative tendency may misleading people into a wrong field that covering the real matters of the problem.(Nielsen, 2004)
Preference data also was called user satisfaction, it based on user’s responses to questions on post-tasks, the Likert Scale is one example of it. The preference data are more subjective and may tell the wrong story when using it improperly.
- Users tend to avoid extremes on the scale. Because of the error of central tendency, users tend to not choose the extreme two scores, even though they really want to.
- Users tend to rate the responses consistently. They prefer to stay close to one score throughout the whole test.
- The questionnaire setting time will largely influence the result. Participants with higher ratings after task completion than they did during the task, and the group which was asked to respond only after task completion responded with significantly higher ratings than the other group. (Teague & De Jesus & Ueno, 2001)
Solutions
Set scope to metrics and questions with purpose will reduce the quantitative usability error in a big range. Some SUS questionnaire could alternate the statements between a positive statement and a negative statement in hopes to get the respondent to think about each statement and the appropriate of response. (Barnum, 2010); Change the order of post-questionnaire could solve the problem of responses consistently.
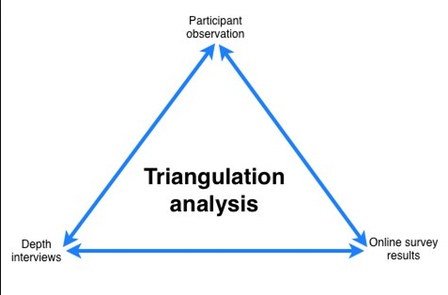
Also, triangulating the data from findings, compare both quantitative data(Questionnaire Responses) and qualitative data(Observations & Participants Comments)(Podems, 2017). Triangulation facilitates data validation through cross-verification from more than two sources. It increases the chances of controlling or at least evaluating some of the unsure or multiple causes that affect our results, tests the consistency of qualitative data and quantitative data results obtained through the different tasks. Triangulation is more than verification, and it can combine quantitative and qualitative results to deepen and broaden understanding. It can be used to generate innovations in the conceptual framework or to attempt to more fully describe or explain the richness and complexity of human behavior from multiple perspectives. (Cohen & Manion, 2002)
Three Types of Triangulating For Minimize Bias
Data triangulation: involves data of time taken, test space, and users, most of them are quantitative data, which could
Investigator triangulation: involves multiple researchers in an investigation, investigator triangulation allows you to combine individual and group research options to help reduce bias such as peer pressure on the focus group; Getting sufficient coverage to remove the sample bias caused by omission.
Theory triangulation: involves using more than one theoretical scheme in the interpretation of the phenomenon. This triangulation could solve the problem of procedural bias, which means the participants are put under some kind of pressure to provide information. Interpret information in a various way will relief users.
Methodological triangulation: involves using more than one option to gather data, such as interviews, observations, questionnaires, and documents. Most of the Usability Test user this triangulation method to supplement user research. (Kennedy, 2009)
Conclusion
Quantitative and qualitative usability should complement each other iterative in one integrated usability test. Using the trends found in qualitative responses will help lay the foundation for quantitative matric setting. It is just as important to understand why and how as understand how much and how many in the usability test. Be careful about the traps in quantitative feedback, and try triangulation to refine the user testing.
Reference:
Barnum, C. M. (2010). Usability testing essentials: ready, set… test!. Elsevier.
Cohen, L., Manion, L., & Morrison, K. (2002). Research methods in education. routledge.
Erickson, Jenna. (2017). UX Designers: Do Not Be Scared Of Quantitative Data. https://usabilitygeek.com/ux-designers-quantitative-data/
Huff, D. (2010). How to lie with statistics. WW Norton & Company.
Kennedy, Patrick. (2009) How to combine multiple research options: Practical Triangulation http://johnnyholland.org/2009/08/20/practical-triangulation
Nielsen, Jakob. (2004). Risks of Quantitative Studies. https://www.nngroup.com/articles/risks-of-quantitative-studies/
Podems, Donna. (2017). Triangulation. http://www.betterevaluation.org/en/evaluation-options/triangulation
Raluca Budiu. (2017). Quantitative vs. Qualitative Usability Testing. https://www.nngroup.com/articles/quant-vs-qual/
Teague, R., De Jesus, K., & Ueno, M. N. (2001, March). Concurrent vs. post-task usability test ratings. In CHI’01 extended abstracts on Human factors in computing systems(pp. 289-290). ACM.
Sauro, J., & Lewis, J. R. (2016). Quantifying the user experience: Practical statistics for user research.