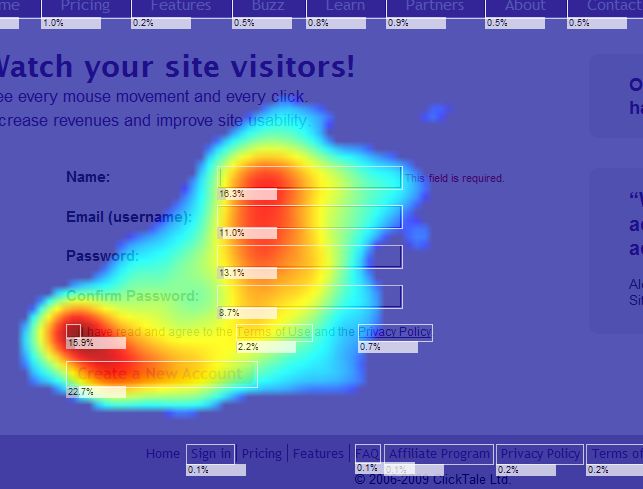
There are several ways to determine if the design of a website meets your pre-determined goals. One of the ways to determine this is with Clicktracking, similarly grouped with Clickmapping. With a small amount of Javascript placed into your website, you will have the ability to find out where on your site visitors are drawn, what they click on, and where they spend the most time. Doing so offers the web owner/designer the ability to make changes that might bring about positive change in terms of increased traffic, and/or sales, or positive user interaction.
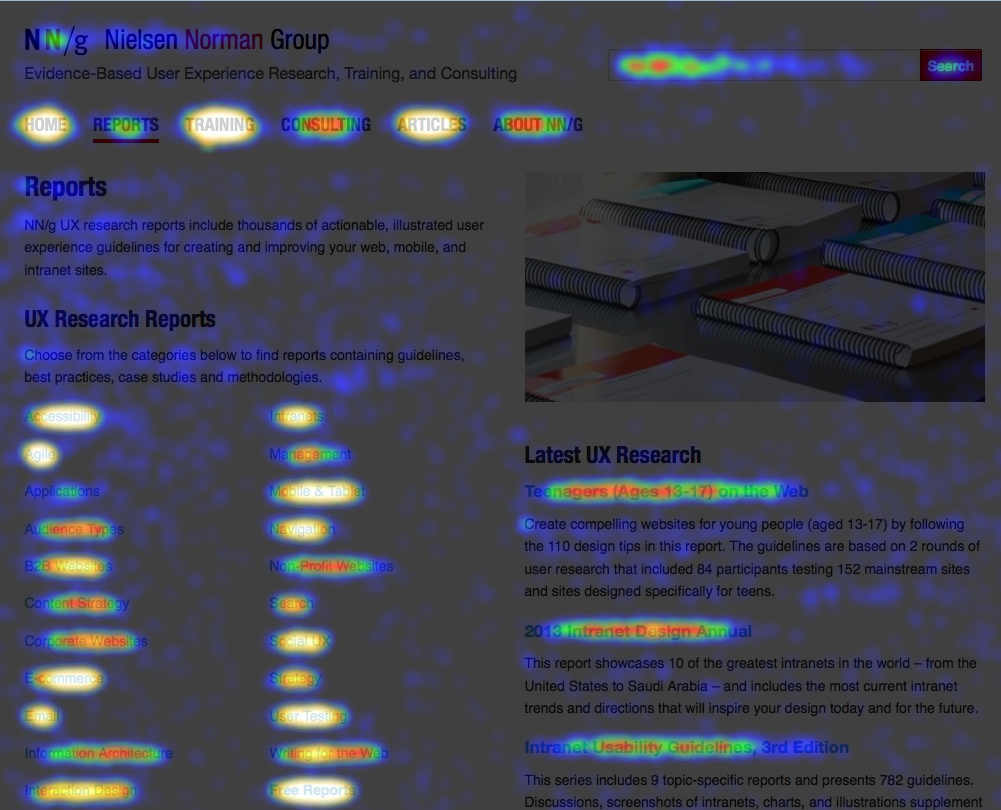
Indirect assessment with Clicktracking is a component of a User Research method named Quantitative Analysis, which is typically derived from mathematical analysis, since the instrument of data collection (e.g., survey tool or web-server log) captures such large amounts of data that are easily coded numerically (Rohrer, 2014). In conjuction with Clicktracking, Heat Maps provide a means to visually understand how the data is collected and most often presents the findings in a high-contrast graph pointing out instances with a spectrum of colors where bright white and bright red relates to most viewed or clicked and blues and violets relating to least viewed or clicked. As the number of visitors clicks increases, the graph increases the size of bright areas along the top of the color spectrum and morphs the darker colors into brighter ones, increasing the size of those as clicks increase.
This mapping feature takes place by activating a control that triggers the system to perform a function, in this case, a relationship occurs between a control and its effects (Matz, 2012). By recording what users do with their mouse or trackpad, UX experts can quantify the data and identify potential issues and offer suggestions to improve site usability.
“Heat maps are great for analyzing the behavior of your visitors.”
Heat mapping has been around the web since the mid-1990s but is not without it’s share of issues. Although, mapping with the use of a mouse generates data from actual visitors, accuracy of this mapping is not always accurate (Sonberg, 2017). Users might be looking over looking at items on a site that they don’t click or hover over. Likewise, they may be hovering over items that might not otherwise get attention. The mapping shows exactly where the mouse has gone but experts must infer that a user is watching the mouse as it’s moved. This is the reason that heat maps from eye-tracking software is a bit more respected in the field.
Unfortunately, quantitative studies with eye-tracking software is not inexpensive. In fact, quantitative research in itself is much more expensive due to the fact that more data needs to be collected. In addition, quantitative analysis is subject to bias due to the fact that experts must make inferences to what a user was thinking and must make suggestions based on this information.
All in all, businesses that conduct quantitative research through indirect clicktracking are in for a treat. Often, analyzing the behavior of the visitors leads to insights not often found using other methods. Also, visuals provided by the heat maps communicate information in a direct manner. Although, inferences need to be made, most often the amount of data collected will draw a sharp eye to the points most drawn out by users. For businesses that find themselves lacking visitor follow throughs, clicktracking might lead them to the most obvious problem and a clear way to bring about change.
Matz, K. 2012. Donald Norman’s design principles for usability. Architecting Usability: a blog exploring User Experience design. Retrieved from: http://architectingusability.com/2012/06/28/donald-normans-design-principles-for-usability/
Rohrer, C. 2014. When to Use Which User-Experience Research Methods. Nielsen Norman Group. Retrieved from: https://www.nngroup.com/articles/which-ux-research-methods/
Sonberg, J. 2017. 19 Things We Can Learn From Numerous Heatmap Tests. ConversionXL. Retrieved from: https://conversionxl.com/blog/19-things-we-can-learn-from-numerous-heatmap-tests/