In 2018, the Digital Preservation Outreach & Education Network (DPOE-N) originally created by the Library or Congress in 2010, transitioned to Pratt Institute School of Information and New York University’s Moving Image Archiving and Preservation program. In 2020, they were awarded a two-year grant from The Andrew W. Mellon Foundation with the a goal to help cultural institutions within the United States digitally preserve collection archive data (especially born digital collections), expand the digital skill sets of those stewarding those collections, and also provide emergency hardware support.
The Ask
The key objective they wanted to accomplish with this project was to get the funding into the hands that need it most. They wanted to realize this through expanding their reach on their digital platforms (website and social media) and gain a greater understanding of efficient and effective ways to connect with their targeted audiences. Since their resources are limited, identifying the key platforms to focus their energy while yielding the highest impact was an additional goal.
Some Challenges:
- Limited organization resources
- Not yet formalized digital engagement KPI’s review process
- Upcoming transition of Project Manager position
- COVID-19 impacting workshops
The Clients:
Dr. Anthony Cocciolo
Principal Investigator &
Board Chair
Dean of the School of Information, Pratt Institute
Erin Barsan*
Board Member &
DPOE-N Program Coordinator
School of Information,
Pratt Institute
*Erin transitioned from the role June 18, 2021
The Project Team:
- Olivia Turpin
- Jessika Davis
- Cameron Dudzisz
- Prachi Chhajed
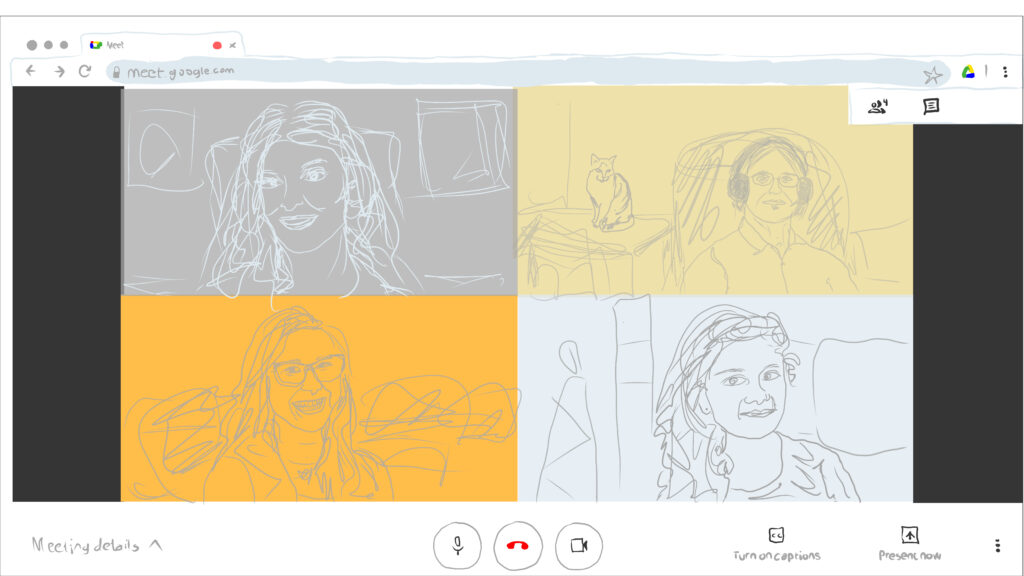
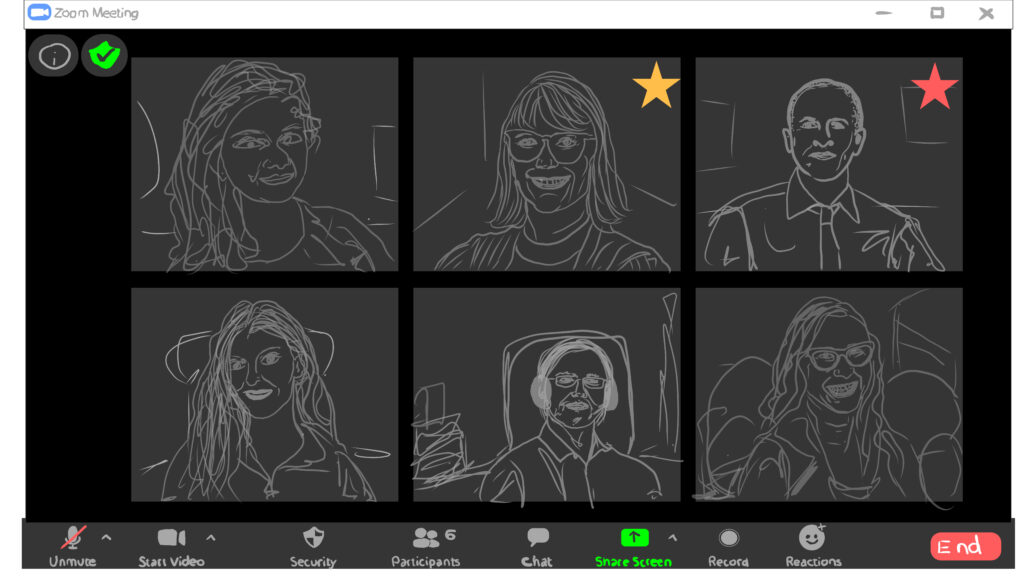
Virtual, virtual, and more virtual!
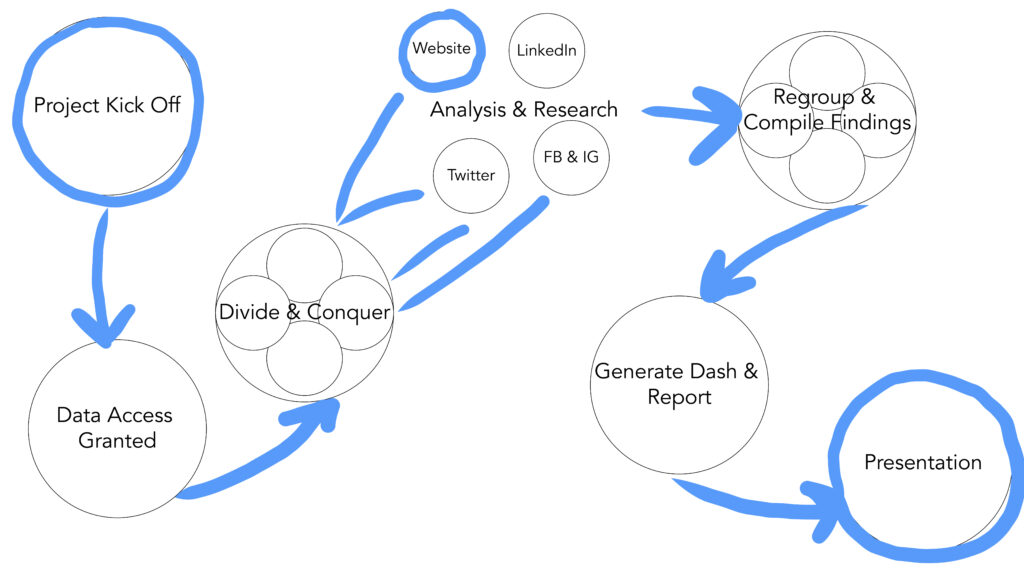
Timeline
My Role:
Due to the tight timeline of this project, we as a group made the decision to each take on a platform (as to not overlap our efforts). I primarily analyzed DPOE-N’s website and contributed to the report write up for the overview, findings, recommendations, and conclusion.
With a background in project management and process improvement, I drove many of the group meetings (scheduling, notes, capture of actions and next steps). I had also contributed to layout, copy editing, and the design.
Methodology
With the game plan of “divide & conquer” in effect for the analysis, capturing the baseline for who was using the website ,where were they going on the site, and how engaged they were became the primary set of questions to answer.
Meanwhile, the rest of the group focused on analyzing the reach and engagement of DPOE-N’s social media accounts: Twitter (Olivia), LinkedIn (Prachi), Facebook, and Instagram(Cameron). But at points during the project- we all provided each other helpful feedback and additional insight with our own findings when brought to the team.
Period of Time Analyzed:
- Website: October 7, 2020 – June 19, 2021
- The start date is the presumed website launch date as data is not available prior to this timeframe
- Social Media: February 1 – June 16, 2021
Metrics:
- Website: unique pageviews, sessions, time on page, bounce rate and users
- Social Media: impressions, engagements and engagement rate
Tools:
Additional tools utilized: Twitter Analytics, Facebook Business Suite, LinkedIn Analytics
Tool limitation to note:
- Google Data Studio = Limitations with data manipulations in the desired format/ dimensions
- Challenge to incorporate multiple data sources, had to compartmentalize
- No live connections with social media derived data in Data Studio
RESULTS and FINDINGS
Overview of Website Traffic and Audience
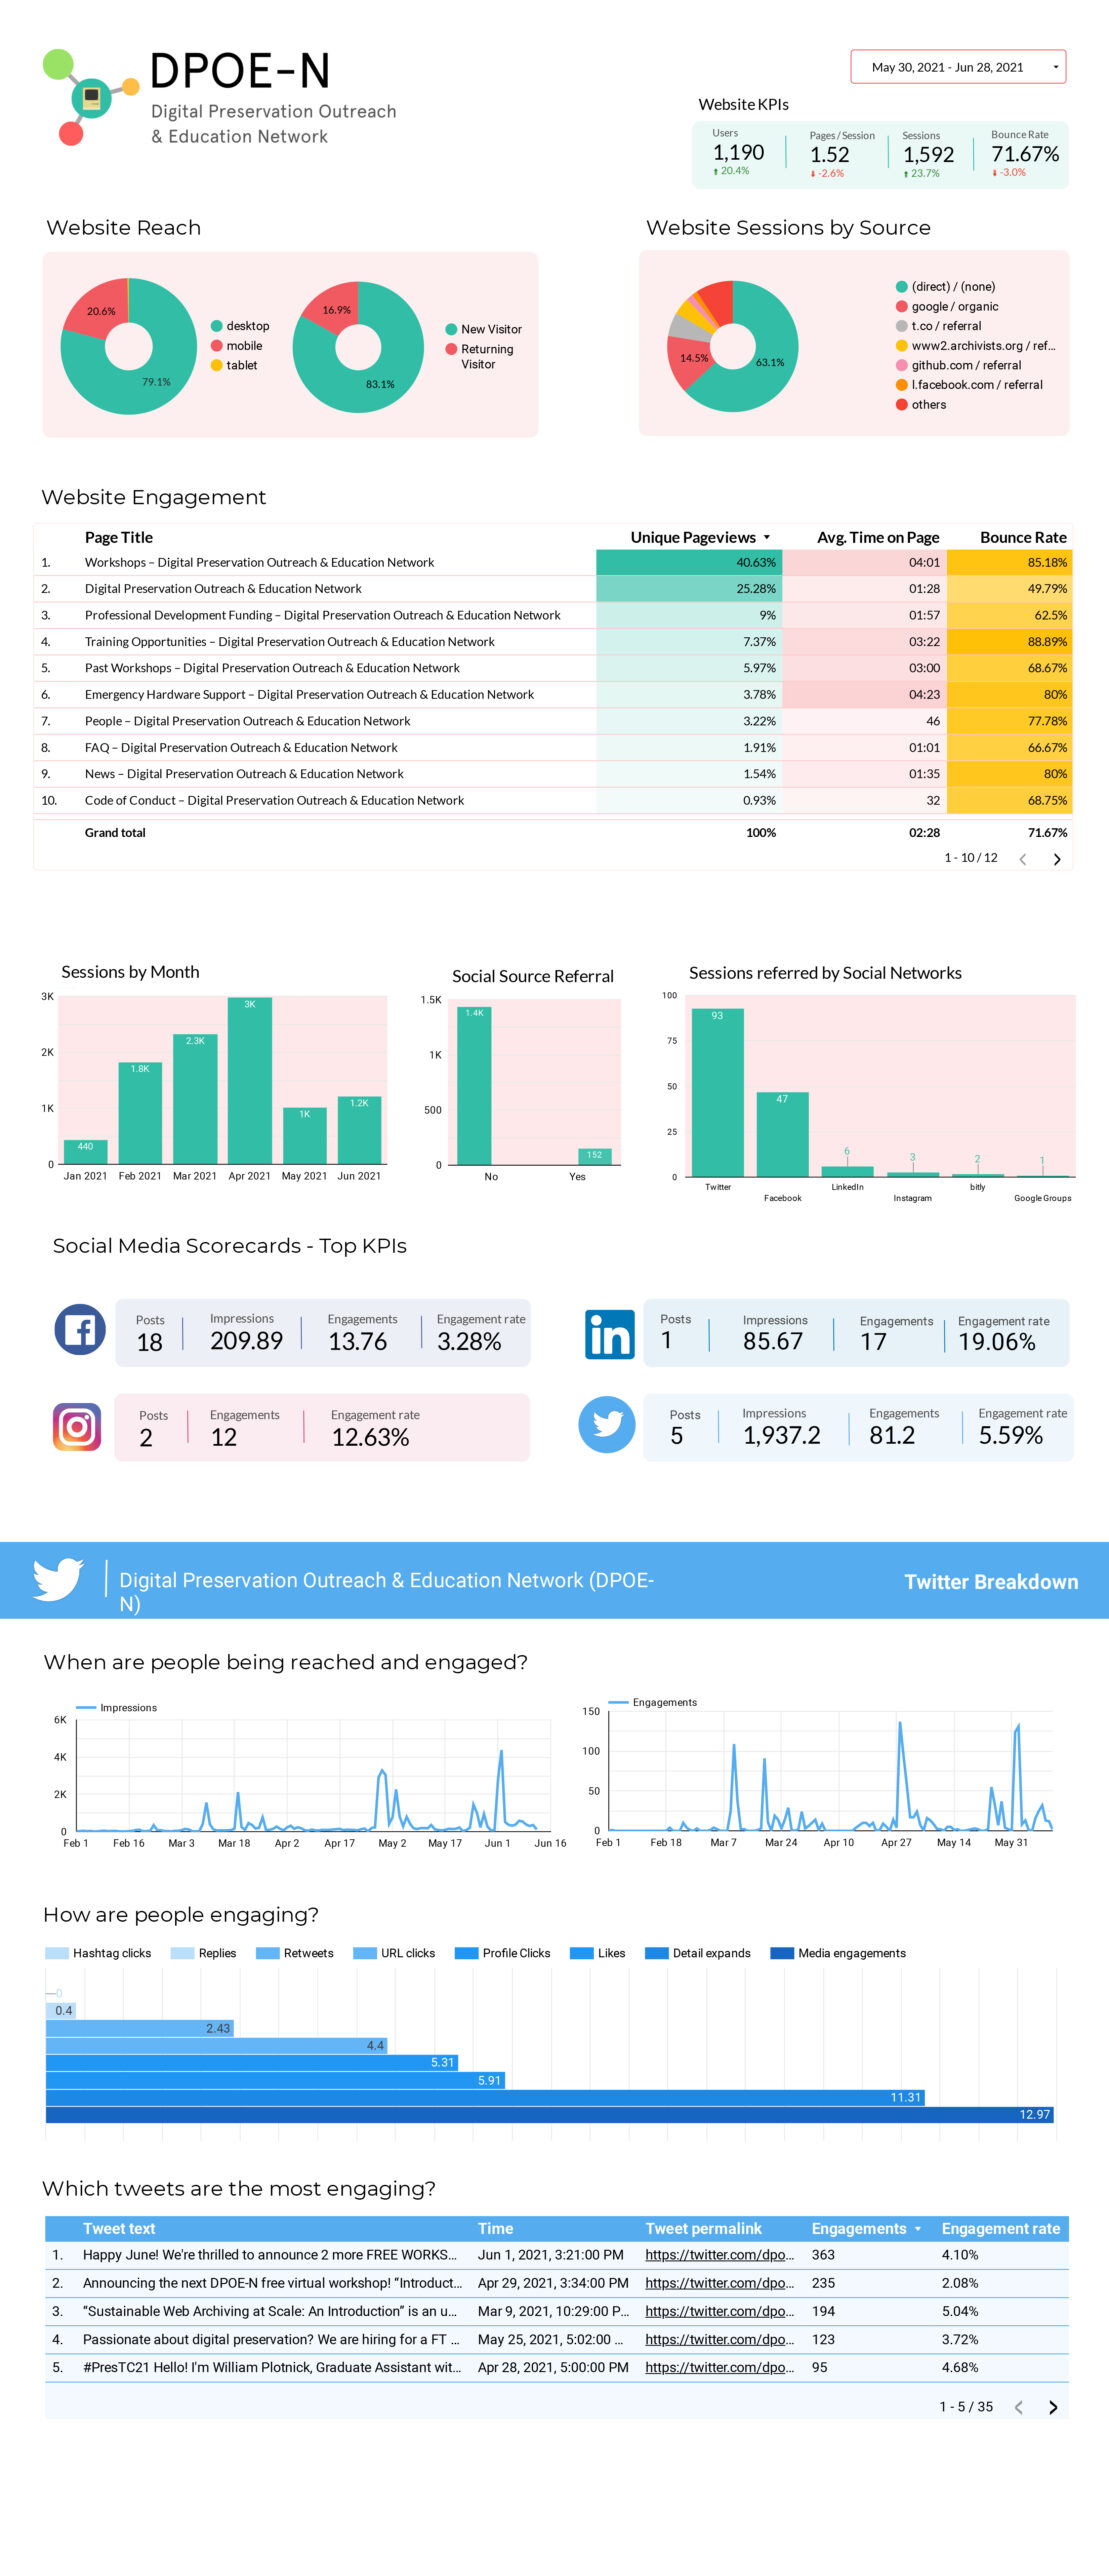
The website traffic for Digital Preservation Outreach & Education Network from Oct. 7, 2020 onward, resulted in a total 12,147 sessions.
Geographically speaking, many of the users are accessing the website from the United States. Canada, UK, China contributed to the next highest user volume respectively
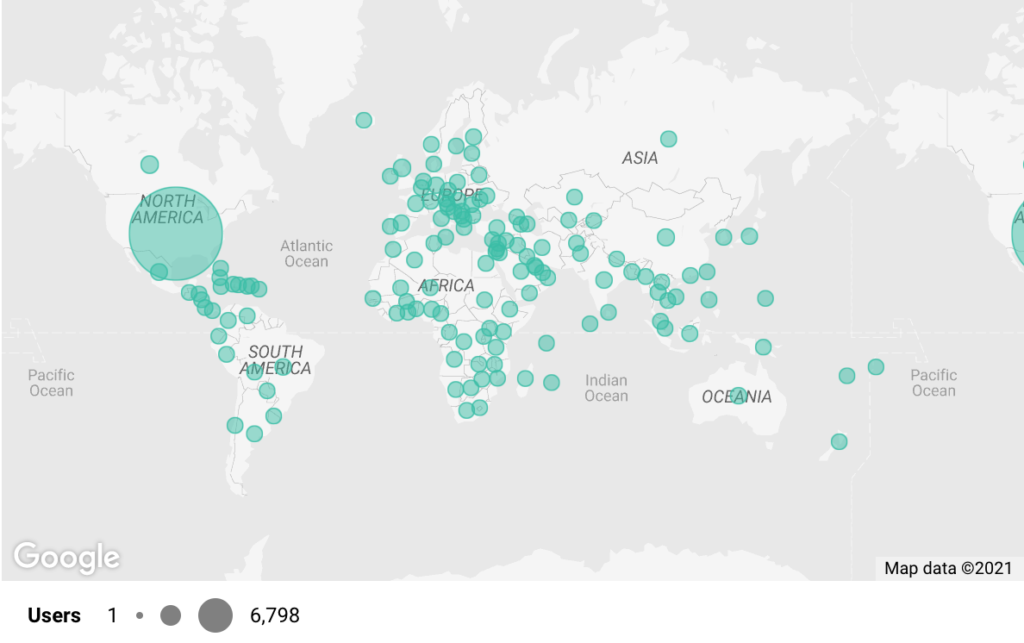
The U.S. comprises 75% of the user volume
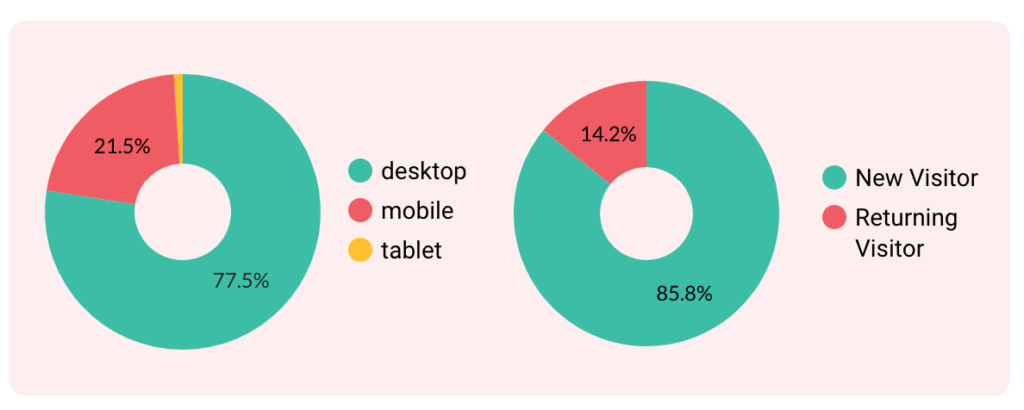
More users were accessing the site via desktop and were
new visitors.
Finding 1.1
Measuring Page Activity Towards Funding and Education Objectives. Where were the visitors going? What were they doing?
The top 3 pages with the highest Unique Page Views:
- Digital Preservation Outreach & Education Network (home page)
- Professional Development Support – Digital Preservation Outreach & Education Network
- *In February 2021, it appears the name of the page title changed to: Professional Development Funding- Digital Preservation Outreach & Education
- Workshops – Digital Preservation Outreach & Education Network

Unique Pageviews and Time on Page and Bounce Rates, Oh my!
Date Range May 21 – June 19, 2021
Workshops – Digital Preservation Outreach & Education Network
- Highest unique pageviews = 38.9% of total website page views
- Concerning to see higher bounce rate (85.7%) which might be explained by the lack of clickable links to the schedule of workshops (the header with “apply now!” is a jpeg)
- Longer Avg. time on page comparatively to other pages- possibly due to time needed to read through the copy in search for a way to apply (like a form etc.)

Example of .jpeg header on Workshops page.
Professional Development Funding- Digital Preservation Outreach & Education Page
- Houses the ‘Apply’ for funding button (key objective)
- 3rd highest unique pageviews = 9.9% of total website page views
- Avg. time on page is shorter than expected, considering lengthy page copy
- However, the bounce rate (60.8%) is not as high as other pages
Recommendation 1.1
Optimize Education and Funding Pages.
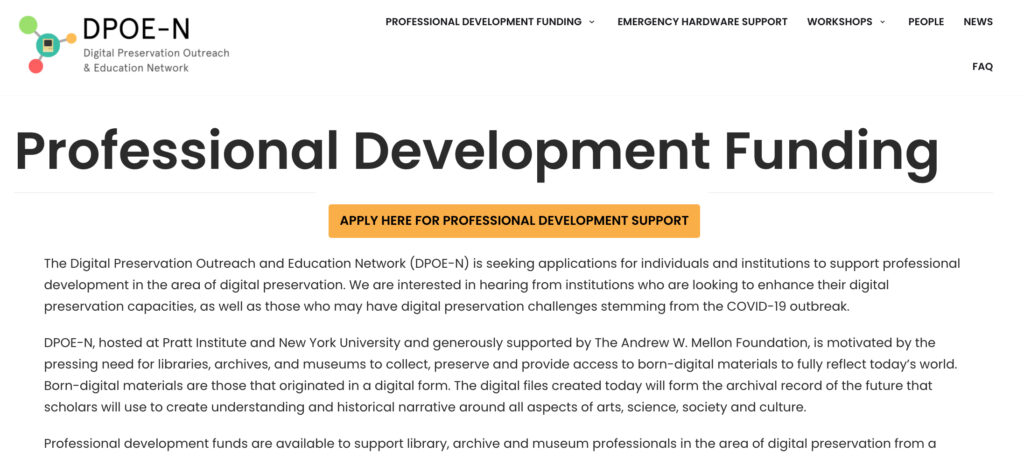
- Move the “Apply” for funding button higher on the page (like right)
- Set up Event Tracking and Goal within Google Analytics to track and identify the sessions of users that submit a funding application by clicking on the “Apply” button – measure conversion rate
- Add the “Apply” button to higher trafficked pages, like the Home page and Workshops
- Created Clickable URL’s/ Textual Headers for optimized UX and SEO
Finding 1.2
Website Traffic Insights.
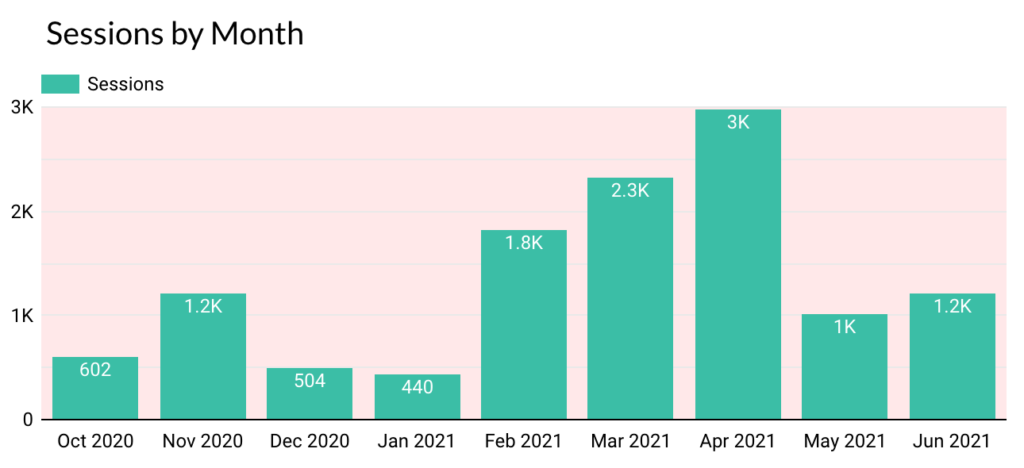
For the date range October 7, 2020 – June 19, 2021, the sessions over time indicate incremental growth in sessions to the website.

Where is the Traffic Coming From?
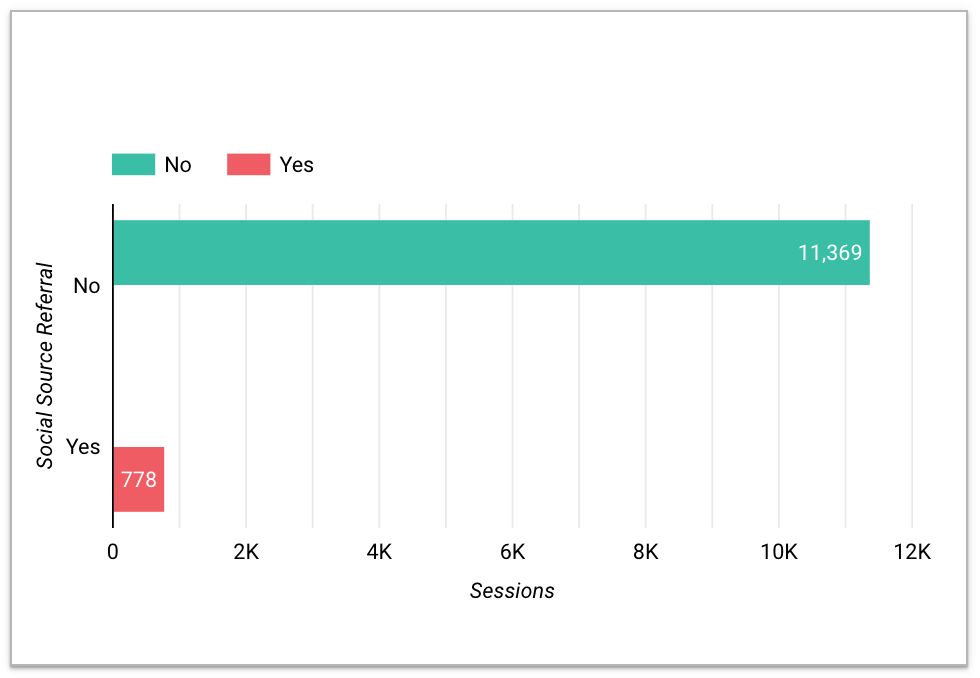
94% of the sessions are generated from sources other than social media platforms.
Sessions by Source/Medium
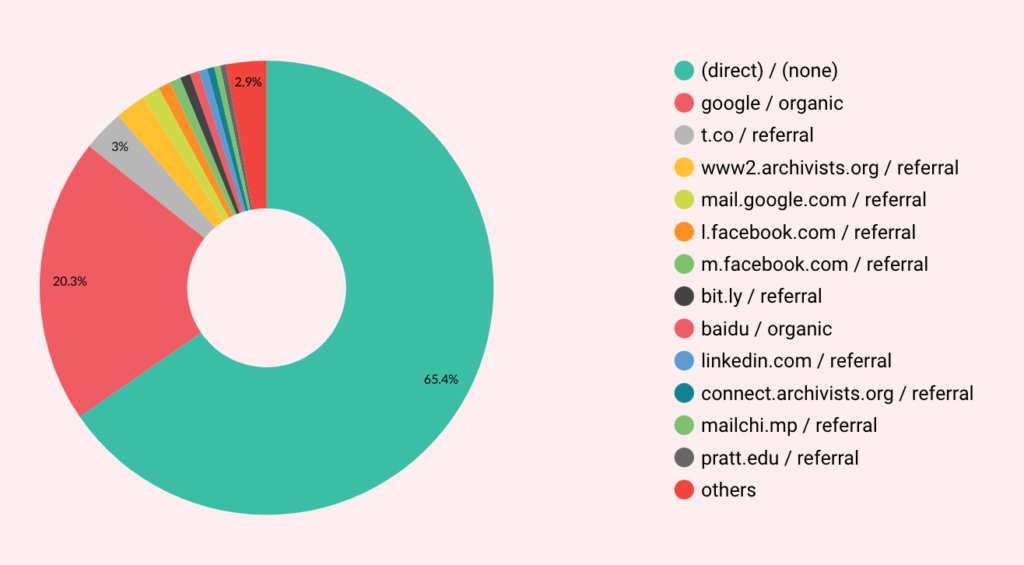
65.4% = Direct
20.3% = Google Search Engine
3% = Twitter (t.co)
Significant traffic from: www2.archivists.org – Client indicated a 6 month target ad placement on this site. This demonstrates that targeted marketing and leveraging in-industry organizations does in-fact yield results as it relates to generating website traffic.
The highest traffic source is “direct”. This can have multiple causes: the site visit generates from a book marked link, the site has been visited before, the site is being visited through email blasts (the link is being shared without campaign tracking), and/or the site’s web address is being typed directly into the browser (strong indication of self-generated traffic).
Seeing Twitter in the top 3 definitely gave indication that the website visitors were motivated by the posts on DPOE-N’s Twitter feed to come on over to the Website.
Recommendation 1.2
- Social media and referring organizations
- Maximize these platforms as website traffic generators
- Campaign Tracking
- Track external marketing campaigns to better identify web traffic sources through Google Analytics
- Identify and exclude Organization “self” initiated traffic
- Settings can be adjusted in both Google Analytics and CMS platforms
Finding 2.1
Social Media Comparisons.
Analysis period of February 1, 2021 – June 16, 2021:
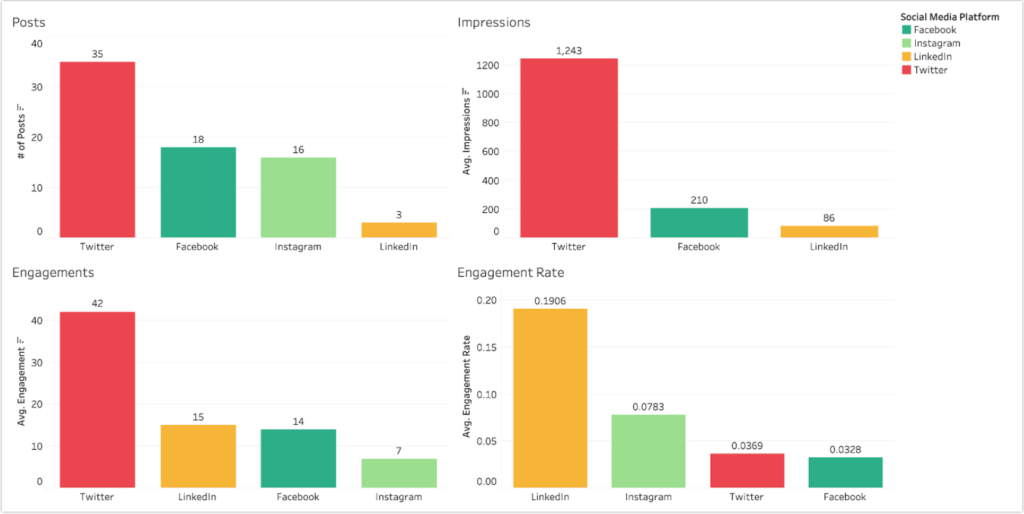
Twitter vs. Facebook vs. Instagram vs. LinkedIn
Our analysis discovered that Twitter was the most successful social media platform by a number of metrics.

- Created 35 Posts
- 1,243 Impressions/post
- 42 Engagements/post
- 258 Followers

- Created 18 Posts
- 209 Impressions/ post
- 14 Engagements/post
- 209 Followers
- Created 16 Posts
- NA impression data
- 7 Engagements/post
- 95 Followers

- Created 3 Posts
- 166 Impressions/post
- >1 Engagements/post
- 214 Followers
Recommendation 2.1
- Twitter is the most successful
- Prioritize Twitter as a primary communication tool
- Other platforms can be used as supporting tools, with their own unique set of features
Finding 2.2
A deeper dive into Twitter content performance. What are the ingredients to a successful post?
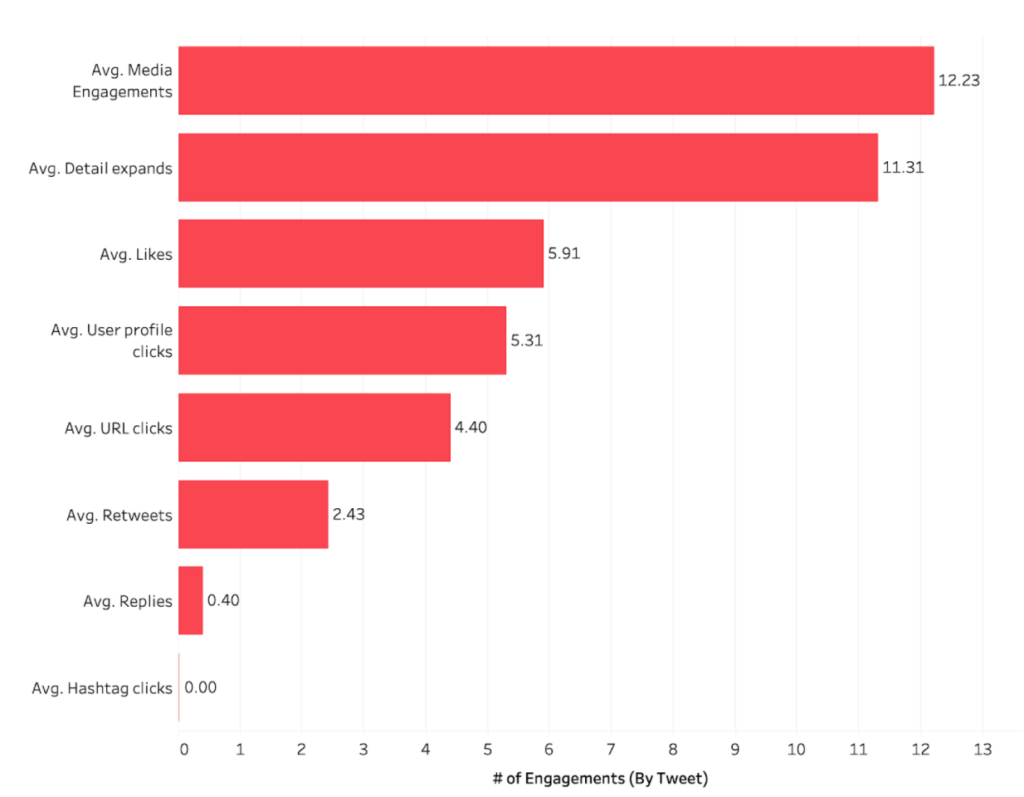
Media engagements are the leading form of engagement
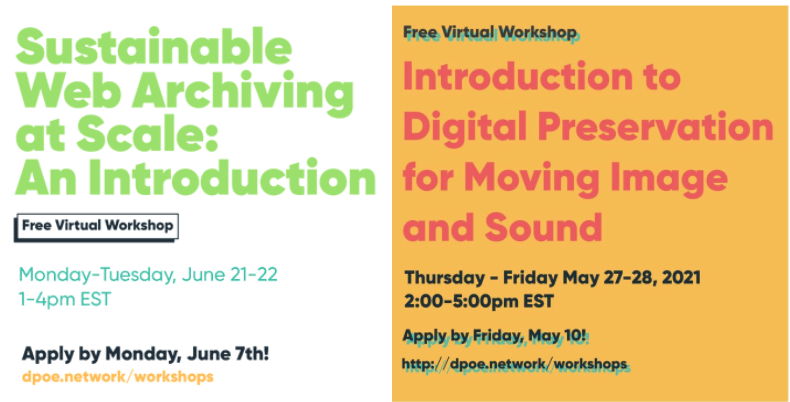
Highest engaged Media on Twitter
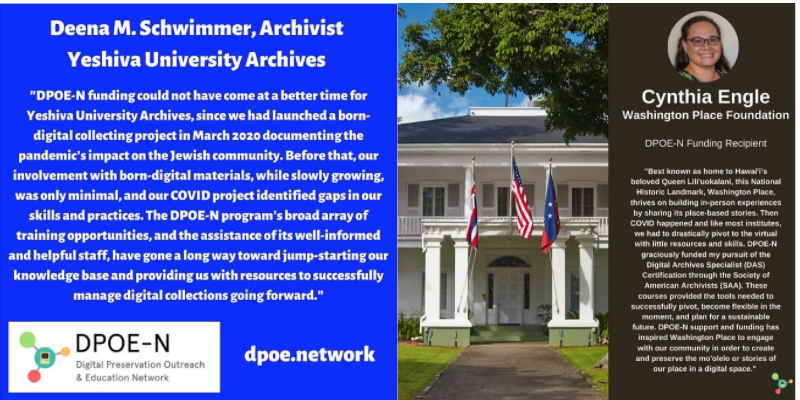
Lowest engaged Media on Twitter
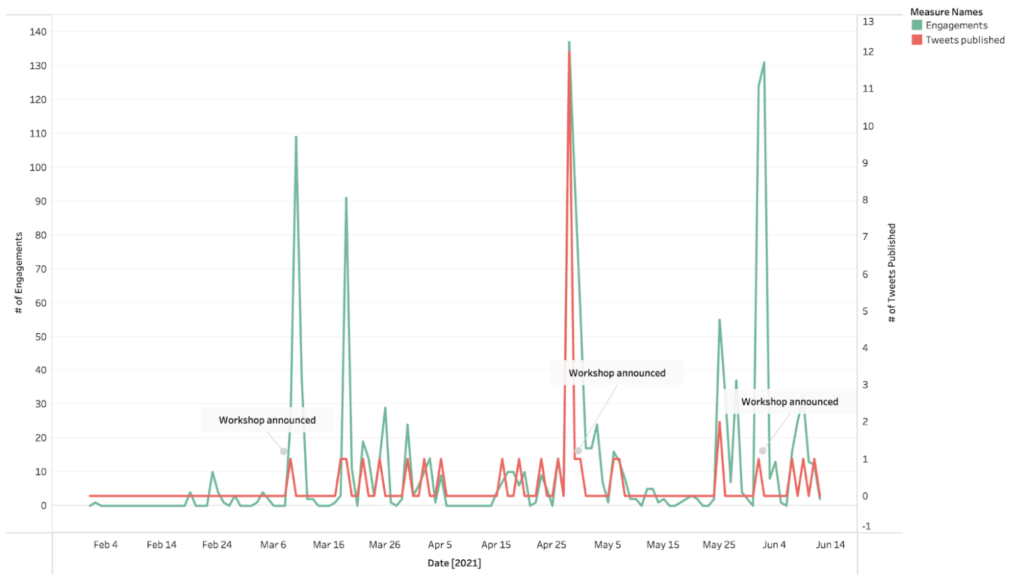
Workshop announcements
are the most popular topics
Recommendation 2.2
Engage users through images and broaden hashtag usage.
- Media is highly engaging
- Use impactful images by limiting text-heavy graphics
- Hashtag considerations
- Opportunities to expand hashtag usage
Conclusion
The client shared what I had most hoped for, the findings and recommendations we provided were useful and actionable. He verbalized that it “got the wheels turning” and he continued to be engaged as he followed along with interacting with the Data Studio Dashboard we had created.
With recommendations we provided, the client mentioned taking immediate action on the following:
- Understood the value of H1 and alt text to optimize SEO – would be changing
- Adding a clickable URL with Key words in the headers
- Ensuring the future Twitter image posts followed the “good” template
- Thought the idea to leverage the high traffic to the workshop page to drive elsewhere in the site was great!
Ultimately the feedback was all positive and the client seemed very satisfied with the final product. He was thankful to be able to deliver a dashboard and improvement actions for reach and engagement growth to the newly on-boarded DPOE-N program manager. He also indicated that it was validating to receive data that corroborated what the organization has been sensing with their experiences with web and social media traffic.
Utilize Tracking
Target Marketing Works
Optimize Website Pages
Maximize Twitter’s Potential
Reflection
Time was definitely a force that we had to reckon with. Balancing the limited time we had for analysis yet still produce an actionable deliverable to the client was certainly a challenge. It did, however, push us to provide them with an overview and recommendations that would help them both immediately and also identify targets on the horizon they could shoot for with future analysis.
It would be extremely interesting to follow up with the client later in the year. This is the additional analysis I would pursue:
- Post set up of Event and campaign tracking, add additional widgets to the data studio dash to account for the conversion rates
- Segmented Visitor journey mapping (those that complete goals vs not)
- Entrances and exit rates possible for website- flow of traffic
- Comparison analysis between social media platforms
- If they were to be more active with LinkedIn, deep dive into a more robust data set (not that many produced by the organization to date presently, but the engagement rate was high. There is a curiosity to see if LinkedIn “worth” their higher advertising rates).
Final Dashboard
