Overview
Client: Braata Productions
Team members: Nishi Chitale, Nathalie Traikos, Marc Molta, Olivia Loeb-Mevorach
Project Duration: 3 weeks
Tools used: Google Analytics, Supermetrics, Google Sheets, Looker Studio
Introduction
Braata Productions is a charitable organization that offers an avenue for artists of Caribbean and Caribbean-American descent to showcase their talents through a diverse range of mediums such as music, theater, education, community events and folk art. Their primary objective is to showcase the richness of Caribbean culture, including its artists, music, stories, movement and theater, by featuring it in prominent spaces and providing greater exposure to various art forms. Braata Productions provides both entertainment and education to their audience while empowering performers, writers and directors to express themselves freely. The organization strives to accurately represent the folk culture of the Caribbean islands in a creatively authentic manner.
Methodology
The team primarily used Google Analytics to look at the visitor behavior, device break-up and overall website performance. We also extracted public data for Braata’s instagram account via Supermetrics. This data was used to understand the popularity and engagement rate for the account. We also provided recommendations to improve Braata’s instagram presence and boost engagement.
Defining research goals for Braata
The team had a conversation with Andrew Clarke, Braata’s Executive Director, to gain insights into the organization’s objectives. The main aims of Braata Productions are:
- To enhance the number of event sales and attendees
- Increase the volume of donations received, and extend its audience beyond the Caribbean community.
Our analysis focused on comprehending visitor behavior on the website to assess the level of engagement with events. Additionally, we aimed to examine social media engagement to identify successful and unsuccessful strategies, with the objective of enhancing overall engagement.
Findings from Google Analytics
Overview

I looked at the data from Jan 01, 2023 to Mar 31, 2023 and these were some of my key observations:
- The overall traffic to the website is very low with the exception of a spike in the month of February
- A big chunk of the users visit the website on mobile devices which makes it important to ensure that the mobile experience is smooth and easy to navigate
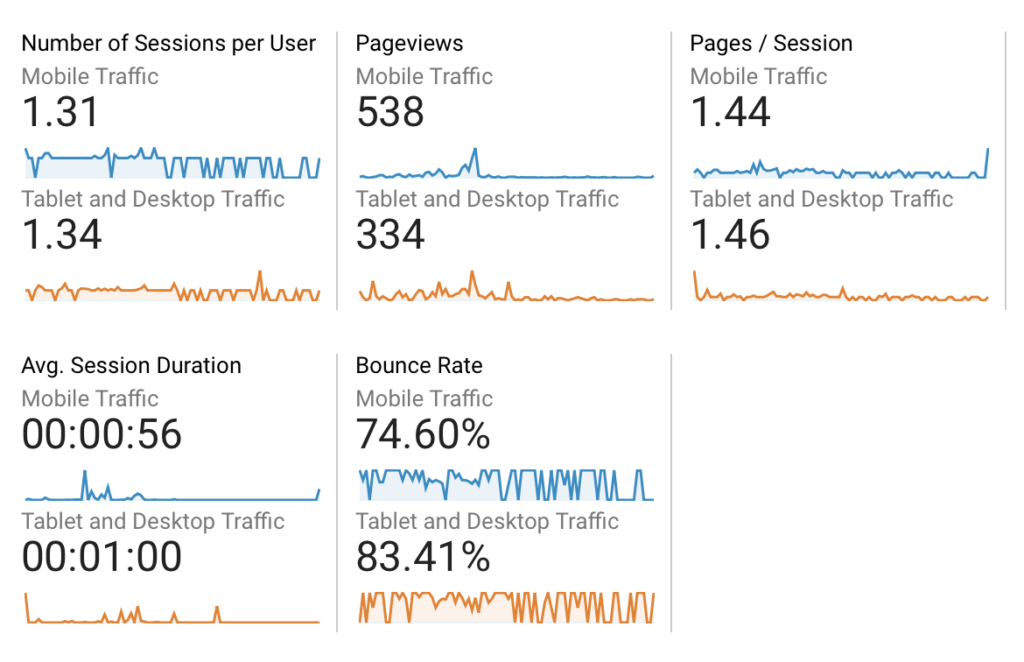
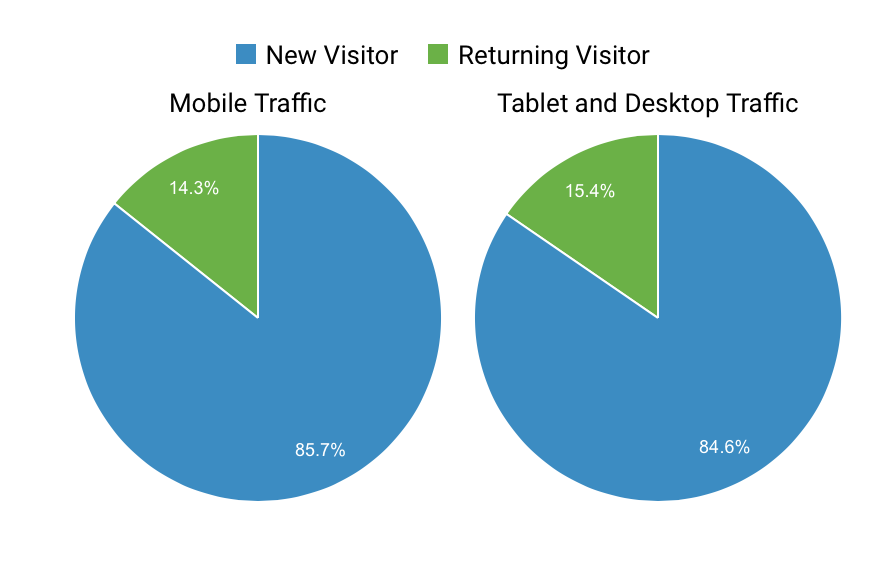
I also looked at new vs returning users and noticed that a majority of the users are new. This means that the website needs to focus on introducing the organization and its mission to these users in a clear and effective way. As the sessions statistics indicate, the bounce rate for the website is really high, especially for desktop and tablet users. The average session duration is also barely a minute so there is a possibility that users are not engaged by the content presented to them.
We also did some funnel explorations to understand pathways that users take and also to look at abandonment rate.
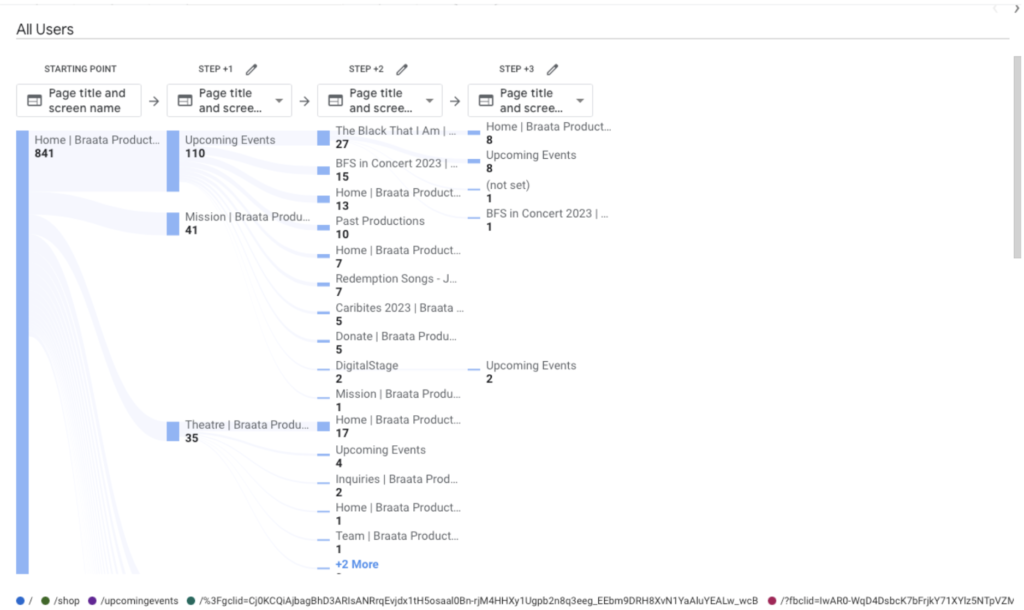
Finding: Website users mainly seek out upcoming events from the home page
The exploration of Braata’s website data through Google Analytics allowed us to generate charts that provided valuable insights into user behavior on the platform, including the types of users, their interactions with the site, and the duration of their visits. We aimed to answer two key questions: how many users are navigating to the Events page, and what percentage of those visitors are purchasing tickets?
The path exploration (Figure 1A) analyzed data from February 22, 2023 to April 21, 2023. Out of the 841 recorded events from the home page, 110 events went to the Upcoming Events page. According to the logs, the most visited page was “The Black That I Am” event, which received 27 events right after users navigated to the Upcoming Events page. However, users frequently returned to the home page after spending time on the Upcoming Events page, possibly due to outdated events still appearing on the page.
Recommendation: Track trends through GA Events and Looker Studio Dashboard
- Use the custom Looker Studio dashboard to track visitors, page views and website performance
- Regularly check Google Analytics to understand user behavior and what the website is lacking or can improve
- Create custom events to better track ticket sales, product sales and donations
Findings from Instagram data
After analyzing the Instagram Data, we noticed some patterns about the posting frequency, the engagement metrics and the content type of the posts. We looked at the quantitative data from Supermetrics as well as looked at some individual posts for qualitative insights. Here are some of our key observations:
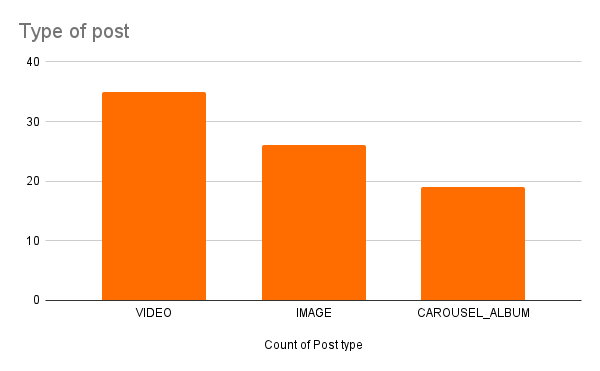
Finding: Braata’s video posts get more interaction than other type of posts
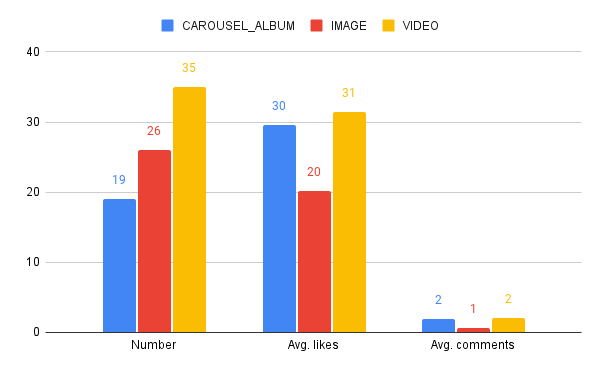
We looked at the different types of content posted by Braata on Instagram and compared it to the likes and comments received by each type. This gave us a clear idea about the relation between post-type and engagement rate.
Our Observations:
- Braata predominantly shares video content, which is advantageous as short videos are currently the most popular form of content consumption. Among the most well-received videos on the account are previews of upcoming shows and snippets of performances.
- By providing similar content with better use of captions and hashtags, the account can potentially increase its views and engagement on the platform.
- The number of comments and likes varies significantly across the posts, but videos generally garner more engagement than other types of content.
- The channel’s most successful posts are videos, specifically previews of new shows or highlights of past performances. This indicates a strong interest in this type of content from the audience.
- Conversely, static single image posts are the least popular, especially those with a lot of graphics and text within the image.
Finding: Inconsistent rate of posting is causing lack of growth for the account
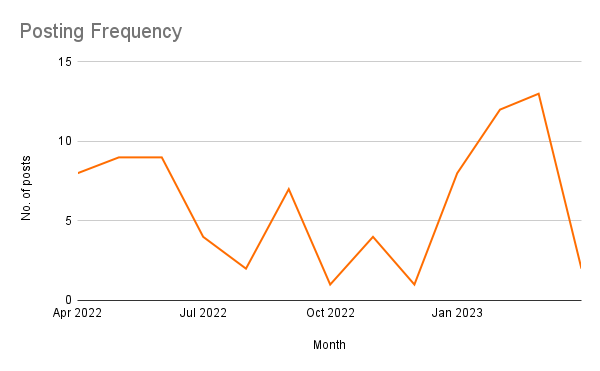
After examining the account’s monthly posts, we found significant fluctuations in the total number of posts. In some months, the account posted up to 10 times, while in others, only 2 or 3 posts were made. Instagram favors consistency in posting, and as a result, we strongly advise establishing a regular posting schedule. This will prevent the account from losing its current followers, help it maintain its momentum, and encourage more frequent engagement from its audience.
Recommendations – Social Media Strategy
Based on the best practices and strategies for social media, we recommend the following actions to enhance Braata’s follower count and engagement rate:
- Develop a social media calendar and aim to post at least three times a week. The calendar should consider existing social events or special days to attract more traction and attention on the platform. Examples include Mother’s Day, holidays, and more.
- Utilize performers or actors to promote the brand when there are no events to promote. Posts can include behind-the-scenes information on how productions are made, providing more insight into the process.
- Track the performance of paid promotions by checking whether they are directing users to the website. This can be done using GA4, which provides multiple ways to track the number of visitors who came to the website from the Instagram profile, the number of users who clicked on paid ads, and more. If specific products are promoted in a post, it’s possible to track sales of that product too.
- Create and post high-quality content that meets users’ expectations for the channel. Nowadays, users expect very good quality content because of the popularity of other channels on Instagram.
- Braata will also benefit from typing the words, ‘Link in Bio,’ or a similar directive, rather than including both options. Improving instagram captions could include both the above suggestion and making the caption text more concise – one paragraph seems to be effective based on competitive organisations posts.
- Connect Instagram data to Looker Studio dashboard. This will help keep a track of paid ad campaigns and will let Brat know if users are clicking on the website link in the bio.
Track basic website metrics with Looker Studio Dashboard
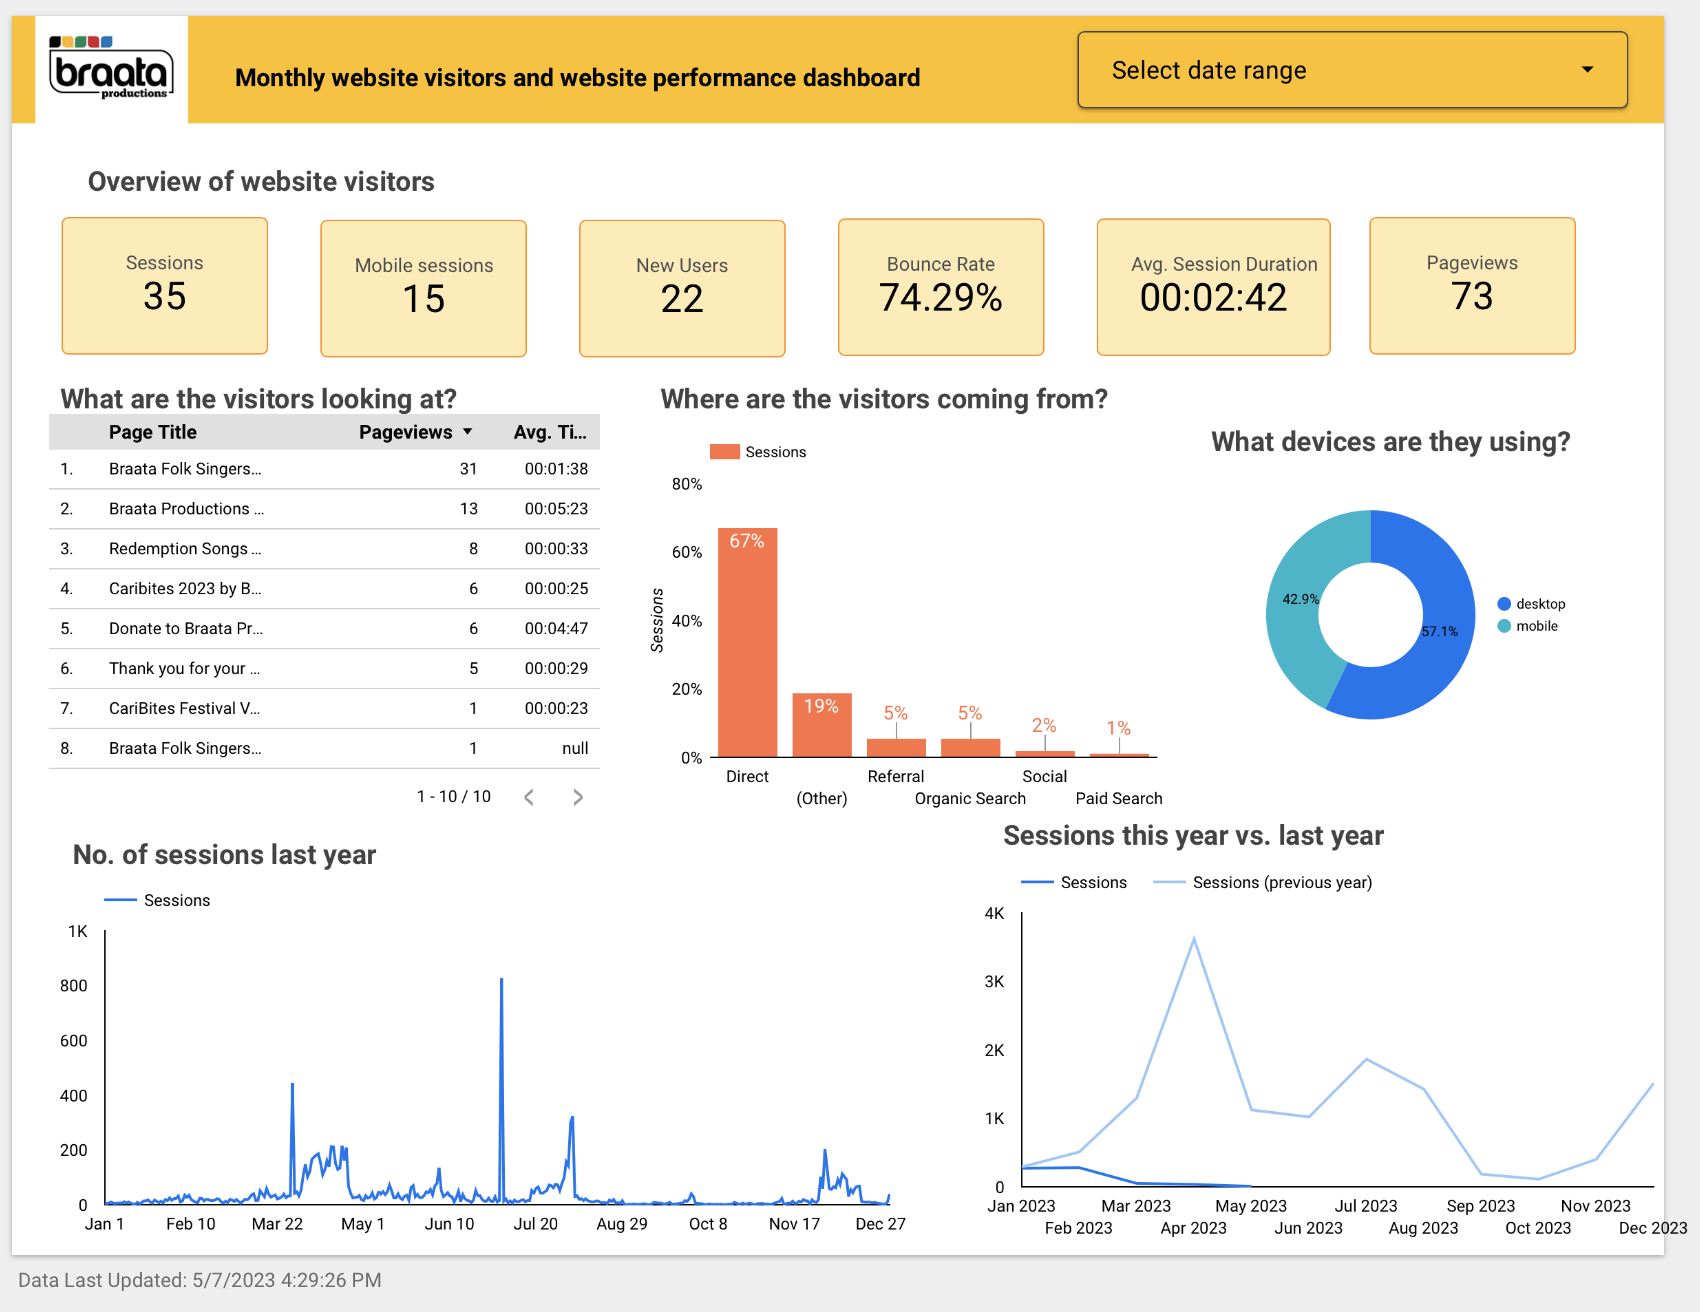
We created a custom dashboard in Looker Studio to help track basic website metrics like sessions, users, bounce rate and page views. There is a custom date selector that will help the client have more control over what they are looking at. Comparing historic data will also help the client understand how the website is performing year-on-year. View the dashboard here.
Conclusion
On May 8, 2023, the team shared the website and Instagram analytics data with Braata’s Executive Director, Andrew Clarke. Andrew was impressed with the insights and recommendations presented, and he mentioned that many of the findings and suggestions had already been discussed within the organization. He confirmed that there were plans to revamp the website based on similar recommendations provided by the team. This project was also successful due to the guidance and expertise of Prof. Elena Villaespesa.