Tereza Chanaki | INFO-685-01 | MSc Museums and Digital Cultures

Overview
Creative Capital is committed to understanding how their digital audience is interacting with the website and whether their content is reaching key users. As a non-profit grantmaking organization that is dedicated to funding artists in their pursuit of groundbreaking new work, their organization vision states:
“To champion artistic freedom of expression, to be at the forefront of discovering and fostering the creation of radical art, and to build a wild and wondrous artist-centered community that inspires a global public.”
With this in mind, we approached their two main problems: Instagram Engagement and information about their Donation and Support efforts. Our team was made up of five Pratt Institute’s School of Information’s students from various courses, and after an initial meeting with Creative Capital’s Director, Editorial & Digital Content, we were ready to begin our explorations.
Methodology
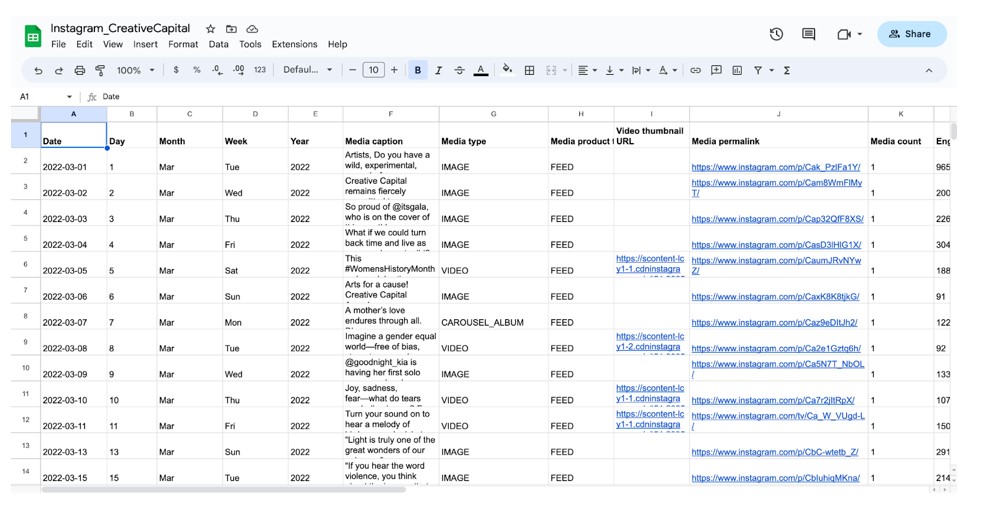
We found that dividing the work based on people’s interest and skills would be the best. In the initial stage we collected raw Instagram data using Supermetrics, requested and were given access to Creative Capital’s Google Analytics and experimented with an initial draft of our Looker Studio dashboard. All of these came with their own setbacks. For instance, Supermetrics does not offer a followers growth metric, whilst the forced migration from UA to GA4 meant that the data available on GA4 was limited as it only covered the past three months, and not the past year like Creative Capital had requested. Howver, by now, our project goals and questions we wanted answers to, were clear:

This first stage prepared us enough to organize a mid-point check in with Creative Capital. During this meeting we were able to reassess our direction and ensure that we were working towards what they needed the most. These adaptations included ensuring our dashboard data was from March 2022-2023, including data on the most popular website pages, and a focus on how people are finding Creative Capital online.
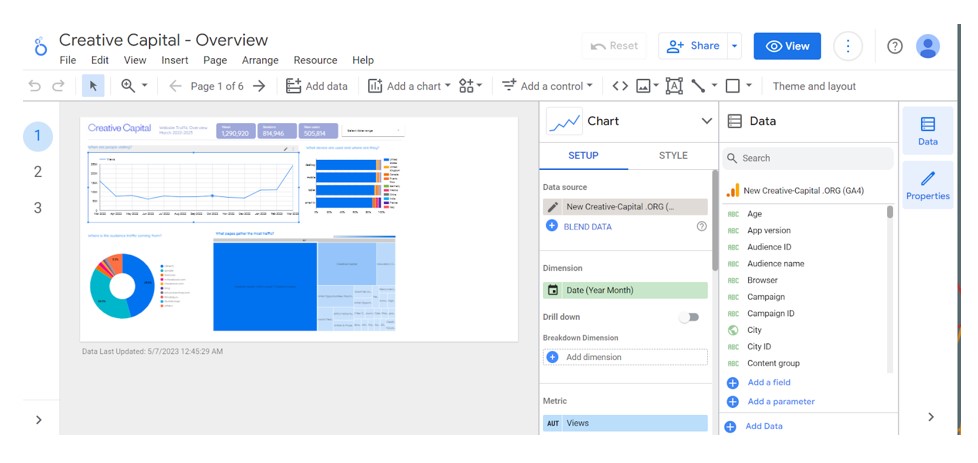
Entering this second half of the project, and using the above client feedback, we proceeded with adding a GA path exploration for their Support Page to our analysis, as well as a whole Studio Looker dashboard dedicated to analytics about Creative Capital’s Support Page. Finally, after dividing the analysis, in one of our own weekly meetings, we were able to clearly see and state our findings, from which we moulded our recommendations. Overall, we broke down our recommendations to those for the website and those for Instagram engagement, and the results were the following:
Big Picture
Overall, it is important to highlight some big picture elements that stood out.
Some things that worked well already:
- Journal posts are both high traffic pages and common jumping points to the rest of the site
- Cadence of posts and variety of content maintains freshness of website
Was surprised to find out that Creative Capital was not already using Google Analytics, as it proved to be our most useful tool. It offered great insight in audience behaviour on the website and the low traffic of some of the pages.
Finding 1: Path Exploration reveals low traffic to Support page
Through the Universal Analytics (Google Analytics 3) website data, we noticed that from March 2022 to March 2023, only 1,119 users viewed it out of the total 1,290,920 website viewers, which translates to only 0.09% of total website visitors accessing the Support page.
Using the new Google Analytics 4, we employed a path exploration and found:
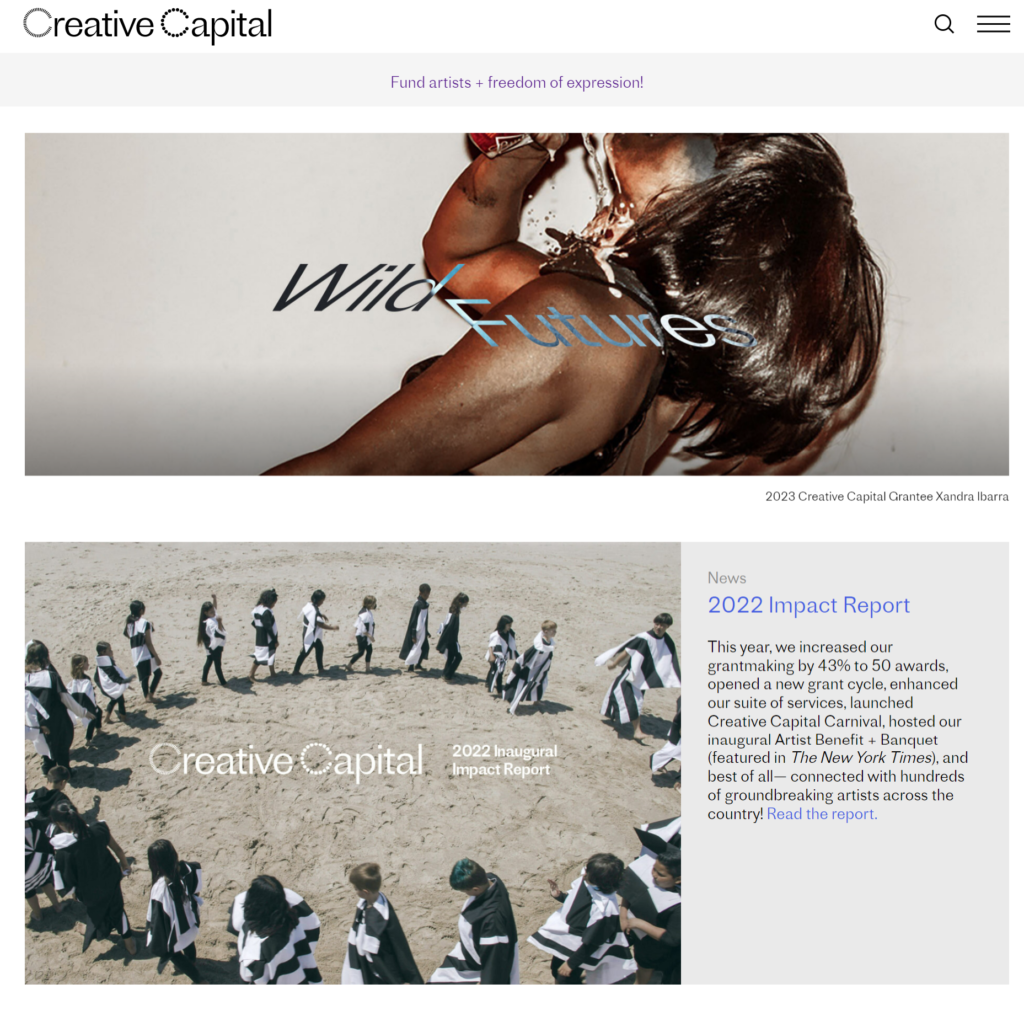
- the top two most popular pages during this time were Creative Capital’s Wild Futures, with 75,738 sessions, and the homepage, with 33,260 sessions.
- In each case, only 0.12% and 0.26% respectively, then clicked through to the Support page.
- Similarly, in the case of the Support page being the third page a viewer visited, less than 0.38% of users reach it.
Simultaneously, as seen in the following graph, the majority of external traffic is sourced from direct links. This is particularly true for new website users who are specifically seeking to support Creative Capital.
Finding 2: Findability of Support page is hidden by support posts for social causes
Among the four title pages under “Organization” on Creative Capital’s website, the Support page receives the second fewest page views. Between March 2022 and March 2023, the Support page received 1,017 views, about 7% of the page views received by the Board & Staff page.

Additionally, the word “support” is used in different contexts, causing confusion for users seeking to financially support Creative Capital. The Support page does not appear in search results when users search for “support” internally, further impacting its discoverability. The Donate page is more prominently featured when users search for “donate.”
Recommendation: Use “donate” to refer to financially supporting Creative Capital & place donate button in footer
Use of “donate” to refer to financial support for Creative Capital can help distinguish posts and pages for donations from those for supporting artists or supporting social causes.
Consider adding the donate button into the website footer so that users have the ability to navigate to the Donate page from anywhere on the site.

Mock up of updated footer with donate button and website navigation.
Finding 3: Donate page lacks impact metrics and visible social media share button
The Creative Capital Donate page lacks specific impact metrics and success stories that showcase the organization’s outcomes and encourage donor contributions. The page also hides the social media share button, which could increase visibility and reach.
Recommendation: Highlight impact metrics and improve donation page layout
To improve the donor experience and increase support, it is recommended to include specific impact metrics and success stories on the Donate page. Providing tangible examples of the organization’s impact can motivate potential donors.
Additionally, making the social media share button more visible by default can encourage users to share the page and increase the organization’s visibility.
Finding 4: Surge in Instagram engagement in April 2022 due to dynamic content
Instagram engagement for Creative Capital was significantly higher in April 2022 compared to other months. The use of visually engaging content, videos, carousels, and timely themes such as Earth Day contributed to higher engagement rates.
Recommendation: Utilize dynamic content and data monitoring for Instagram engagement
To sustain and enhance Instagram engagement, Creative Capital should continue incorporating visually engaging content, relevant hashtags, and themes related to environmental challenges. Videos and carousel albums should be further explored as successful formats. Captions should be improved to be concise and attention-grabbing. Capitalizing on timely themes can also boost engagement rates.
Recommendation: Implement Google Analytics optimizations for future analysis
To improve data tracking and analysis, it is recommended to implement event tracking for key call-to-action buttons, campaign tracking for social media posts, and GA ecommerce for the Donate page and transaction pages. Proxying traffic from donate buttons through the website can help accurately track traffic to the third-party Donate page.
Conclusion
Our project came to an end when we presented and sent our report to our clients. During our 30 minute deep dive into our dashboards, it became clear that they will be able to benefit from keeping them alive and use them for their own quarterly metrics. However, our Creative Capital contact did point out some inconsistencies in our Instagram dashboard and requested some further explenation. It’s worth noting that her comments were completely understandable and it was frustrating that we had not noticed those things in advance.

Instagram data gathered from Supermetrics

Google Analytics 4 Exploration Space

Looker Studio Dashboard Space
To summarize, I am grateful for this project teaching me more technical skills in relation to GA, Studio Looker and Supermetrics, to the point of feeling comfortable with them. Even though I am not interested in getting professionally invloved with digital analytics, a real life experience like this exposed me to clinet-based projects and the importance of communication and feedback.