Anna E. Feldman, M.S. Data Analytics & Visualization ’23
Project Overview
Our client, Smithsonian Associates, is a cultural organization that functions as the educational programming arm of the Smithsonian Institution, producing numerous events annually and providing learning opportunities to people of all ages through events and courses in the arts, cultures, and global history. Our study with them aimed to inform future product features on their site based on product popularity, as well as provide data-driven recommendations to improve site performance and assist in the transition to Google Analytics 4.
Timeline
6 weeks from March to May 2023
Team
Brianna Casas, Katherine Duval, Medhaswi Paturu, Victoria Haber
Tools
Data pulled from Google Analytics (Universal and GA4); Charts and Dashboard produced in Looker Studio; Project management and team organization hosted in Google docs, sheets, and slides
My Role
Built GA4 and UA Dashboard pages in Looker Studio, highlighting key metrics in both instances alongside changes incoming with GA4, and incorporating input from team members and professor
Wrote “Product Performance” section with findings, charts, and recommendations and helped edit full report draft
Initial organization (created group message, initial client emails, shared drive and report template, meeting notes) and helped project manage generally throughout the project lifespan
Defining Shared Goals & Project Scope
Our team of five kicked off this web analytics evaluation project with an agenda-setting meeting together before meeting with the Smithsonian Associates representative to discuss their mission and goals for this study. From Smithsonian Associates, we learned that the organization boasts a healthy ecommerce site, with tickets frequently selling out for their online educational course products. For this study, they were especially interested in identifying top performing products as well as generally learning more about user behavior and user journeys across the site. They, like so many other organizations, are in mid-transition from using the Universal Analytics instance of Google Analytics, which will cease functioning this July, to the new instance of Google Analytics 4. We kept this transition in mind as we made all of our recommendations below.
With our client, we identified four priority research areas:
#1 – Identifying most popular products and course subjects
#2 – Assessing possibilities to expand target audience demographics
#3 – Mapping out user journeys (entrances, exits, etc.) and landing page experience
#4 – Transitioning platforms from Universal Analytics (UA) to Google Analytics 4 (GA4)
Investigating User Journeys & Ecommerce Experience
What Does Google Analytics Data Say About The Objectives?
We noticed right away that Smithsonian Associates’ existing website analytics already showed good performance related to several metrics, with both high traffic to their landing pages and a steady stream of revenue from both new and returning visitors via a combination of donation-based memberships and ticketed course offerings. Though most of their page performance and user behavior data had already been transitioned to GA4, the bulk of historical data on their users and all ecommerce data remained hosted on Universal Analytics. With that in mind, we focused on our findings on data gleaned from UA, then built a dual dashboard in both UA and GA4 to compare the two instance of Google Analytics. Studying these metrics in detail from March 2022 to March 2023, we identified several areas of the site that could be further improved, particularly around streamlining visitor experience and increasing product performance.
Our resulting findings and recommendations included:
#1 – Improving landing page experience by optimizing page load times and ensuring content relevance.
#2 – Ensuring device-responsive site design, given the disparity in bounce rates and purchases between mobile and desktop users.
#3 – Addressing weaker-performing products, fine-tuning ecommerce tracking, and investing in paid search and email marketing to lead to increased revenue and customer acquisition.
#4 – Simplifying the checkout process, targeting repeat customers with customized campaigns, and fixing high bounce rates from specific traffic sources in order to improve purchasing habits.
#5 – Transitioning all data to GA4 and familiarizing with GA4 well before the July deadline.
Landing Page Experience: Addressing Bounce Rate Challenges
Our Findings:
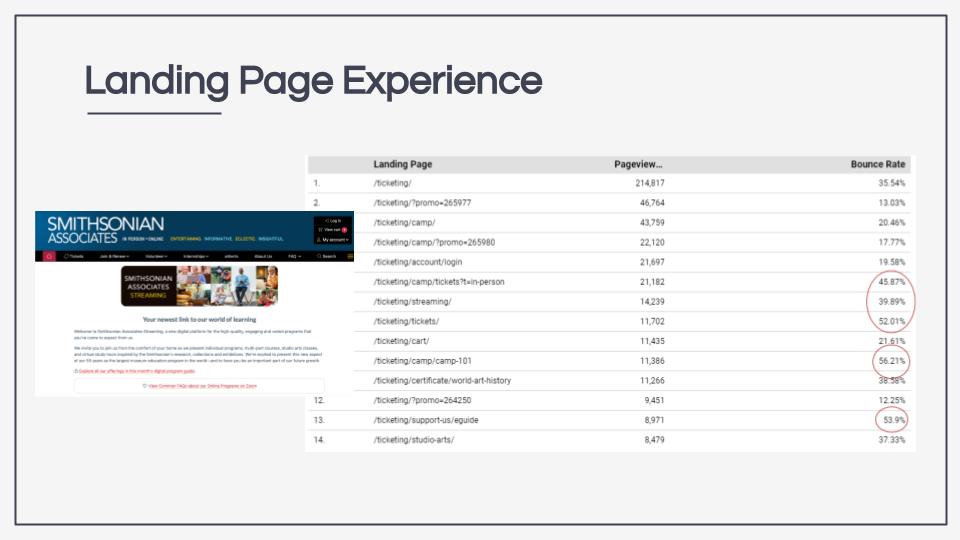
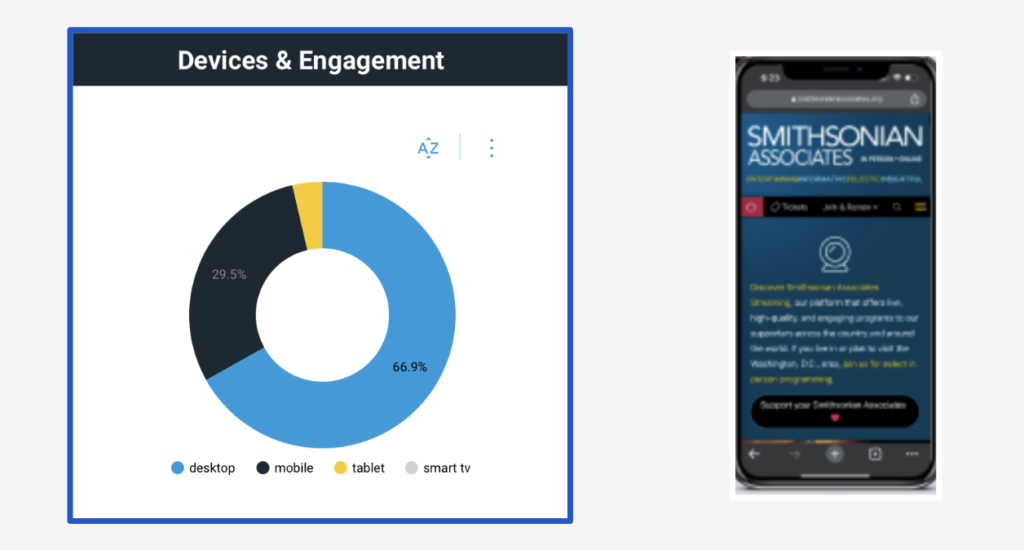
#1 – We found a strong correlation between slow load speeds and high bounce rates for pages that receive a significant amount of traffic, and a higher bounce rate on mobile compared to tablet and desktop users, alongside a higher purchase rate on tablet and desktop users.
#2 – Relatedly, perhaps, we found that the top landing pages are also users’ top exit pages.
Our Recommendations:
#1 – Improve landing page content by conducting audience research and user testing to address bounce rate and load times. Consider an SEO audit of the sites and/or user research to understand what content is engaging and clearly communicating products’ unique selling points.
#2 – Address higher bounce rate on mobile devices and increase purchase rates on mobile by ensuring a site-responsive design and optimizing mobile experience.
Product Performance: Assessing Donor v. Course Product Revenue
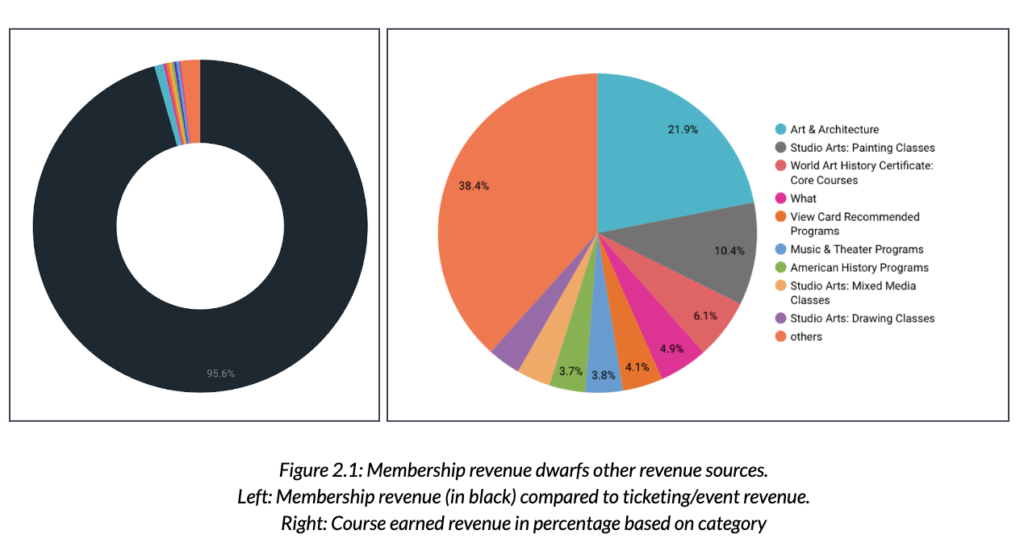
Our Findings:
#1 – We identified the top four revenue-generating products over the year: “Circle of Support,” “Contributor,” “Associate,” and “La Grande Fete 2023,” all of which are either donor/membership (Circle, Contributor, Associate) or special annual event (La Grande Fete) categories.
#2 – Outside of these member and donor-based products, the top revenue-generating products fell under the Art & Architecture category.
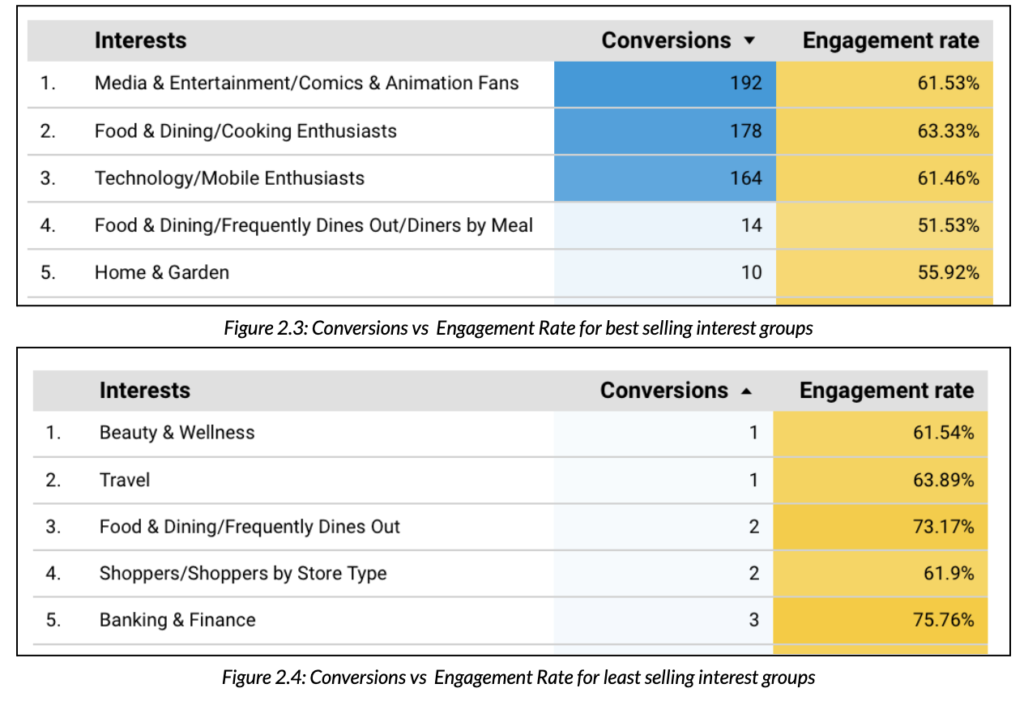
#3 – All product interest groups have consistent engagement rates, which does not reflect equally in conversion rates, which are starkly higher in some categories (e.g. Media & Tech) than others (e.g. Beauty & Wellness.
Our Recommendations:
#1 – Analyze the target audiences for the categories and create promotional paths for these segmented audiences strategically based on user behavior and demographics. For instance, promoting “Photography” classes for users who have displayed interests based on interest activity on the website. This can be used to feature personalized course recommendations for users as well.
#2 – Feature courses targeted to specific users on various parts of the website such as Ticketing and Landing pages and promoting on social media to build more traction to these courses.
Acquisition & User Behavior: Spotlight on Paid Search & Email Marketing
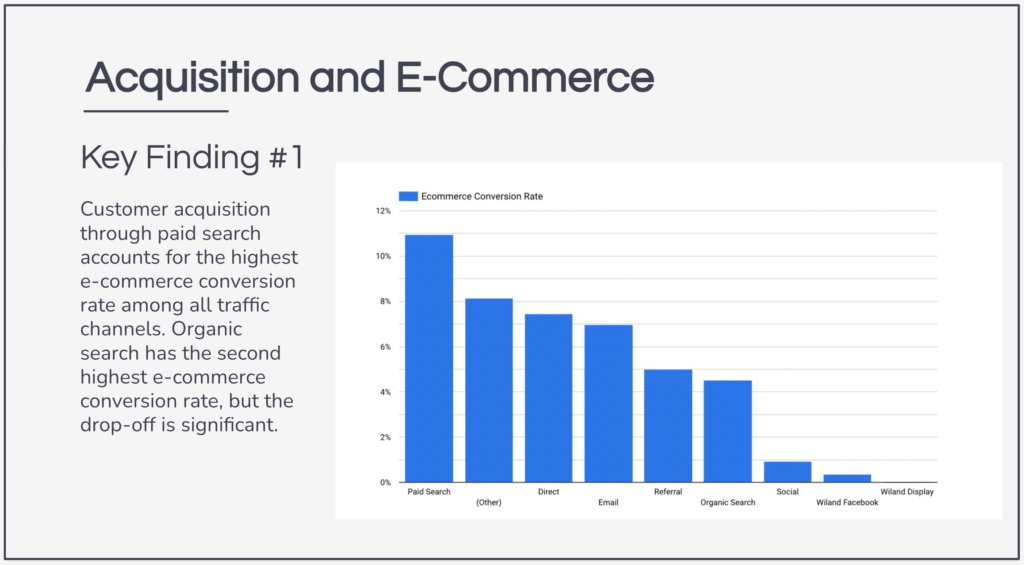
Our Findings:
#1 – Customer acquisition through paid search accounts for the highest e-commerce conversion rate among all traffic channels. Organic search has the second highest e-commerce conversion rate, but drop-off is significant.
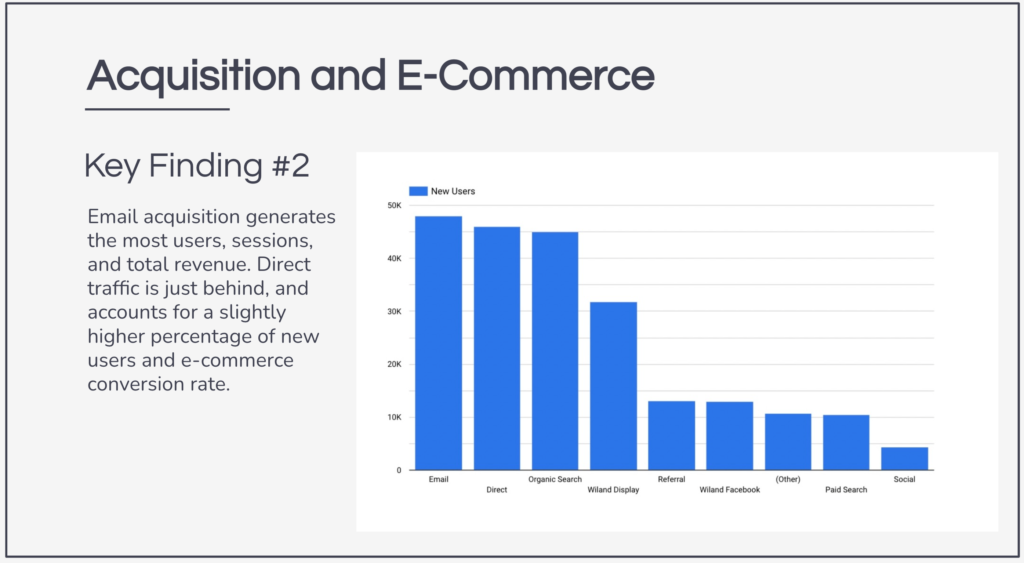
#2 – Email acquisition generates the most users, sessions, and total revenue. Direct traffic is just behind, and accounts for a slightly higher percentage of new users and e-commerce conversion rate.
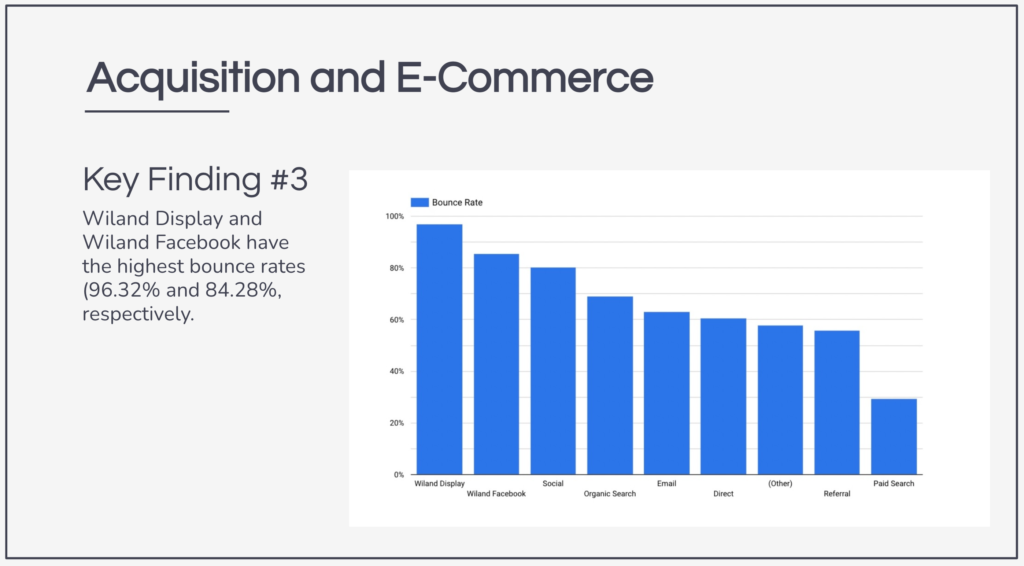
#3 – Wiland Display and Wiland Facebook have the highest bounce rates by far over the other acquisition channels (96.32% and 84.28%, respectively).
Our Recommendations:
#1 – Invest more in paid search and increase email marketing campaigns. Investigate the source of and ways to effectively track direct traffic further.
#3 – Consider moving away from marketing associated with Wiland Display and Wiland Facebook due to high bounce rates.
Purchasing Behavior: Simplifying Process & Incentivizing User Segments
Our Findings:
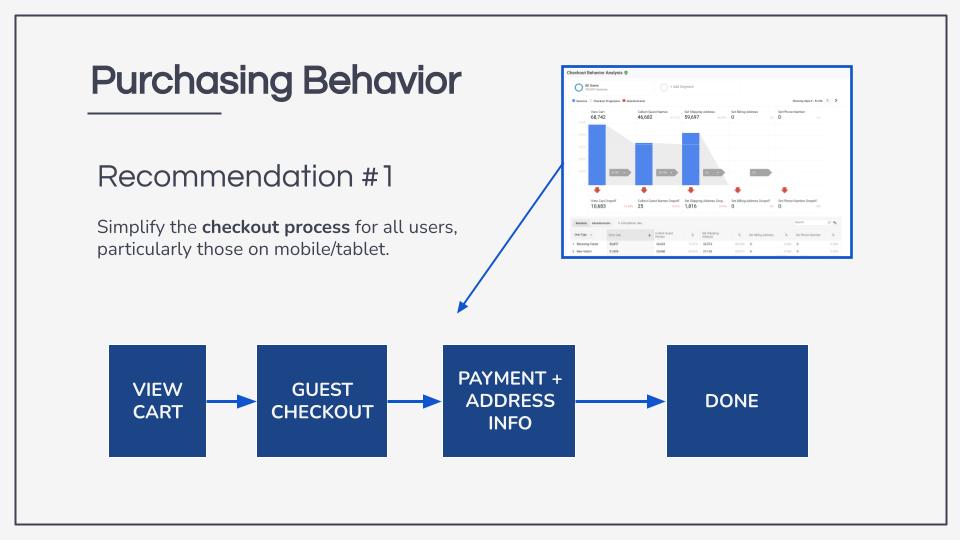
#1 – The checkout process produces barriers to completing purchases. From March 1, 2022 to March 1, 2023 only 62% of users made it past the first step of checkout.
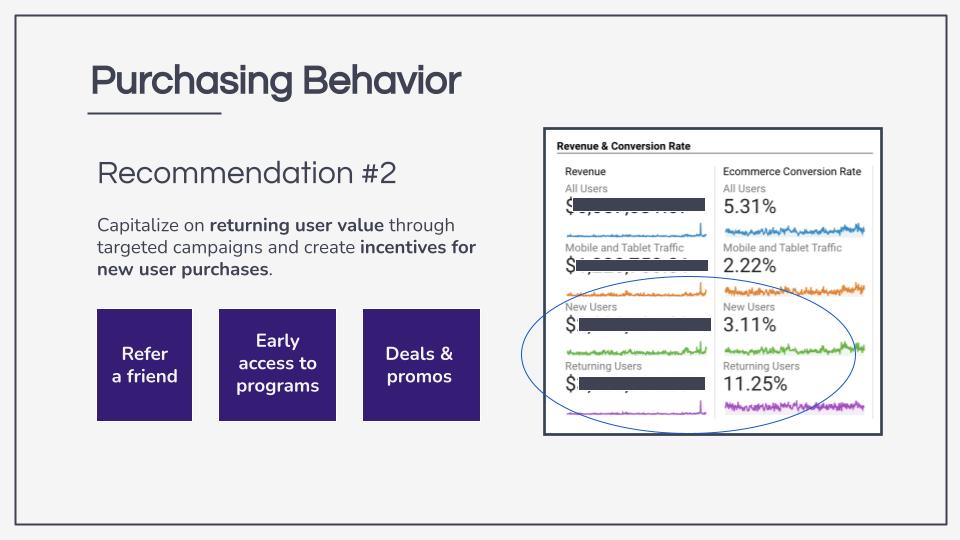
#2 – While there are more new users than returning visiting the site regularly, the returning user segment brings in more value (60% of total revenue) than the new user segment does (40% of total revenue).
Our Recommendations:
#1 – Address users’ cart abandonment rates by streamlining checkout. This could include eliminating the required login (offering a “guest checkout” option) and consolidating pages to create a two-step process (versus the current four-step checkout).
#2 – Capitalize on returning user value by targeting campaigns for returning users and creating incentives for new users. Consider adding a referral bonus for returning users referring new users from their networks, offering discounts, early event ticket access, or special additional “swag” to new users and for course products that are less popular and/or are not selling out quickly.
Transitioning to Google Analytics 4
With the transition to Google Analytics 4, the platform will see key changes to metrics dealing with tracking Users, Sessions, Conversions, Pageviews, and more. Since Universal Analytics will cease functioning this July 2023, we recommended familiarizing with and transitioning all ecommerce tracking to Google Analytics 4 as soon as possible. We also recommend creating additional conversions tracking and tracking unassigned traffic in GA4.
Building Dual GA4 / UA Dashboards
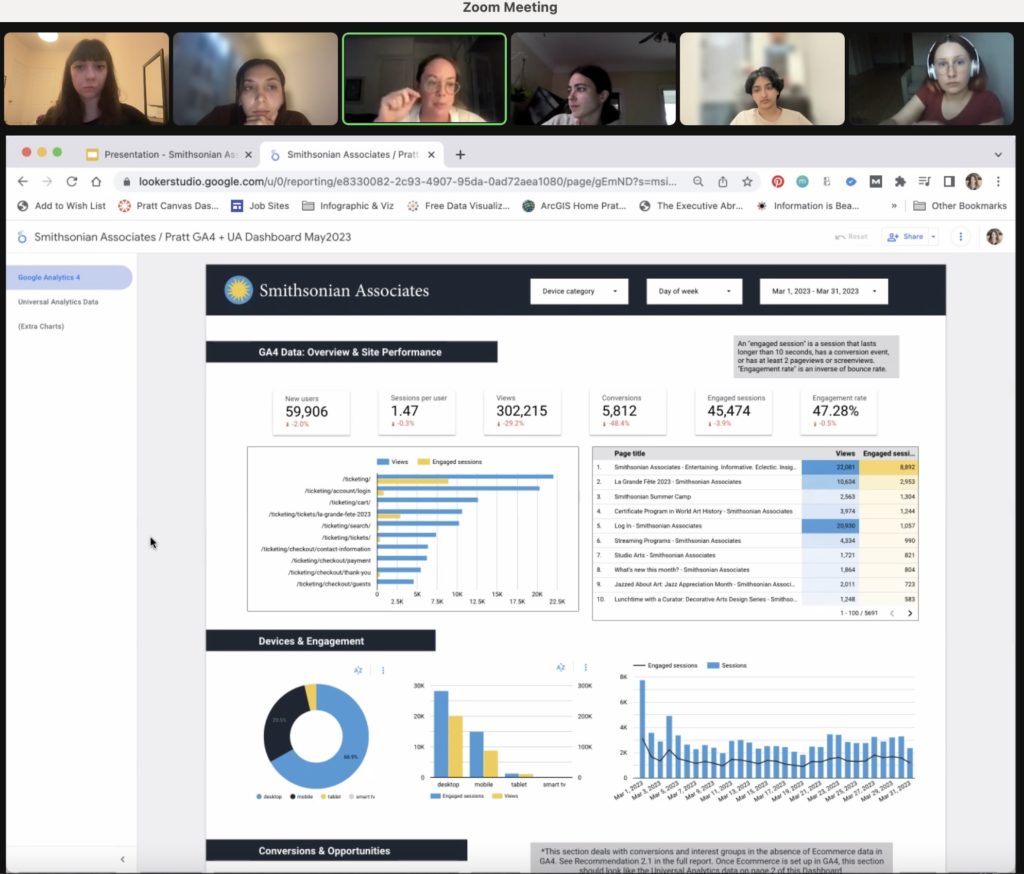
Since most, but not all, of their data had been transitioned already, I drafted both a GA4 and UA version of a dashboard on two Looker pages for comparison. Working on the dual dashboard taught me about several subtle and not-so-subtle alterations that GA4 introduces. Some of these changes that affected our analysis include GA4’s elimination of the “bounce rate” metric in favor of “engagement rate” (an inverse of bounce rate) and the introduction of “engaged sessions” as a new metric for measuring user activity and engagement.
To build the dashboard, first I studied our four main section areas and the key metrics and findings we chose to highlight. I then divided the dashboard(s) into sections, loosely based on the section areas, and added a filter at the top navigation to allow for filtering by date, device type, and the day of the week. Once I had a first draft, I ran it by the rest of the team and the professor for feedback and editing.
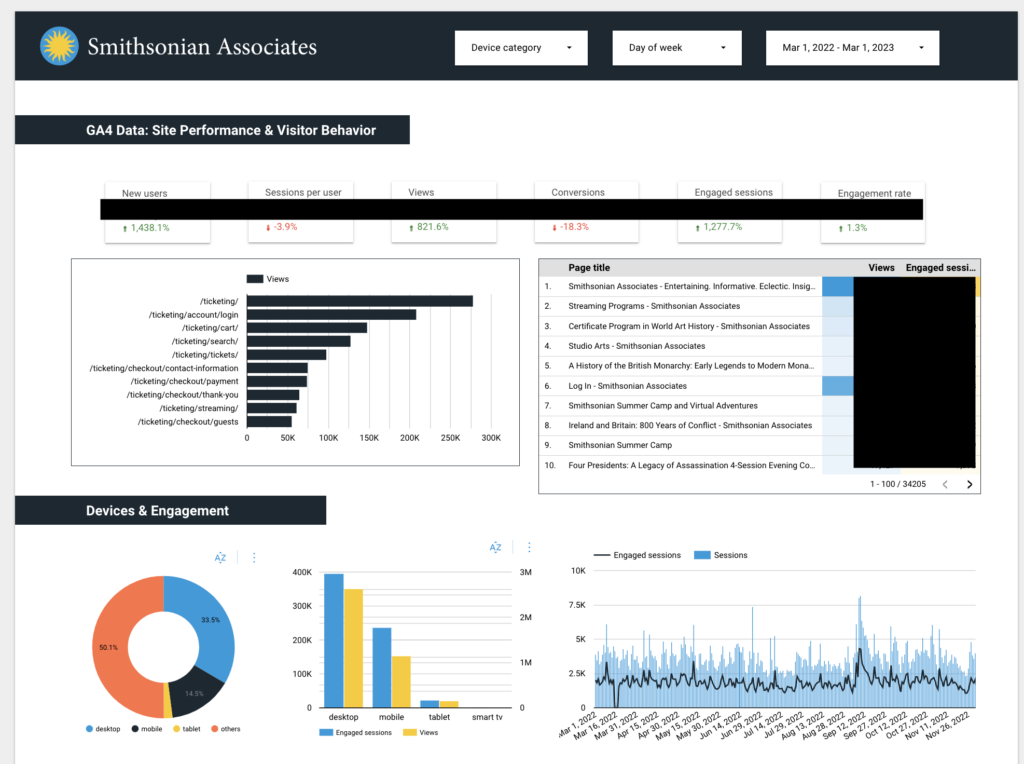
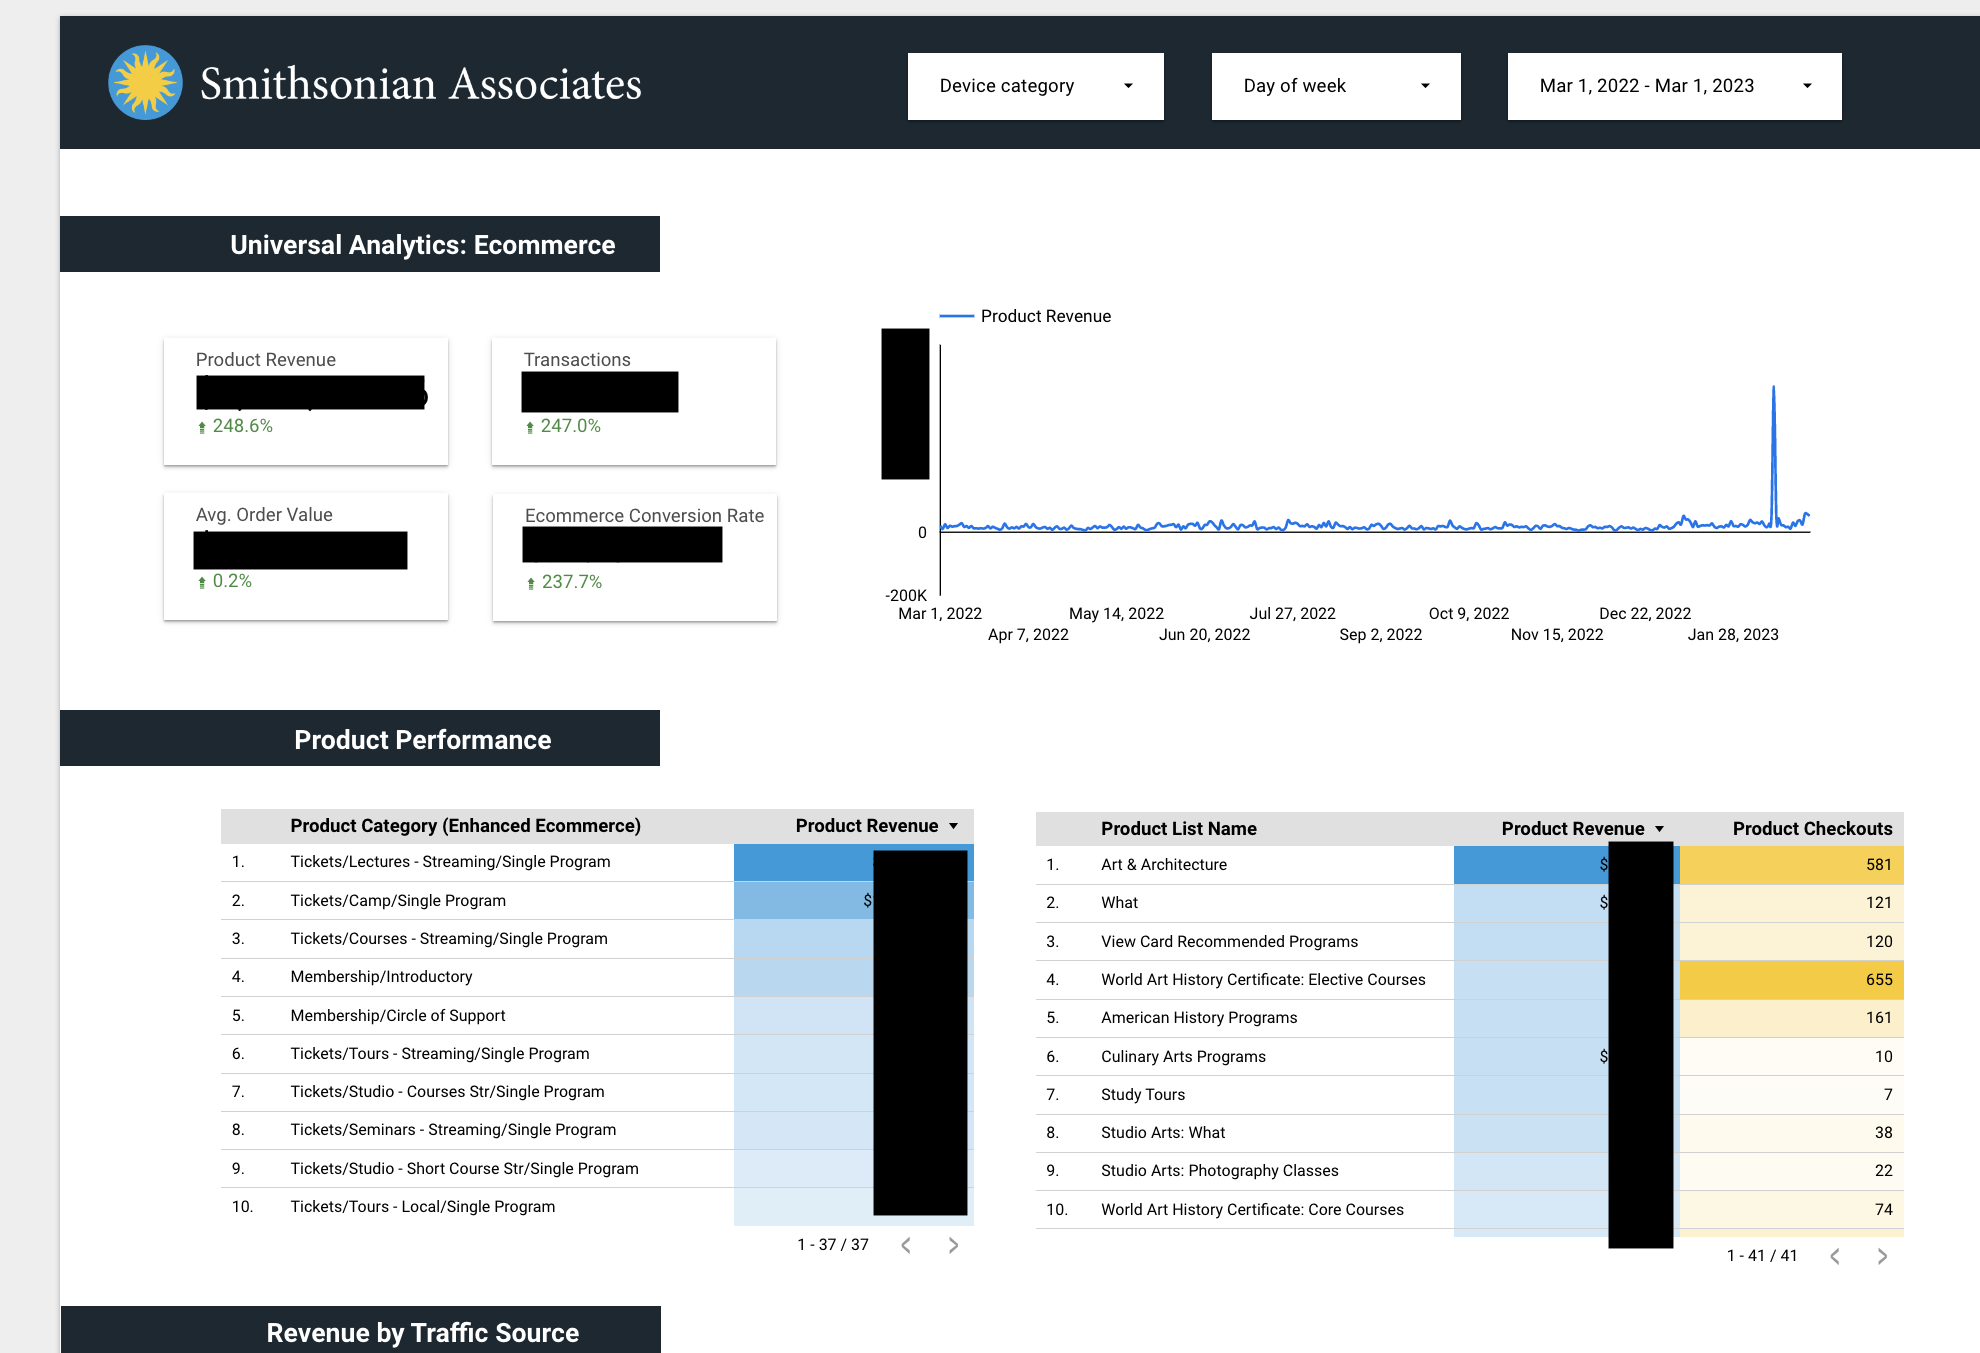
The final product can be seen above, filtered as a yearlong view. The GA4 dashboard (top left) includes both reflects our key findings from the past year, while providing a template for the Smithsonian team to review what transitioning their digital analytics to GA4 might look like. It includes an evaluation of engaged sessions alongside top viewed pages (see our Landing Page Experience findings above), a look at engagement by device category, and a deeper dive into conversion rates and interest groups (lower section, not pictured here).
The UA dashboard (top right) includes the crucial ecommerce data that has not yet been transitioned to GA4. It gives a high level metric overview, followed by a deeper dive into product performance categories (see our Product Performance section), and an analysis of revenue by traffic source (see Acquisition and Marketing section).
We shared this dual dashboard and our key findings and recommendations with our client in a 10-minute presentation, demoed the dashboards, and finally, shared it with them for editing and future use.
Takeaways
“Thank you for the links [to the dashboard and report] and for the excellent presentation! The analysis you provided is very interesting and informative. I’m looking forward to sharing with the rest of the team and applying your learnings to our marketing efforts.”
– Client comment after the team’s final presentation
Overall, Smithsonian Associates is thoroughly and effectively tracking a wealth of metrics through both instances of Google Analytics, though they will need to fully transition ecommerce data to GA4 from UA as soon as possible to avoid a sudden shift come July.
Since we looked at such broad focus areas, and we noticed that users got stuck in a couple of places (such as landing page and checkout), our research hinted at areas for further research, such as moderated user testing, that could inform site design changes.
Finally, our client let us know that they found the presentation helpful, thorough, and informative, and that they planned to bring it to their team for further discussion.
