The Bureau of Labor Statistics (BLS) is an agency of the United States Department of Labor. Its website is home to labor and economic data and data tools available for public use. This article serves to critique the general accessibility and usability of the BLS Popular Series Data Retrieval Tool.
Accessing Data Tools from the Homepage
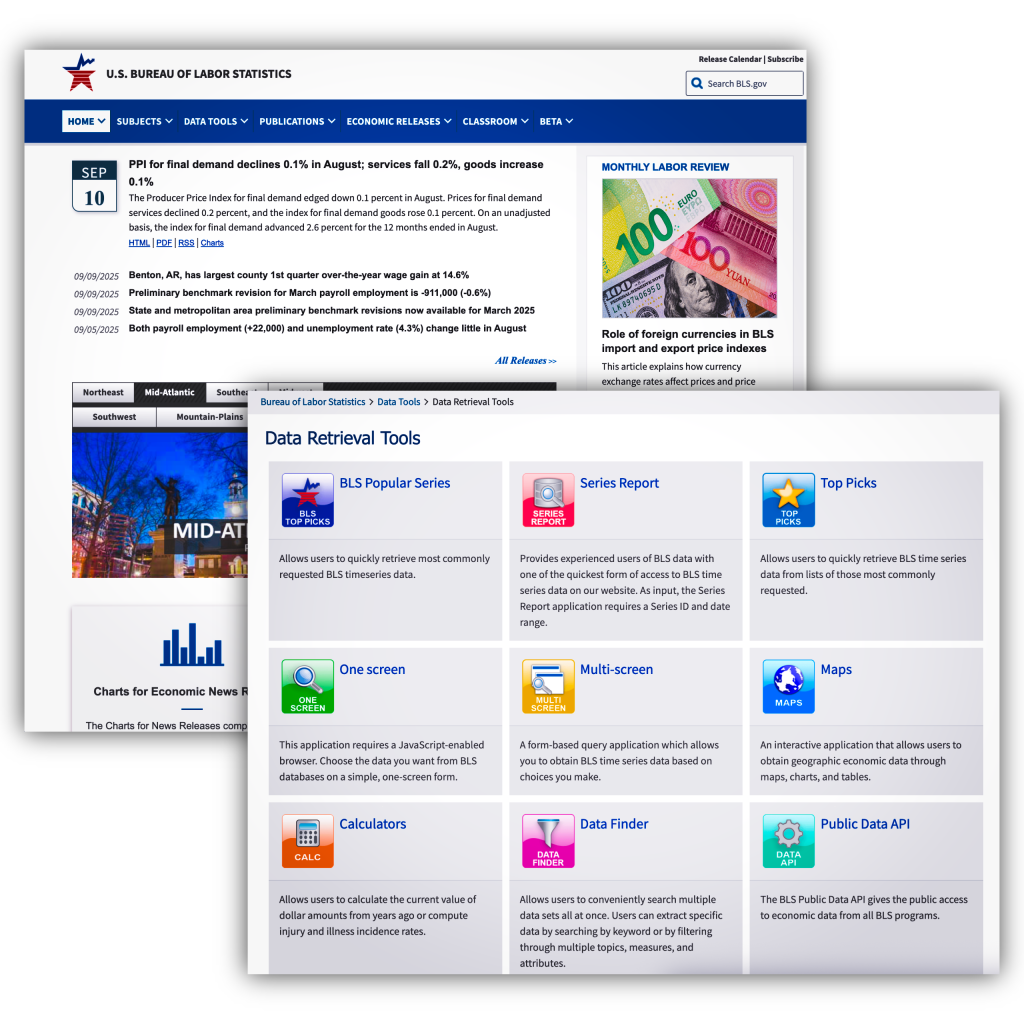
Upon arriving at the BLS homepage, the user is presented with a variety of information including a navigation bar, recent news or data releases, and specific data-finder tools. The sheer amount of information offers few constraints on the user’s possible interactions with the site, potentially increasing opportunities for confusion and distraction on the user’s part.
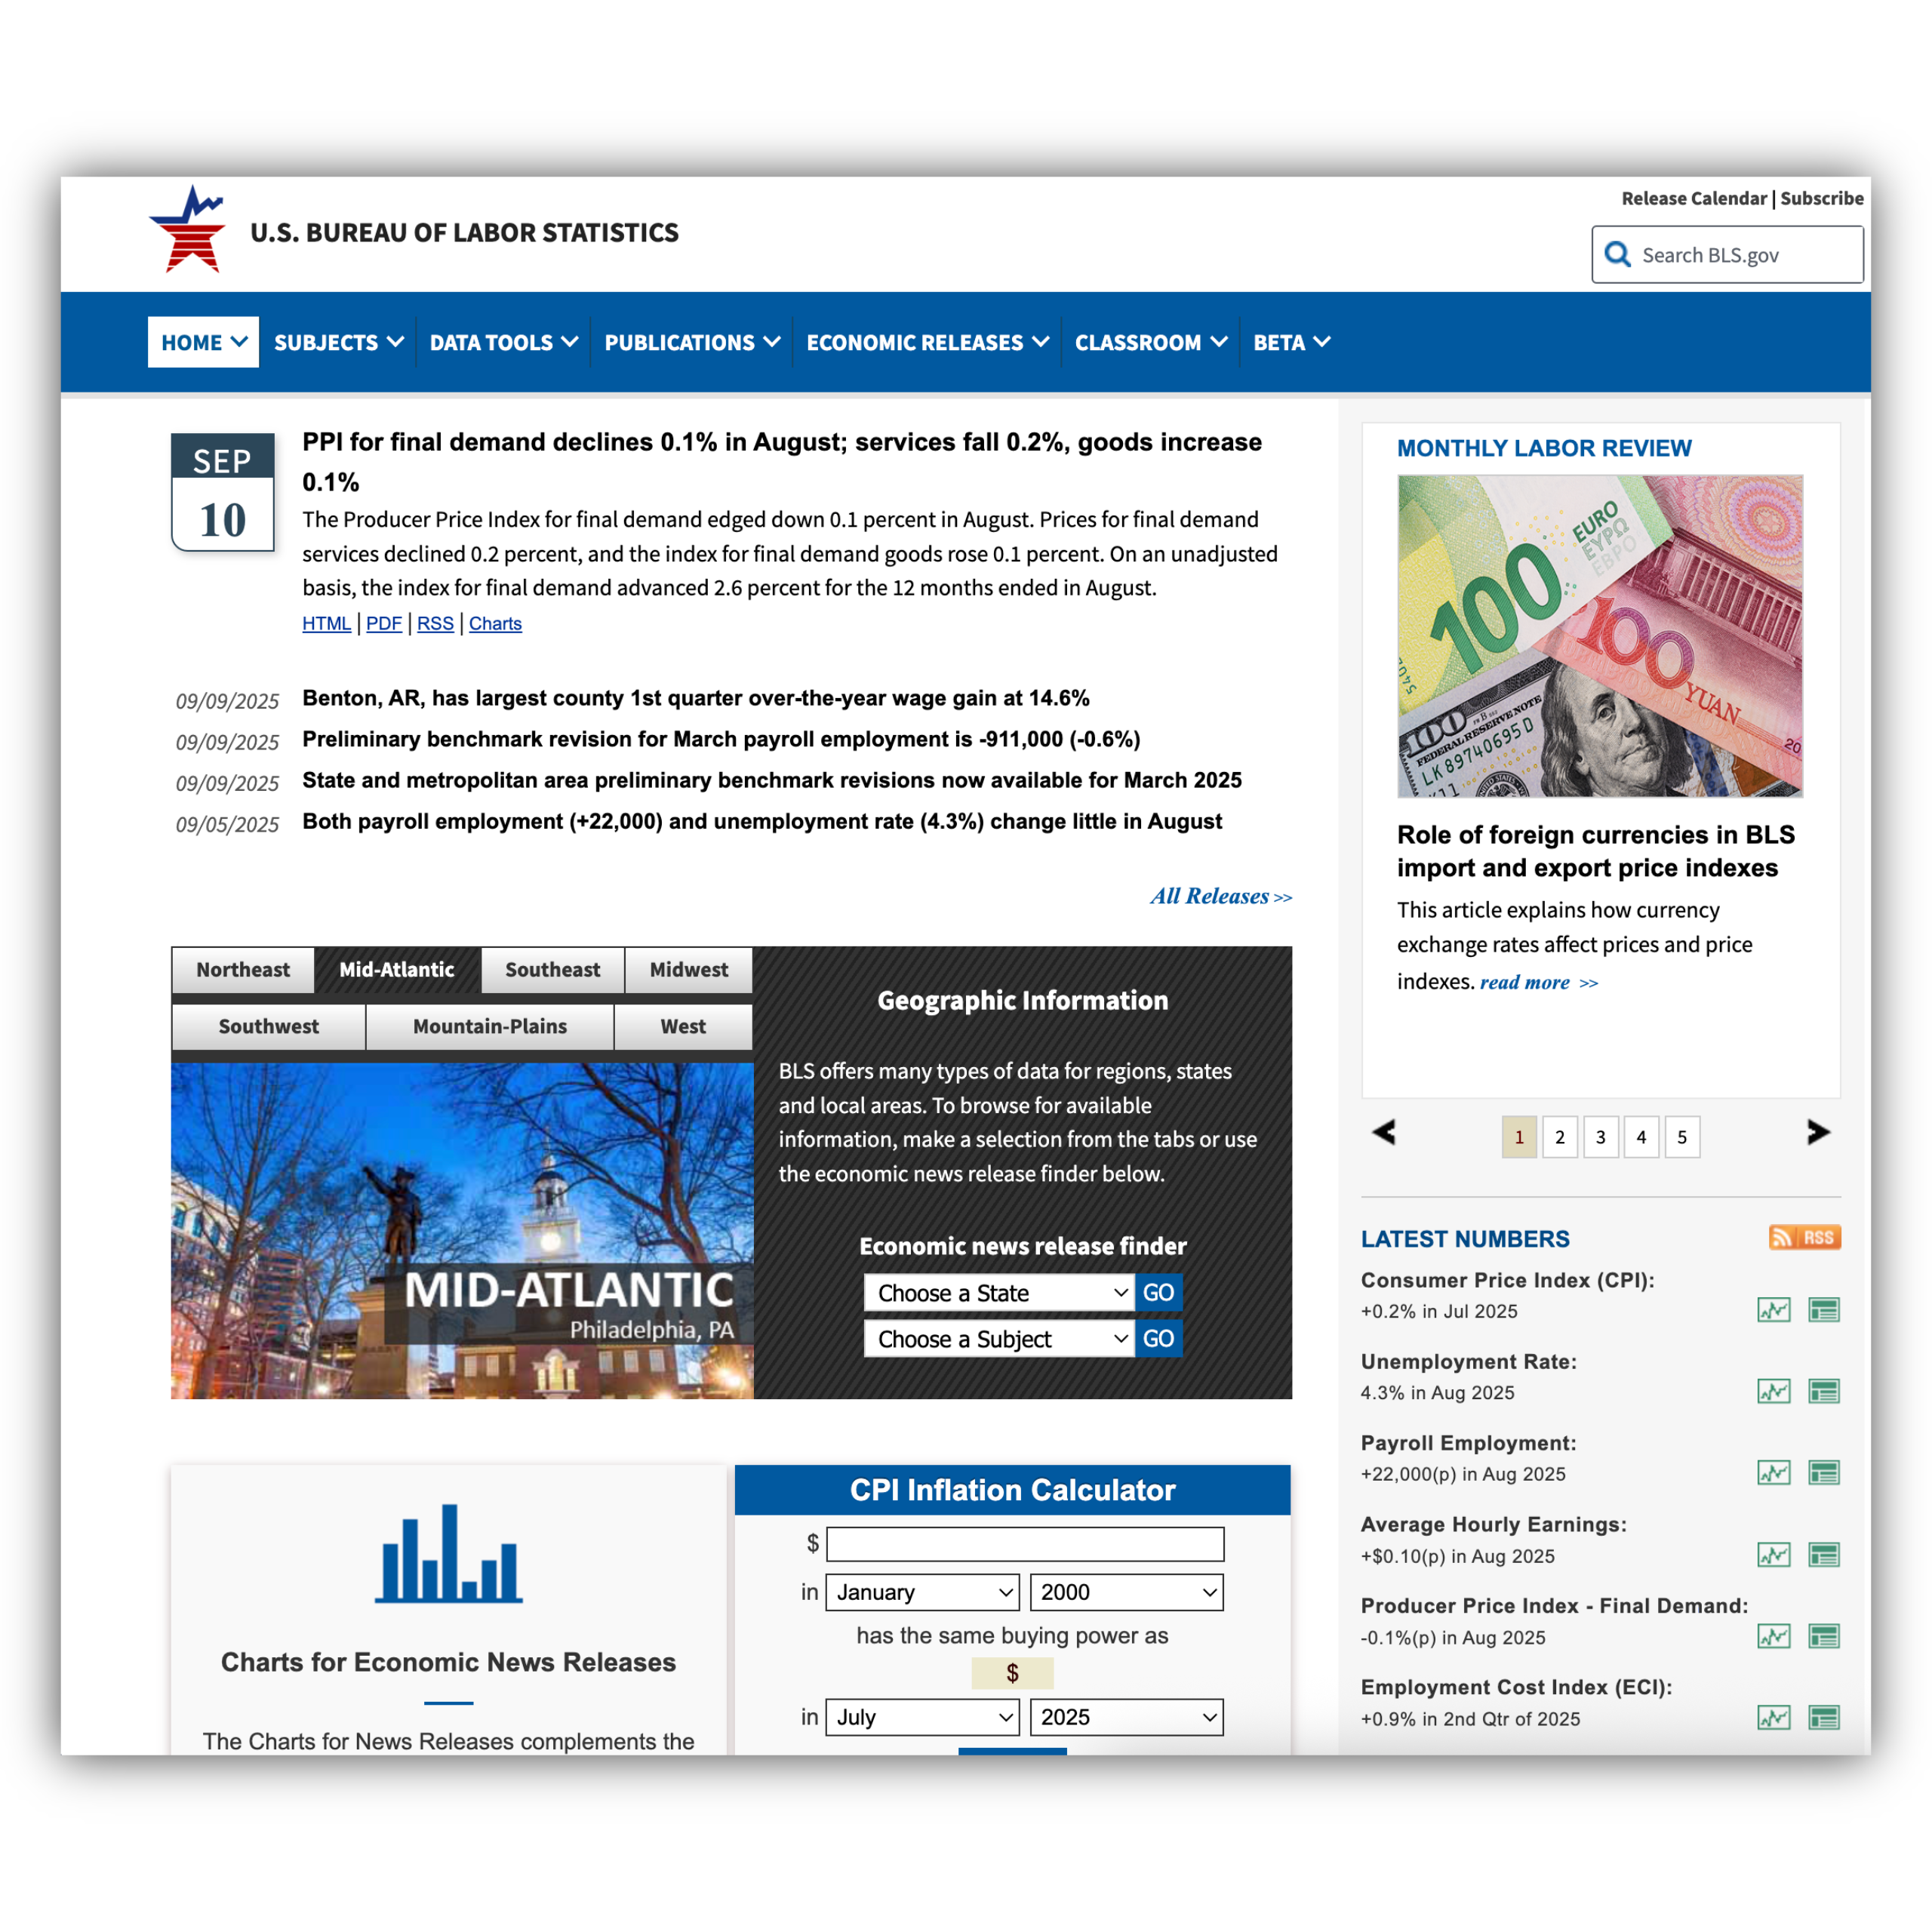
However, the site leverages a clear navigation bar and aptly named drop-down menus so that users can more easily access their desired tools. The navigation bar itself – a thick blue bar across the top of the page with each item in bold white typeface – is a helpful signifier for the user, visually suggesting that checking the navigation bar is a good place to start. From there, the user will discover that “Data Tools” is its own item in the navigation bar.
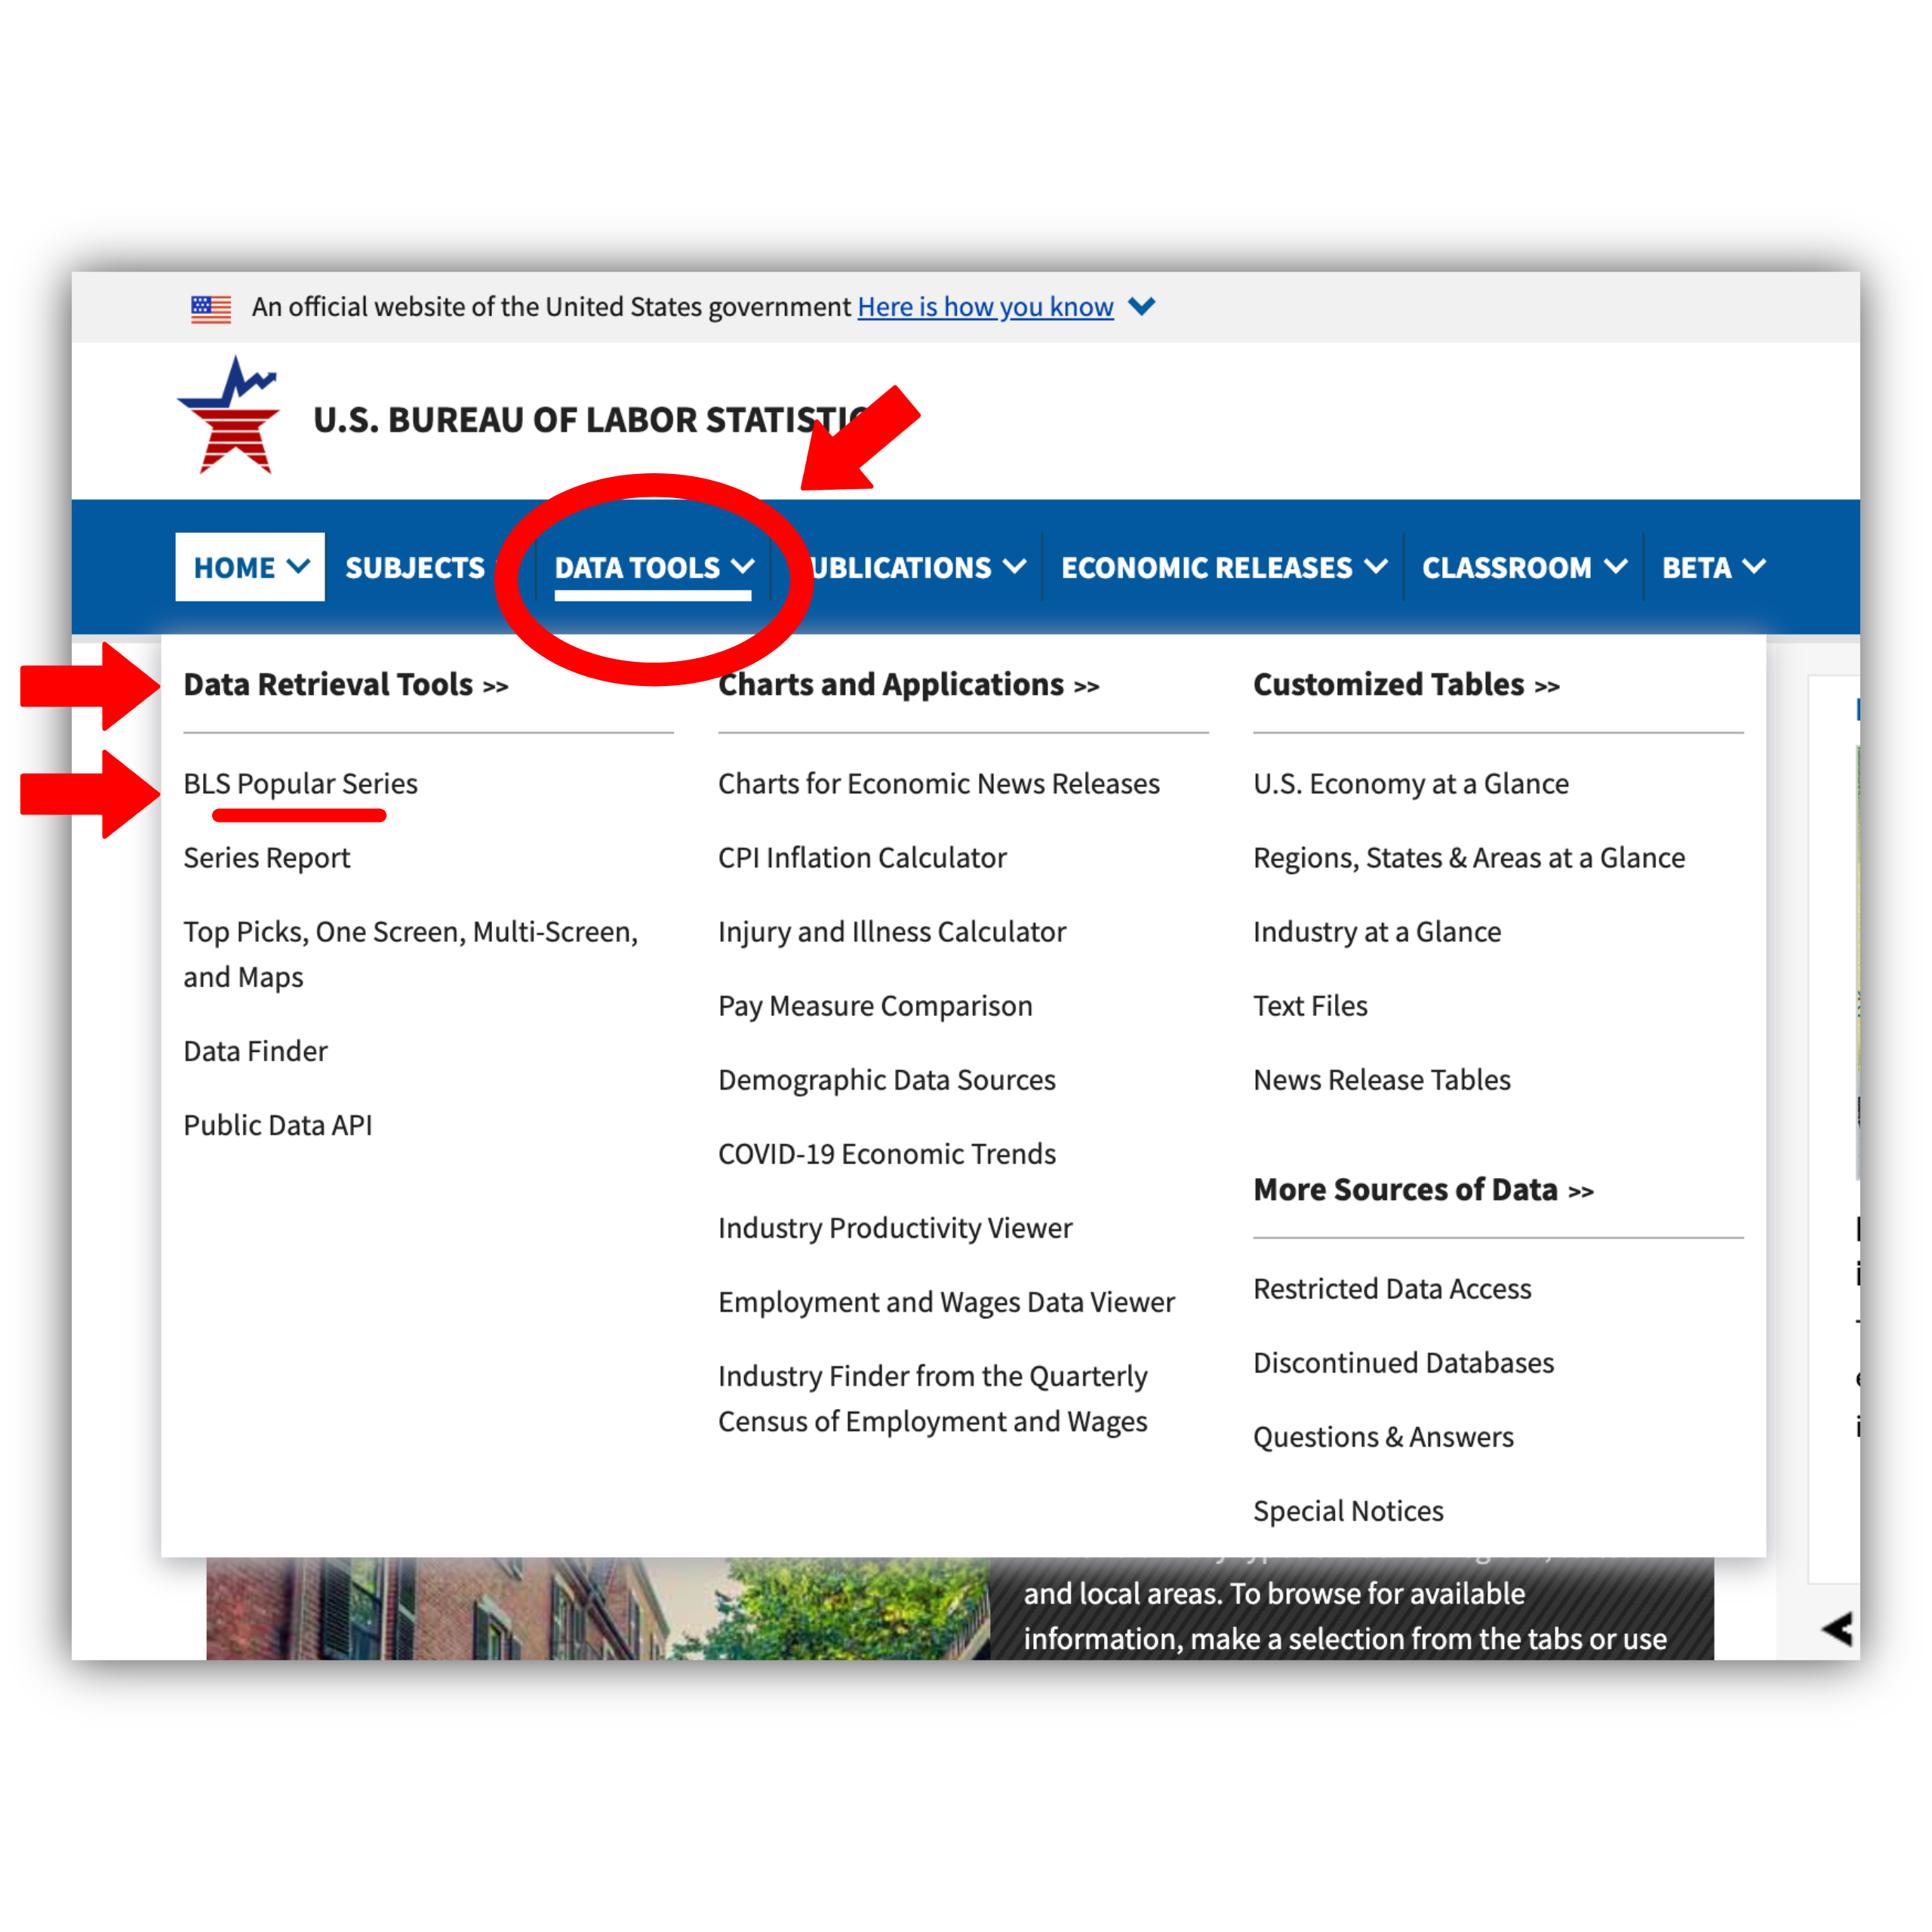
When “Data Tools” is selected in the navigation bar, a drop-down menu appears, signaling to the user that additional action is likely needed to get to the desired data tool. “Data Retrieval Tools” and “BLS Popular Series” are the first two options in the drop-down, further supporting discoverability of the Popular Series Data Tool.
Selecting Desired Data
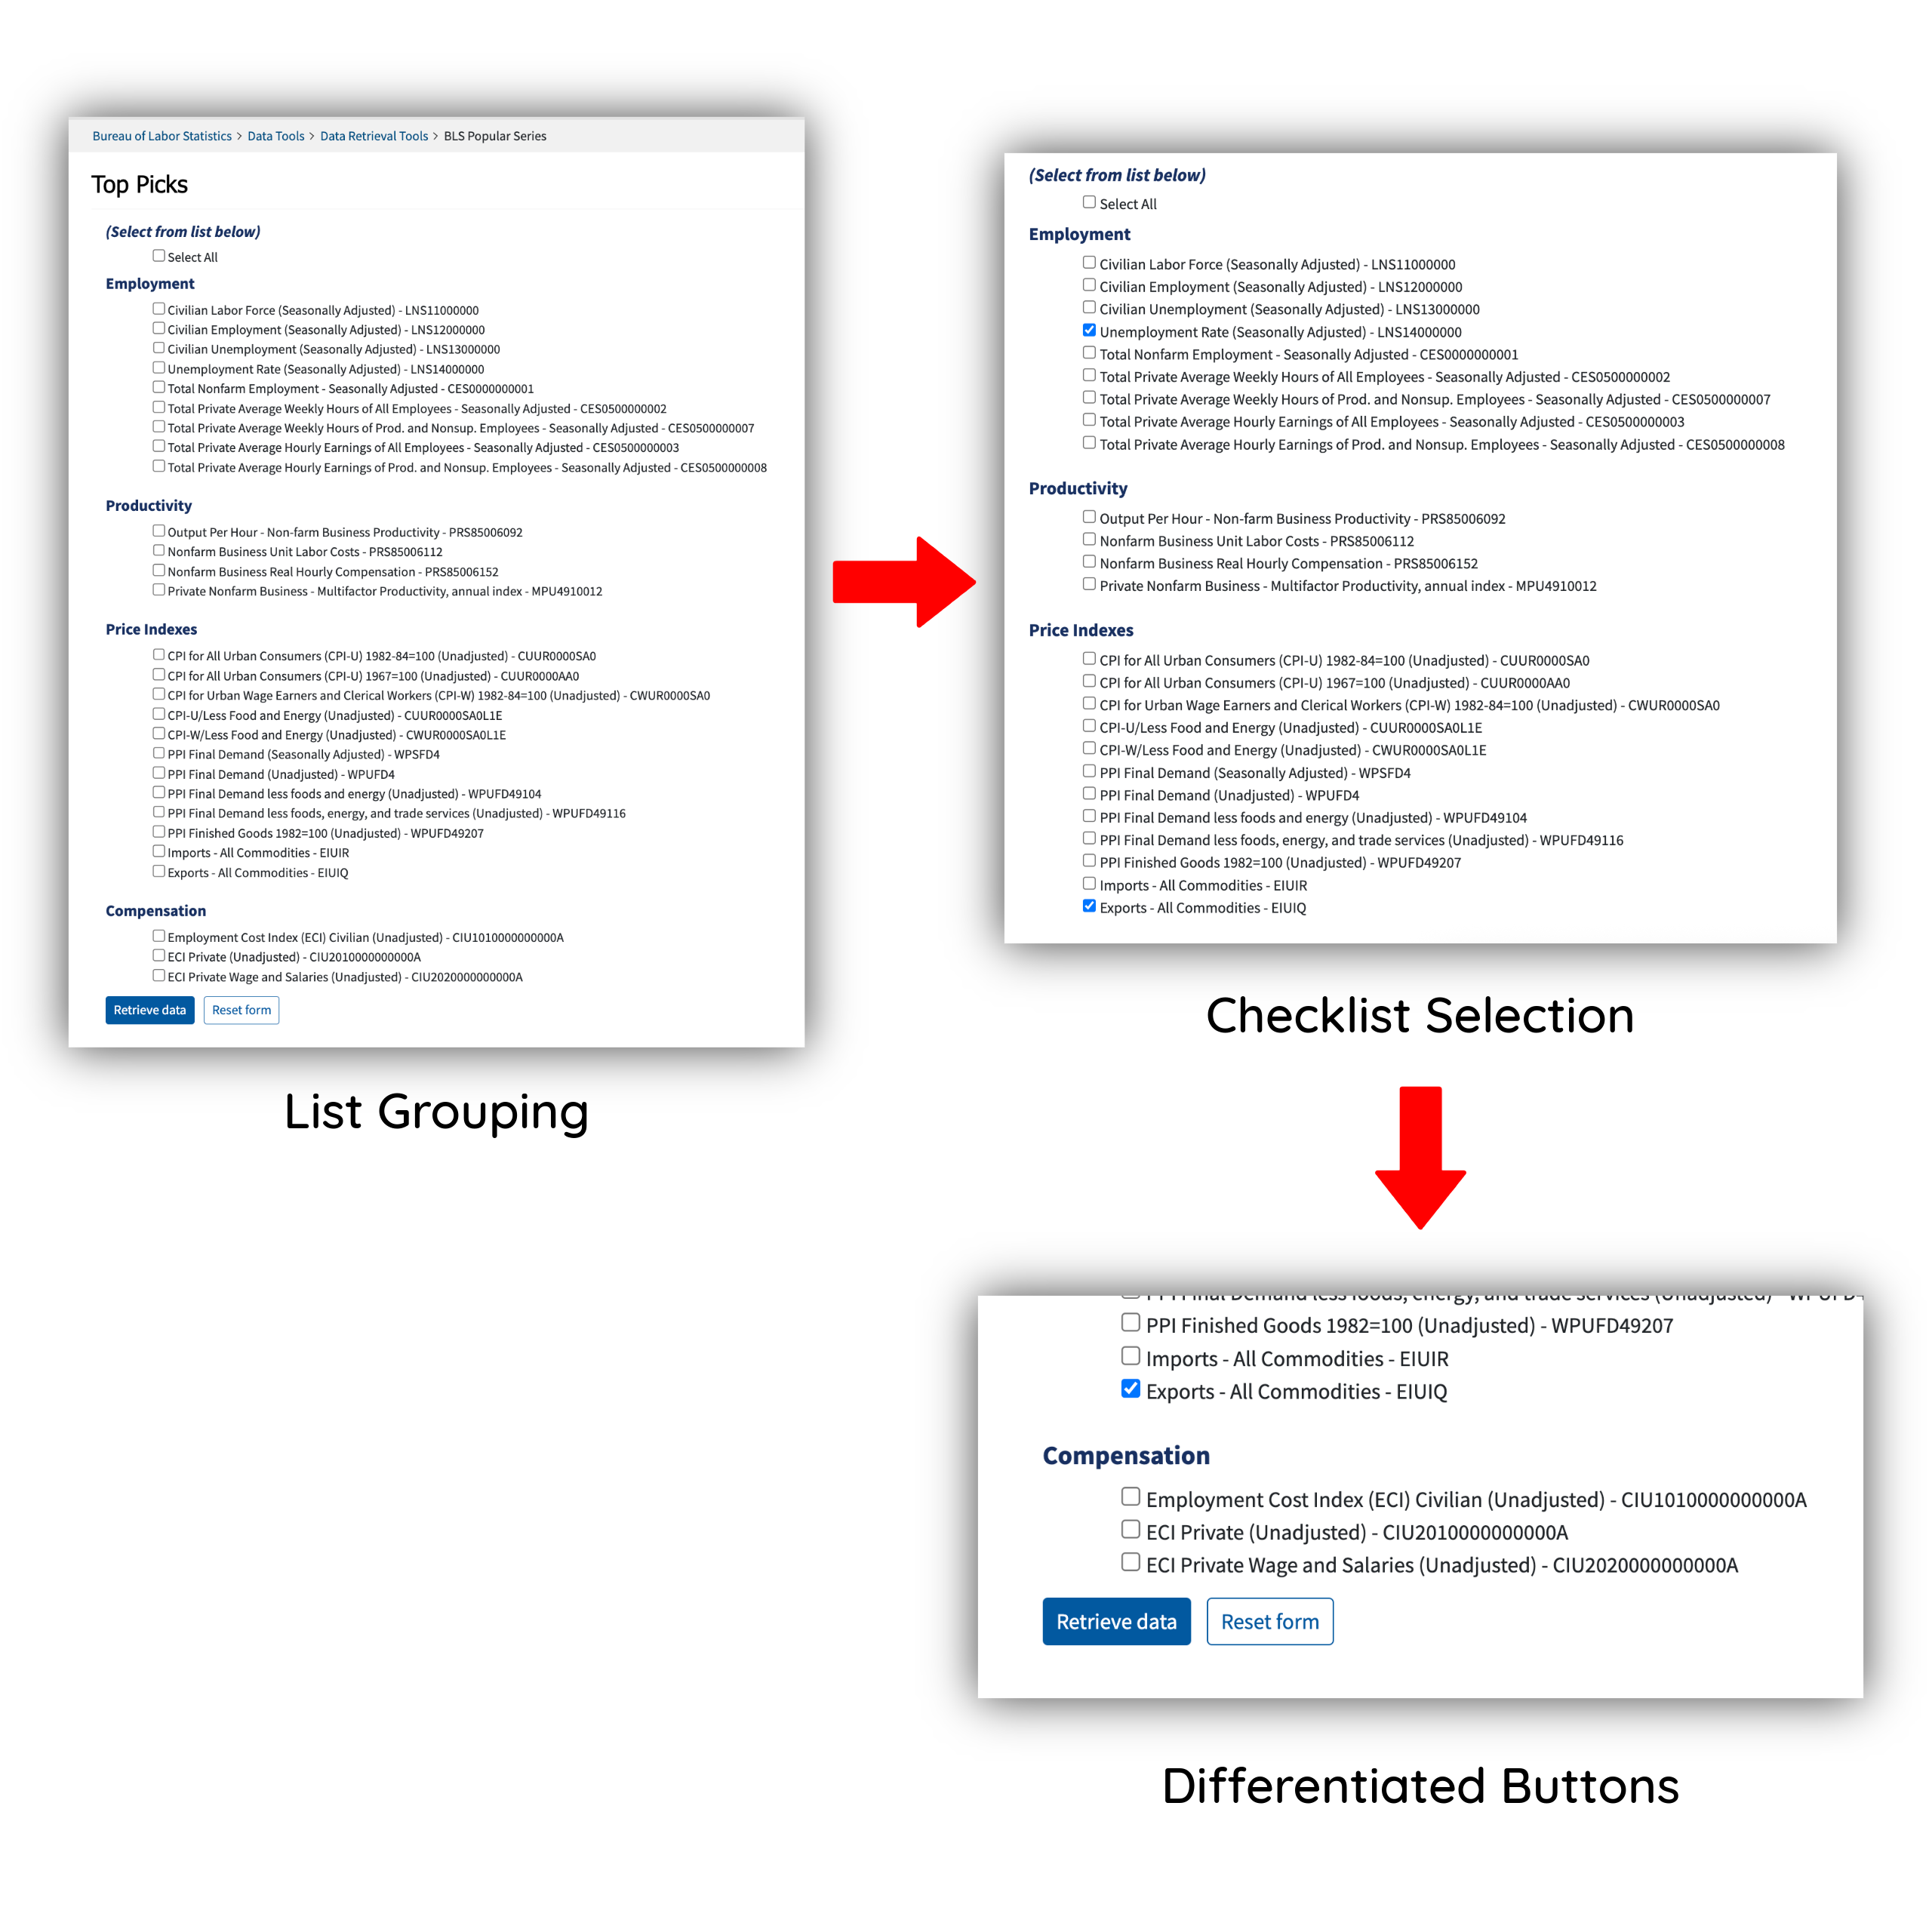
After selecting “BLS Popular Series” from the “Data Tools” menu, the user is brought to a “Top Picks” checklist outlining the most commonly searched-for sets of timeseries data. More than two dozen different sets of data are included, so list grouping and categorization aids the user here in identifying the desired set. Additionally, the list’s checkbox feature signals to the user that they are then supposed to select the desired data sets. At the bottom of the list are two possible actions: “retrieve data”, or “reset form”. The “retrieve data” button has blue fill and white text, and the “reset form” button has white fill and blue text. The blue fill of the “retrieve data” button differentiates it from the “reset form” – a helpful signal to the user who, with the two action buttons right next to each other, could be at risk of accidentally resetting the form and losing the data selections made in the checklist.
As an example, let’s select the Unemployment Rate series from the Employment section, and Exports series from the Price Indexes section. Once they hit “retrieve data,” the user receives immediate feedback that their action was successful as they are taken to a new page with the search results.
Reviewing & Downloading the Results
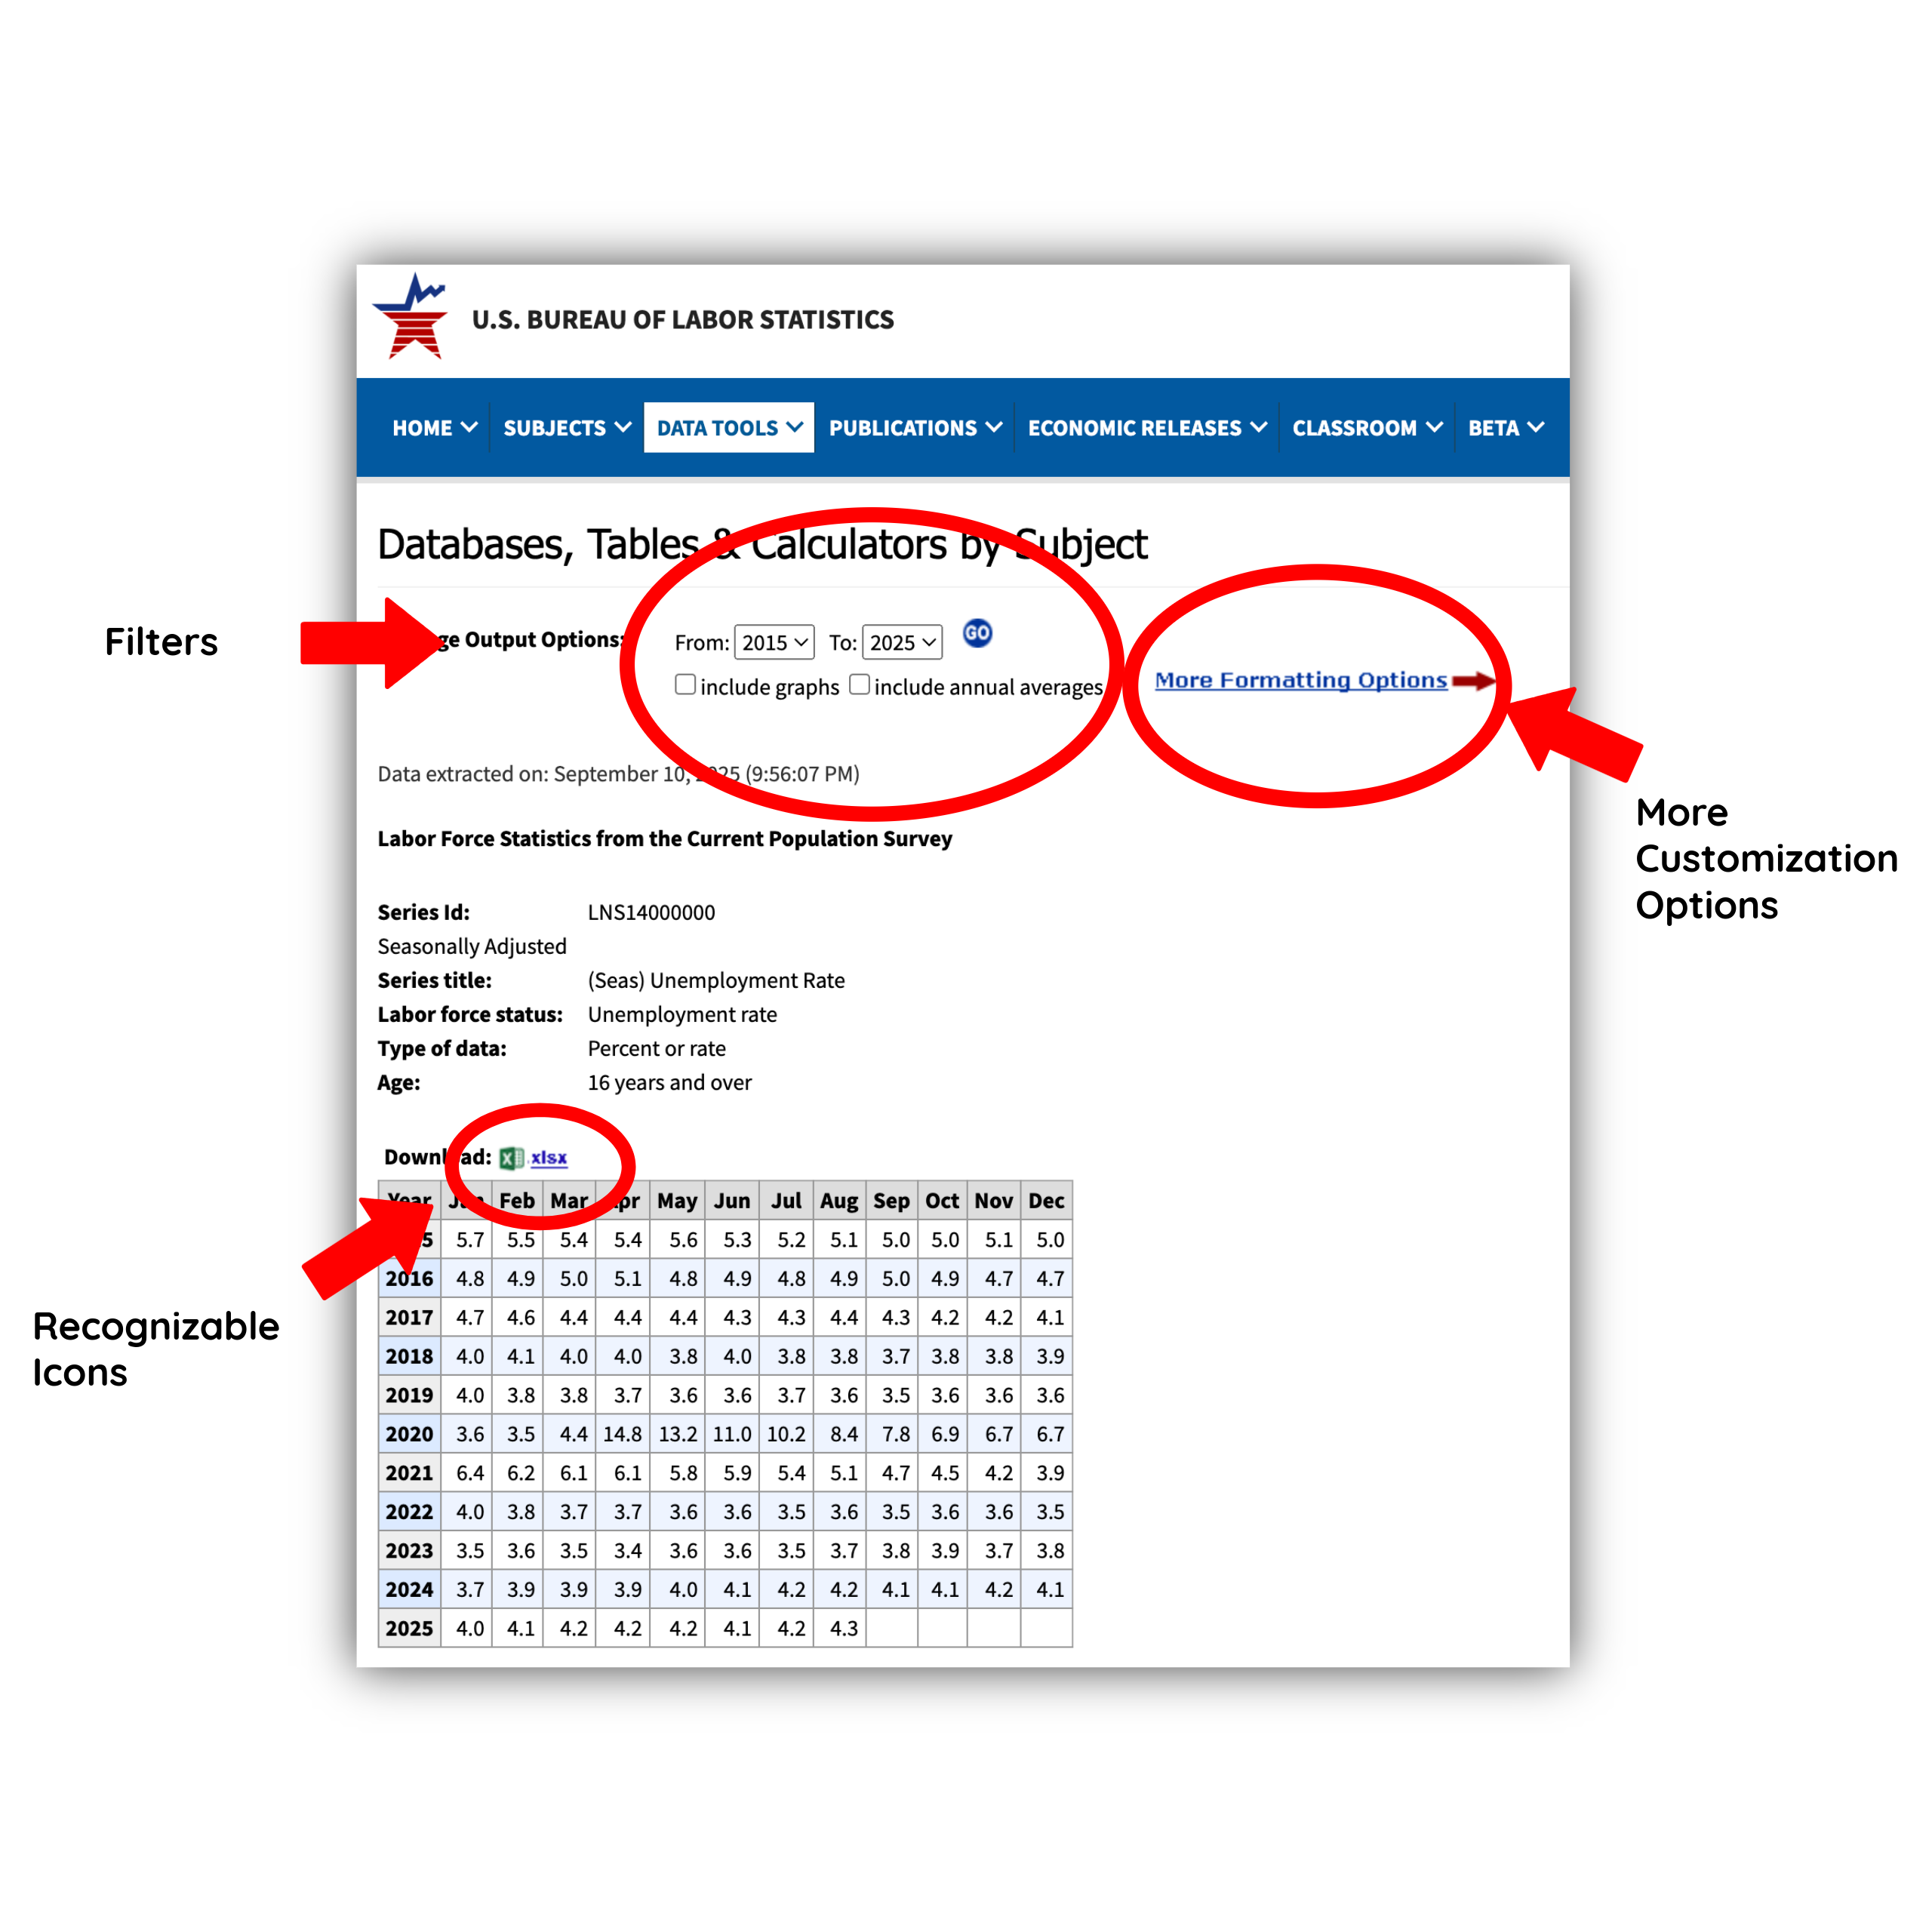
The page displays the data series information, the date the data was extracted, and a preview of a downloadable Excel file for each series selected on the previous page. The preview of the data in table form helps bridge the gulf of evaluation for the user: they can see what type of data (e.g. annual, monthly, annual averages, etc.) they’re getting without having to first download the file and open it in a separate software.
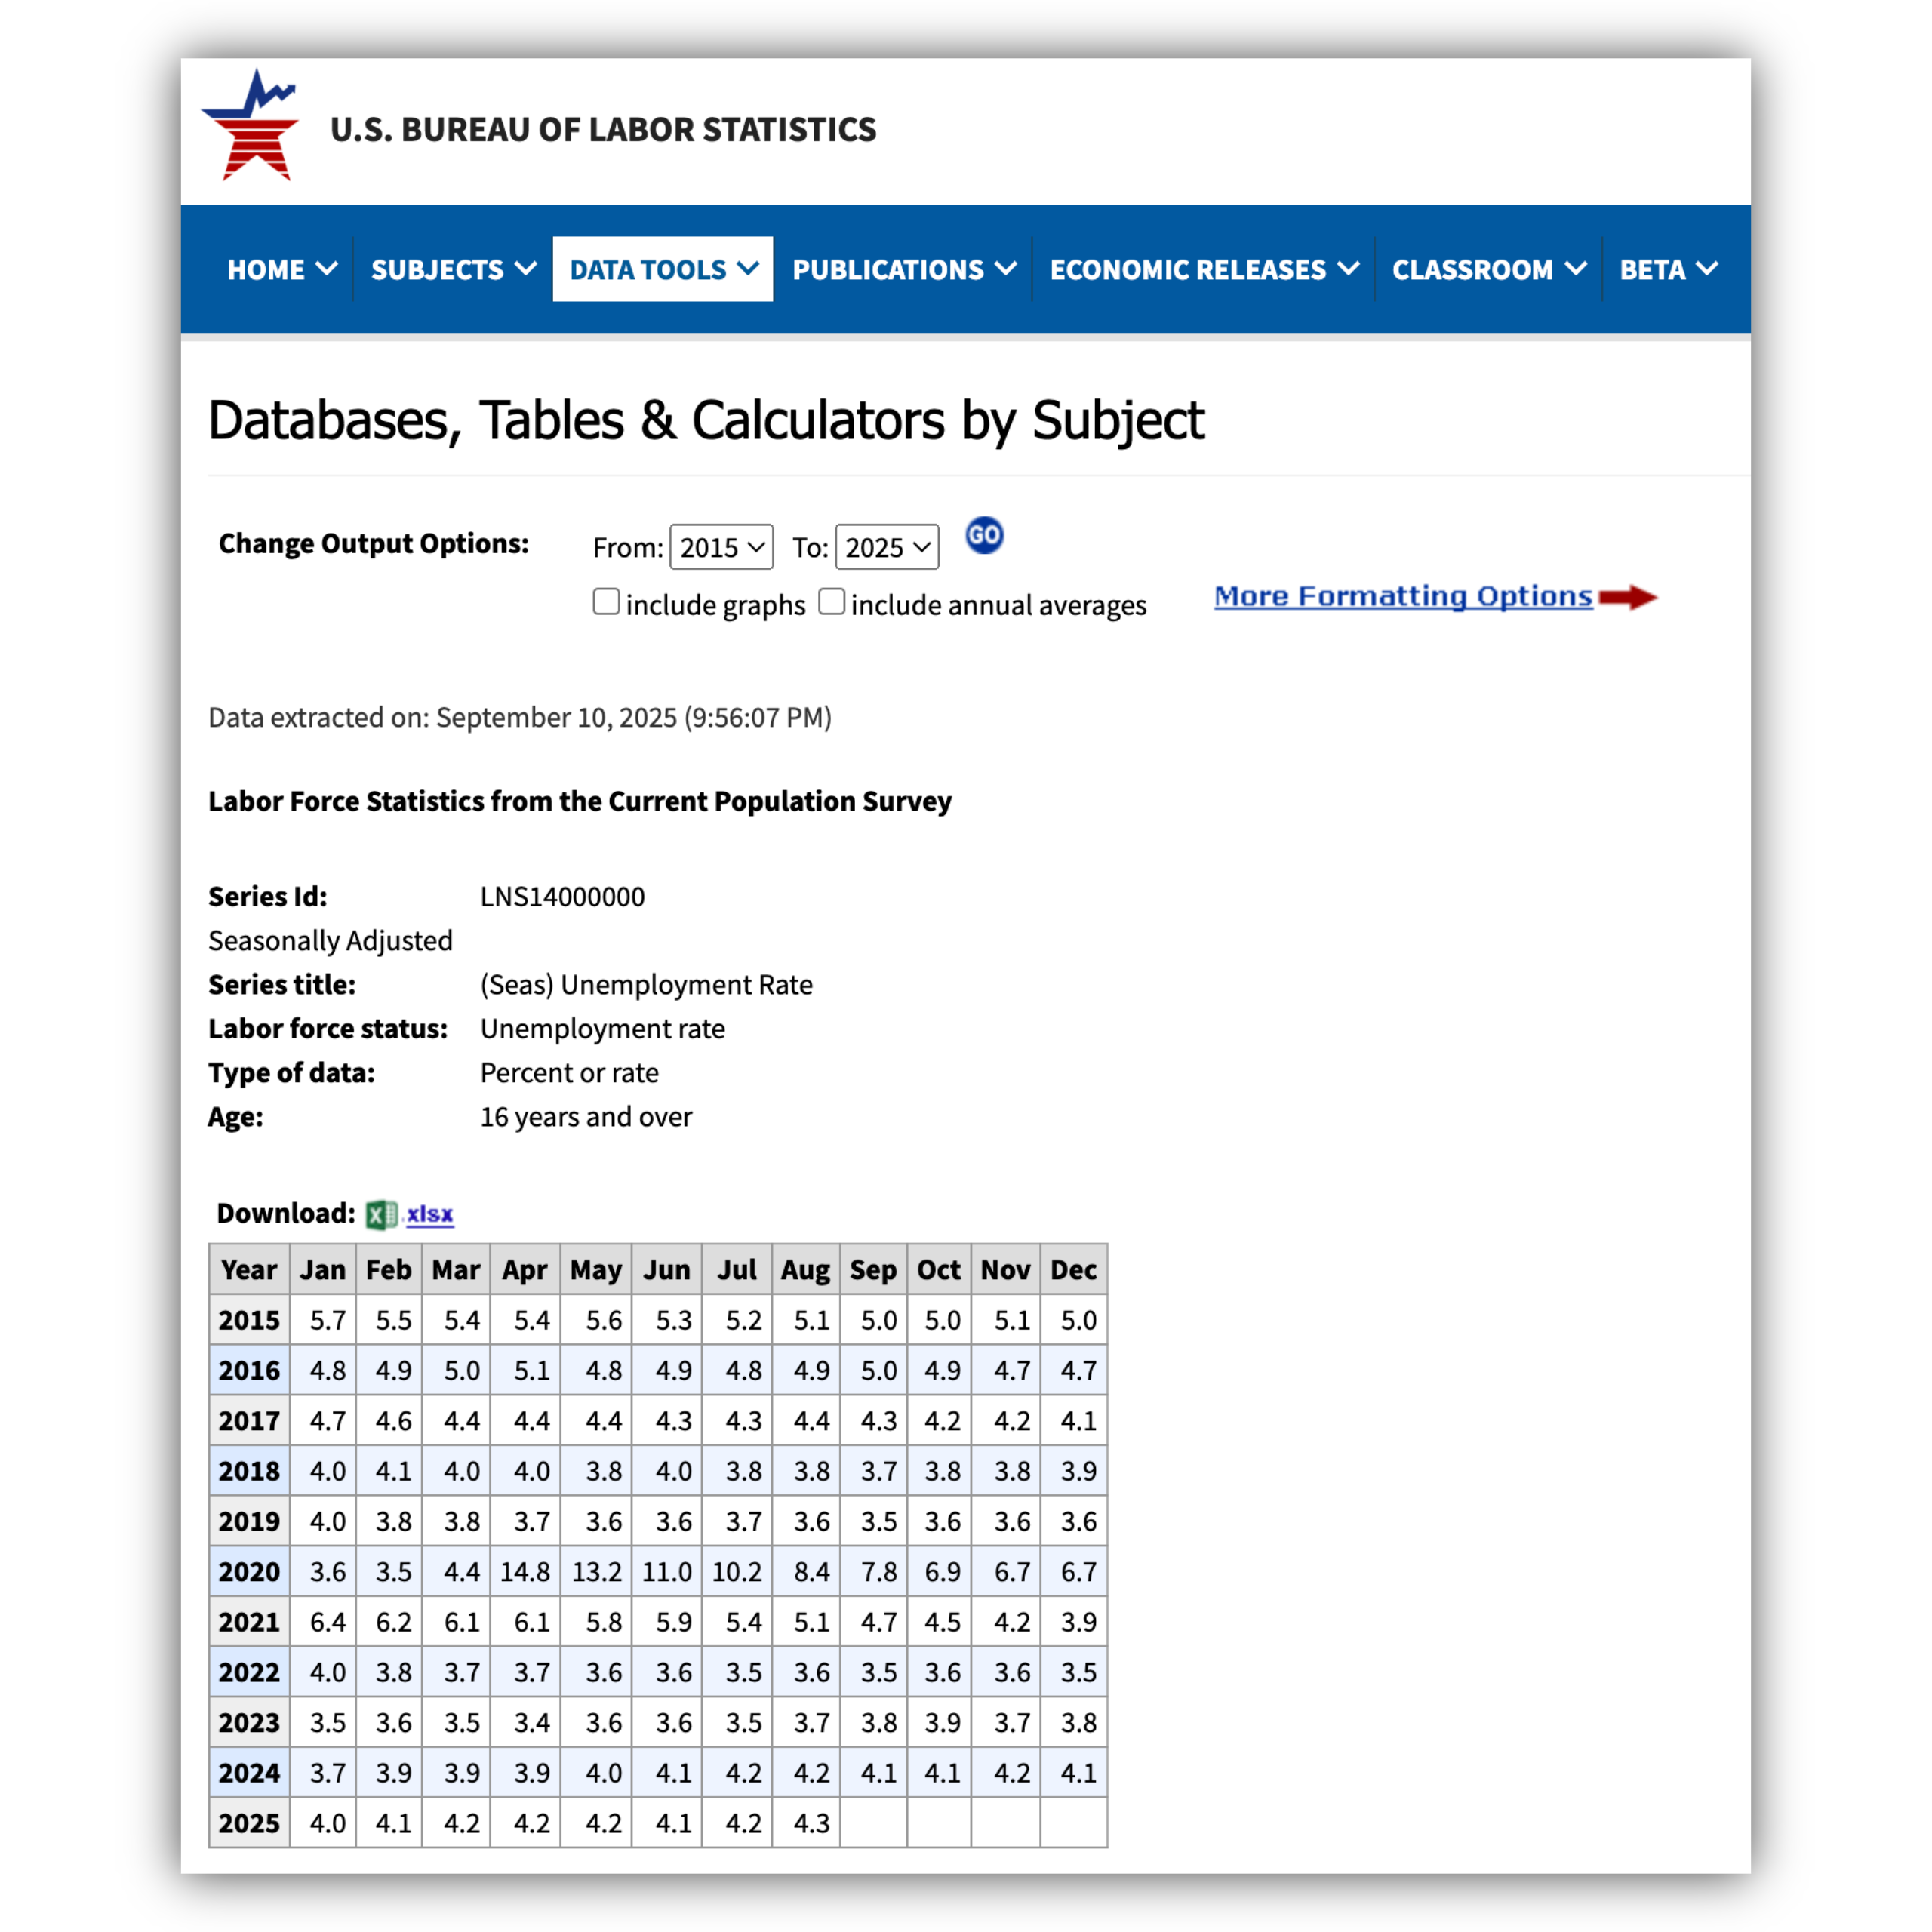
The page also includes some customization filters, which affords to the user that they may be able to manipulate the data in this webpage itself. Though there are only three customization filters shown on the page, the “More Formatting Options” clickable link next to the filters signals to the user that further data manipulation is possible. I will note, however, that the red arrow next to “More Formatting Options” is deceiving and potentially unnecessary: if the user hasn’t yet learned it is a clickable link, the arrow isn’t pointing to anything tangible.
The link to download the data is accompanied by the Microsoft Excel logo and a preview of the data table – the Microsoft Excel logo is likely familiar to the user, and they will easily recognize and identify the file type possible for download. With a clear view of the data, this also aids in bridging the gulfs of execution and evaluation for the user: the user might realize the data structure doesn’t quite match their mental model of what they anticipated the structure would be. This saves the user time, affording them the chance to explore the tool’s customization options before going through the process of downloading the data and importing it into a separate software package before realizing this particular data structure might not work for them.
Final Thoughts
The BLS website homepage displays a plethora of information, but uses design techniques to visually signal to the user the type of actions possible, including discoverability of the Popular Series Data Retrieval Tool. Using the Popular Series Data Retrieval Tool is relatively intuitive given its use of grouping page items and mapping to possible actions. The tool also affords users the opportunity to manipulate data formatting within the site itself, eliminating the user’s need to take several more tedious steps such as downloading the data and reviewing it in a separate software. The sheer amount of information can be visually overwhelming at first, but once oriented, the site and data tool become easily navigable and usable.