INTRODUCTION
This case study explores how our team partnered with the Center for Urban Research at CUNY to redesign the Hard-to-Count Census Map ahead of 2030. The platform helps advocacy groups, local governments, and funders identify communities most at risk of being undercounted. Our goal was to simplify the experience while maintaining the depth and accuracy essential for users to make equitable decisions.
Through comprehensive research and defining a strategic direction, we were able to redesign the CUNY map interface with solutions that addressed the needs of users of different backgrounds with attention for clarity and accessibility.
CLIENT
Center for Urban Research at CUNY
TEAM
Shriya Chipde, Rex Fukuchi, Shayla Singh, Emily Yip
DURATION
15 Weeks
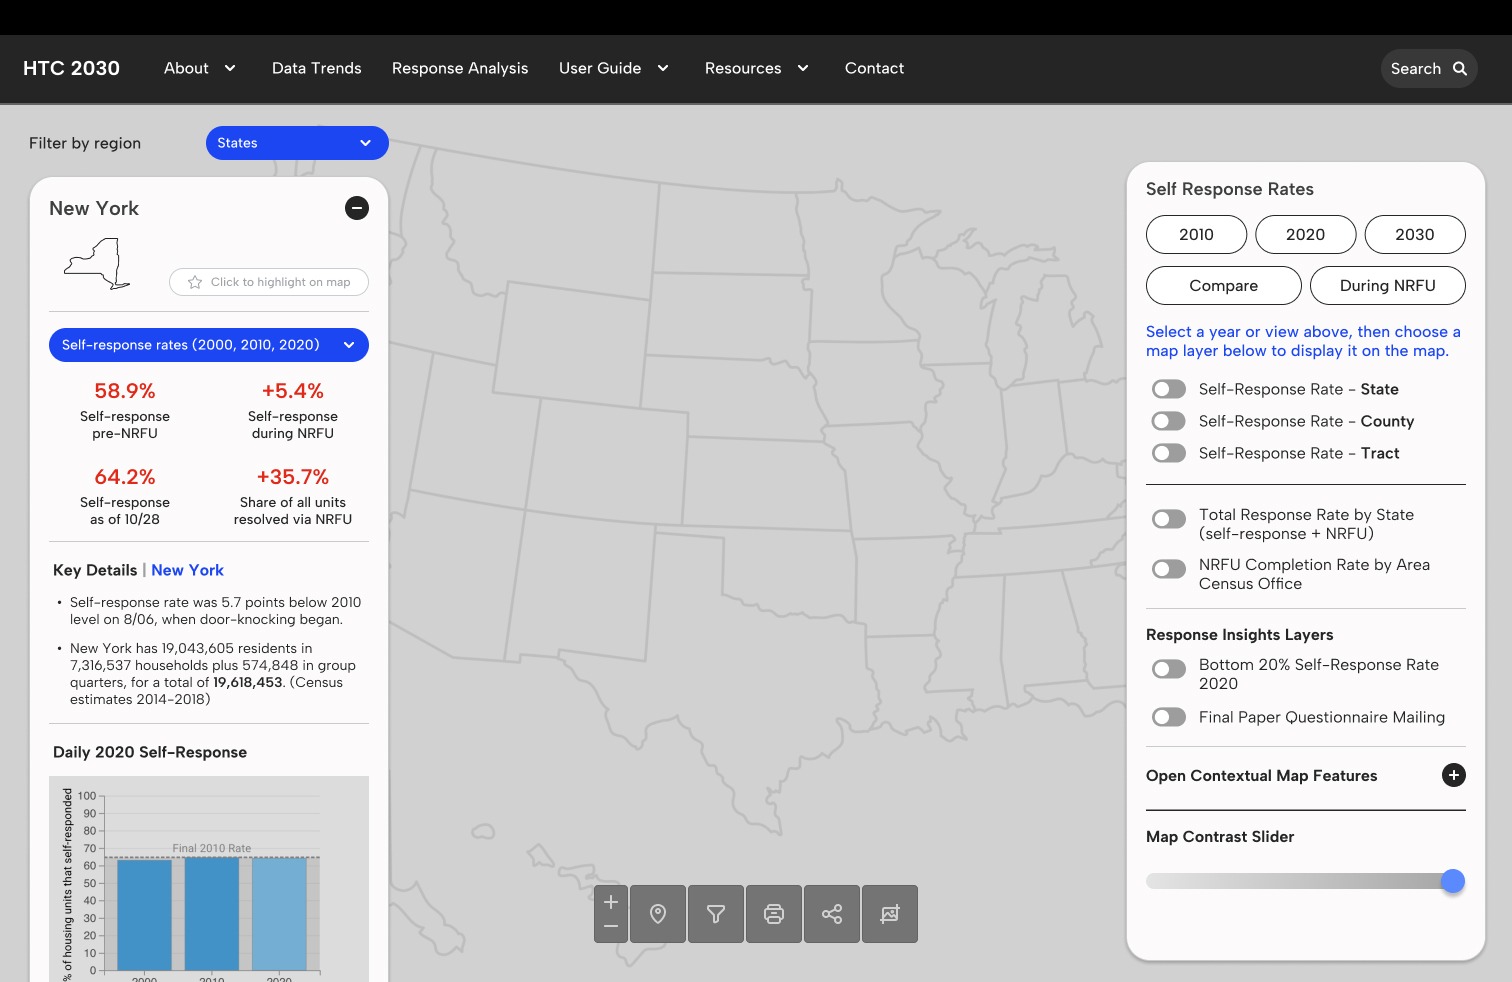
The final dashboard for our CUNY HTC 2030 map redesign.
Overview – The importance of the U.S. Census
The U.S. Census only happens every 10 years, but the impact spans more than just counting the inhabitants of the United States. In documenting the members of American households, the government is able to allocate public funds and determine political representation for different areas of the country.
In preparation for the 2030 Census, the Center for Urban Research at the CUNY Graduate Center wanted to redesign the front-end application interface for the initial version of the 2030 Hard to Count (HTC) Map, a resource that will be used to support nationwide stakeholders in their efforts to ensure an accurate and fair Census count.
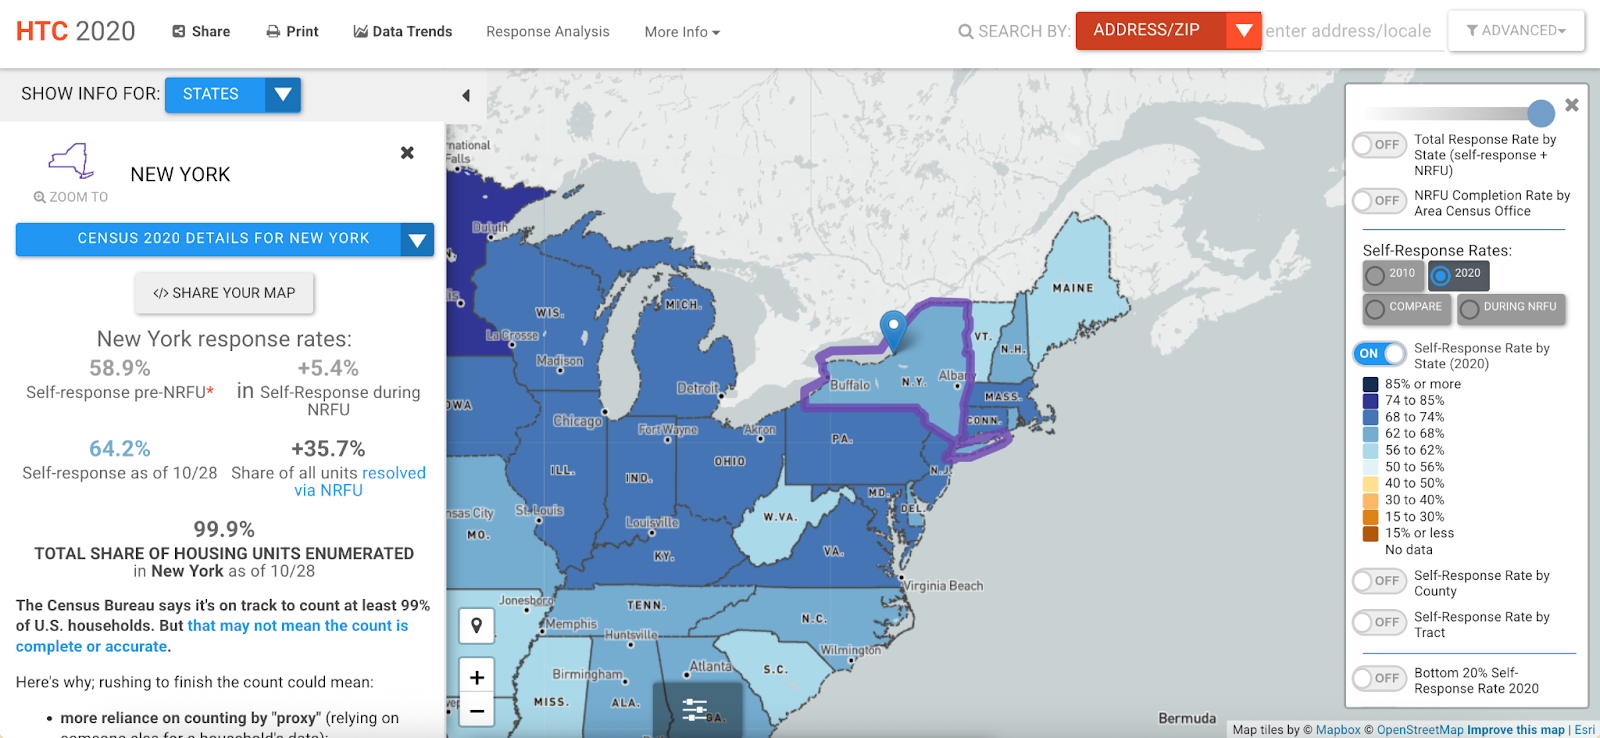
The current version of the CUNY HTC 2020 map.
Mapping out the project: Aligning goals
Through holding a kickoff meeting with the CUNY team and auditing the 2020 HTC Map website, our team defined the following objectives.
- Understand how key users such as nonprofit organizations, funders, and academic institutions use the HTC census map.
- Shape a design strategy for the 2030 HTC website using research insights.
- Create an easy-to-use tool that effectively communicates HTC information through meaningful insights and data visualizations to support the 2030 Census efforts.
Our 15-week design sprint was divided into three main phases: Understand, Explore, and Materialize. Throughout each phase, we remained in direct contact with the client to gather real-time feedback and make use of their expertise.
The three phases of our 3 month design sprint.
UNDERSTAND – Research and synthesis
Starting the treasure hunt: Research questions and methodology
In order to inform our research process, we first articulated exactly what we were setting out to discover about the product and the users:
- How do different stakeholders currently use Hard to Count (HTC) data and maps to plan and evaluate their census outreach efforts?
- What challenges do users face when accessing, interpreting, or applying HTC data to their work?
- What features, visualizations, or interactions do other organizations use in their maps that would make the 2030 HTC map more understandable and actionable for diverse audiences?
Evaluating the landscape: Competitive analysis findings
Through an audit of the existing CUNY HTC 2020 map and a competitive analysis of 11 competitor maps, we identified best practices that reflect what makes a map effective in communicating data to its audience:
- Audience-first clarity – Users should instantly understand who the map is for and its main goal at a glance.
- Interactivity over complexity – Hoverstates and icons improve comprehension faster than text-heavy panels.
- Accessibility – Few maps meet WCAG color contrast or support keyboard navigation.
- Transparency - Showing “last updated” dates and data sources builds trust beyond visual appeal.
- Simplified navigation - Slow loading and complex drop-downs reduce engagement.
- Exportability supports impact - Share and export options enhance usability and help extend map reach.
- Help & Onboarding - Clear tutorials, legends, and tooltips guide first-time users and support self-learning
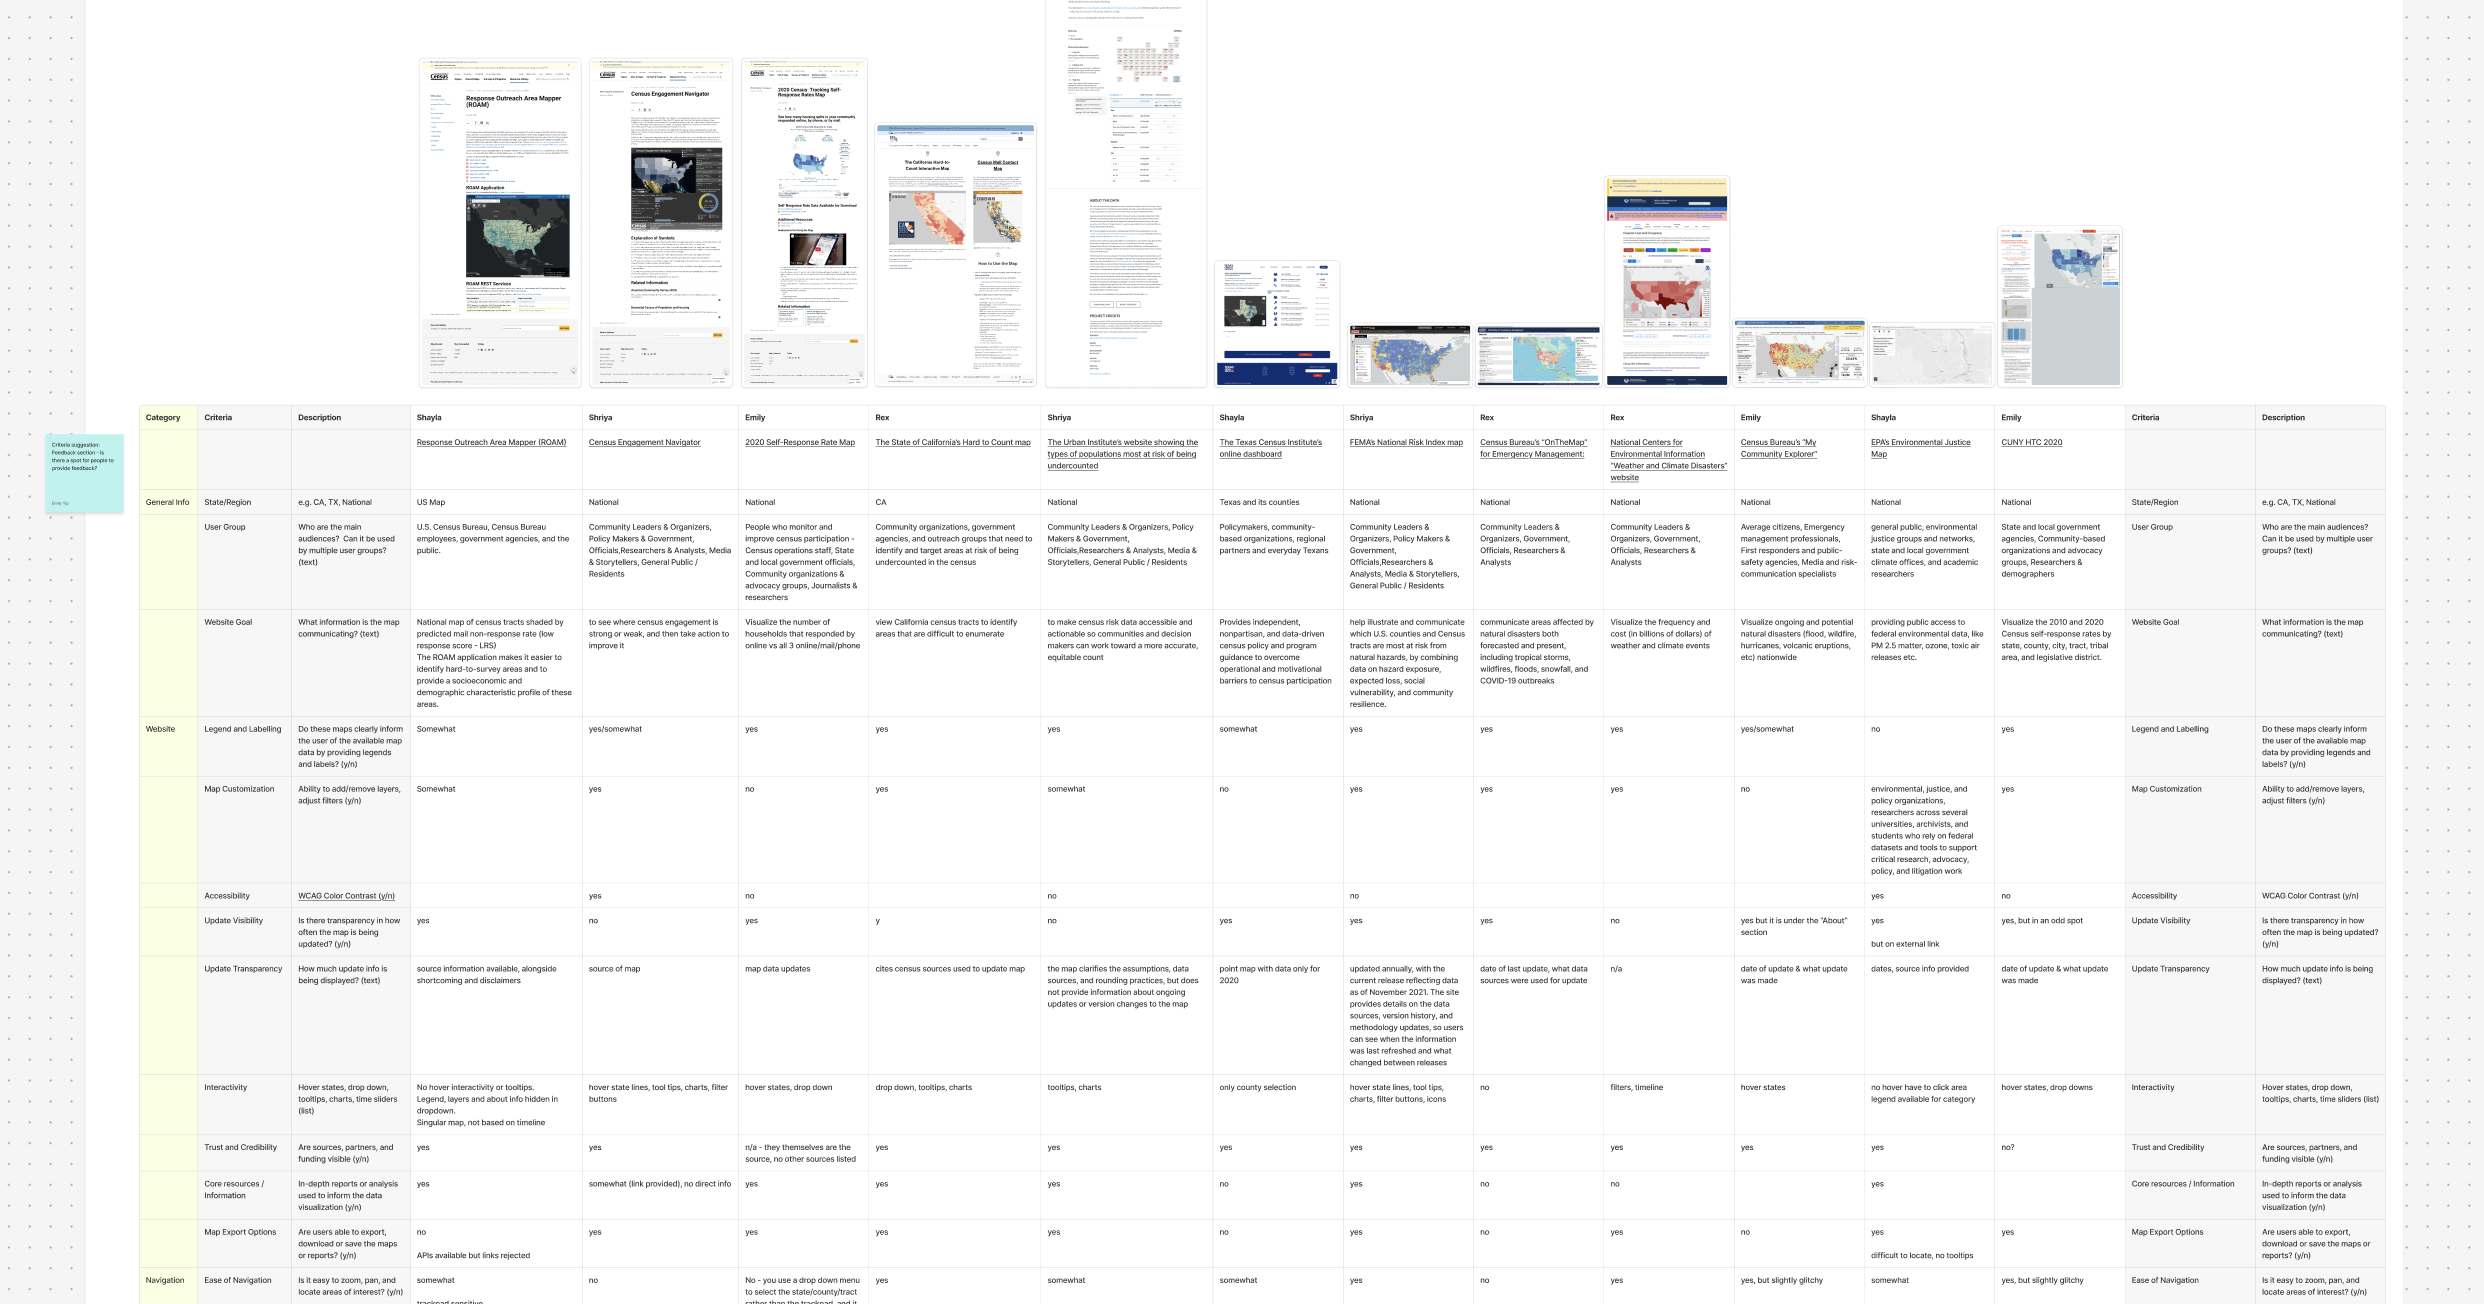
The full competitive analysis of the current CUNY HTC Census map and 11 similar online maps.
Stakeholder Interview Findings
Through conducting interviews with ten stakeholders from organizations with experience using the CUNY HTC 2020 map, we uncovered user’s specific needs, pain points, and thoughts about the current state of the CUNY HTC 2020 Census map.
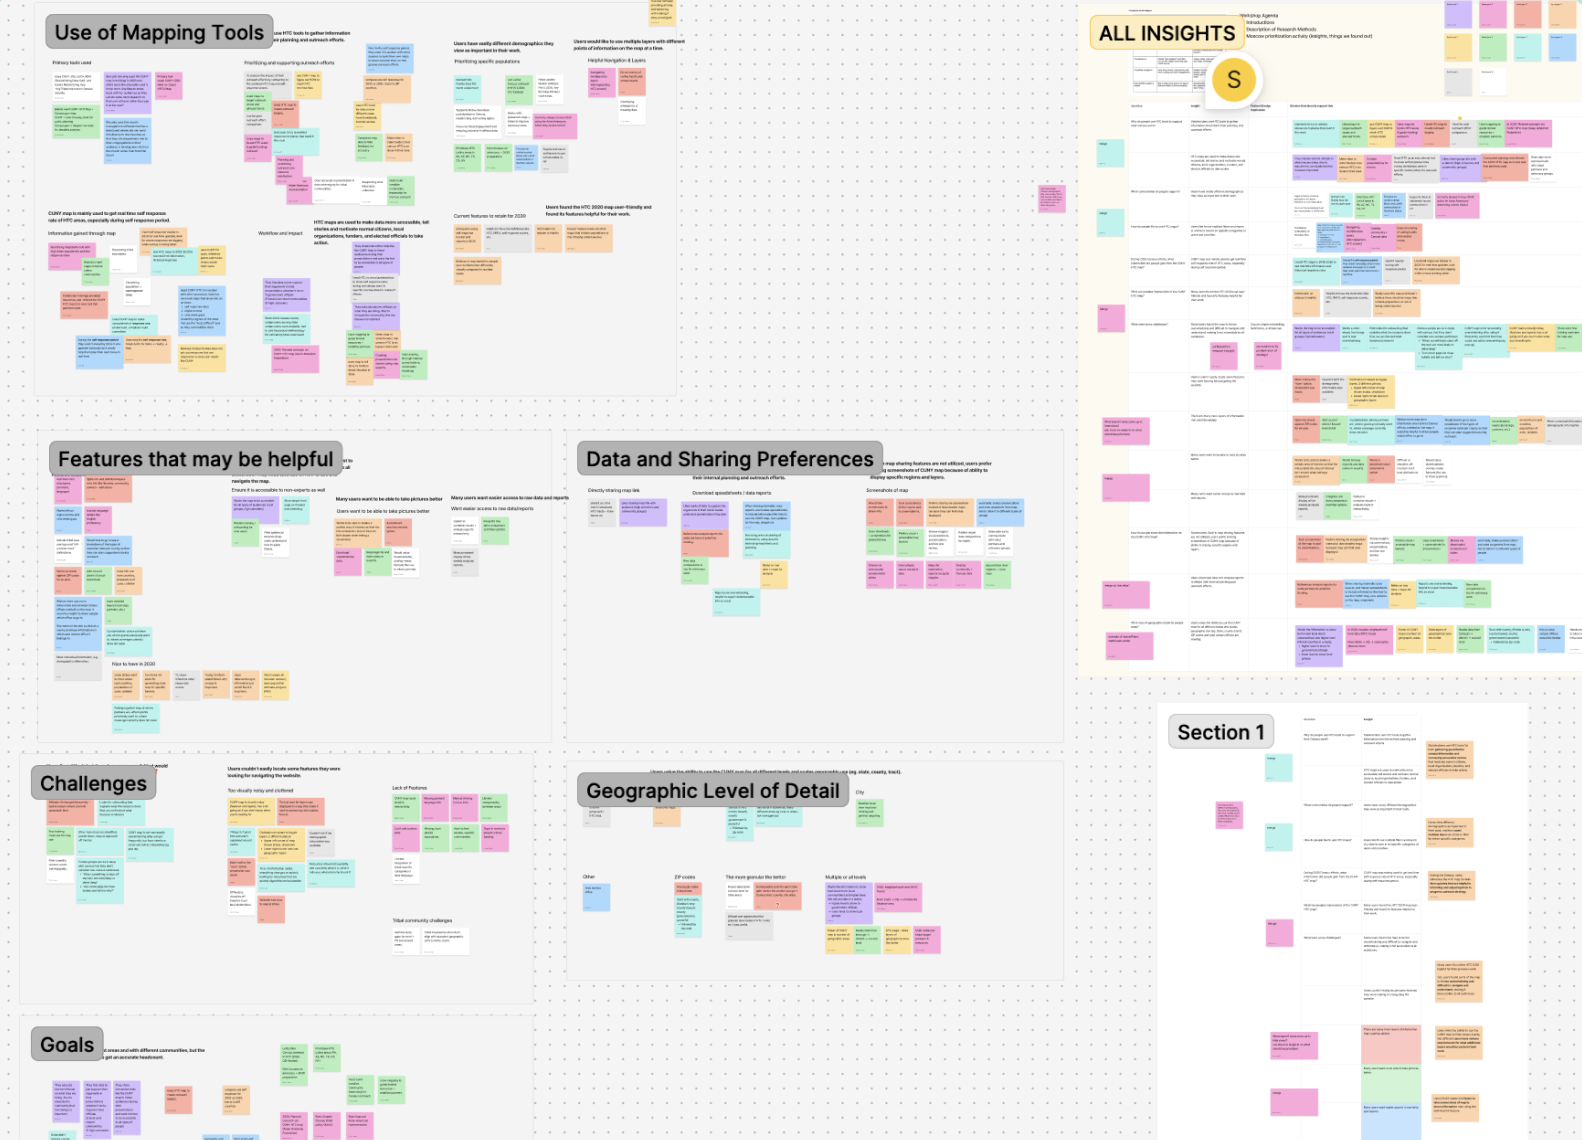
The working document of organized findings from the user interviews.
However, with so many kinds of users that have different goals in using the map, there were an overwhelming number of directions we could take our design in. To determine priorities with user needs and challenges, we scheduled an affinity mapping and MoSCoW prioritization workshop with the client and identified 6 main findings characterizing how users interact with the interface.
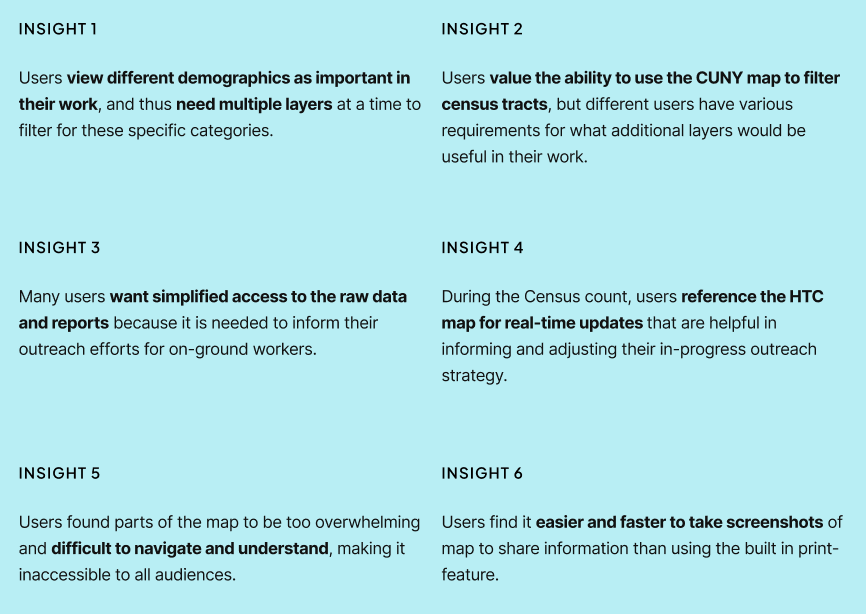
The six synthesized insights after conducting the client workshop.
EXPLORE – Ideation
Strategic Direction
Throughout talking to stakeholders in our research, we kept coming back to specific themes that we codified in our strategic direction.
Designing for users coming from different backgrounds by offering comprehensive onboarding and user guides, presenting a wide range of layered information with precise filters, and prioritizing usability and way-finding to meet the specific needs of a nationwide mapping project.
This strategic direction manifested itself in the three following ways:
- Design for Everyone – Ensure the website is accessible and intuitive for every user, regardless of background or technical ability
- Clarity and Transparency – Communicate data sources, methodologies, and updates openly to build trust and credibility with users
- Foster Collaboration – Foster collaboration by providing resources that enable Census communities to work together toward a more accurate population count.
Design exploration
Through the design exploration process, we focused on features that would support the types of users we interviewed. We identified the map filters, site overview, data report access, and accessibility features as prime candidates for redesigning in order to improve clarity and accessibility. We also decided to add onboarding user guides and additional collaboration features in order to give users the tools needed to be effective in their roles preparing and conducting the Census.
MATERIALIZE – Design and iteration
Using titles to give context – Information architecture
Before: The existing information architecture of the CUNY Map had little hierarchy, with the navigation bar and page titles providing insufficient information into the types of resources the user could utilize to get the most value out of the map.
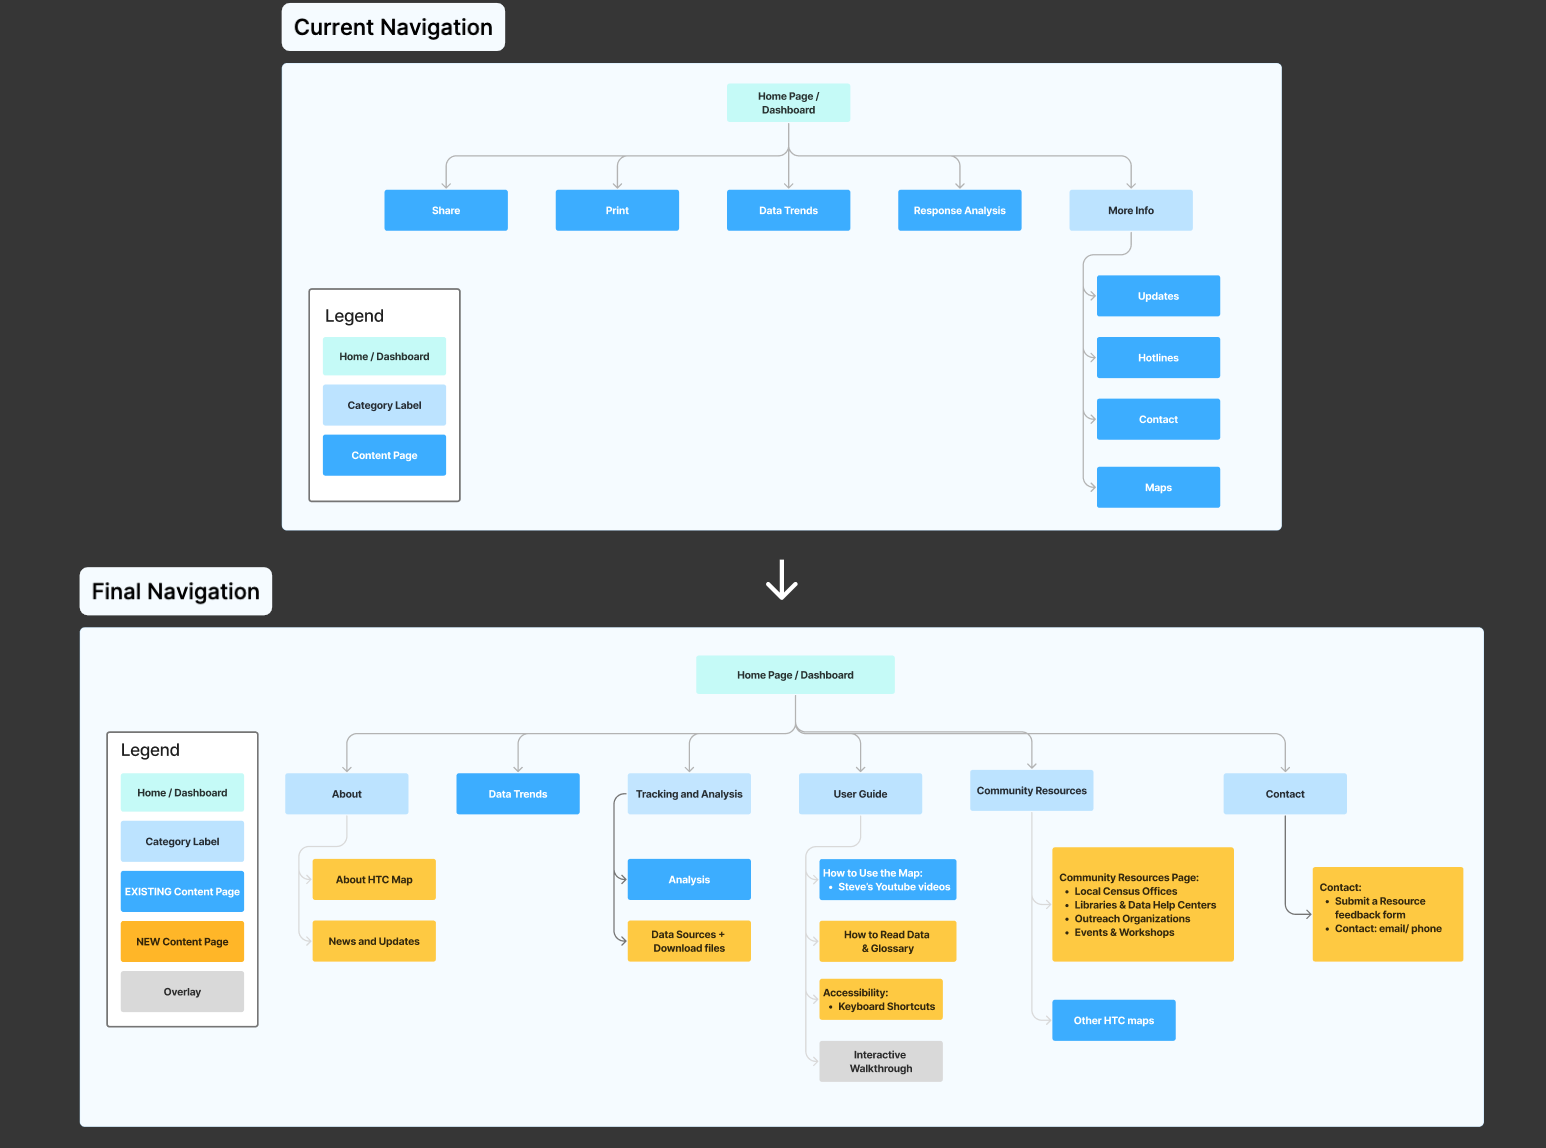
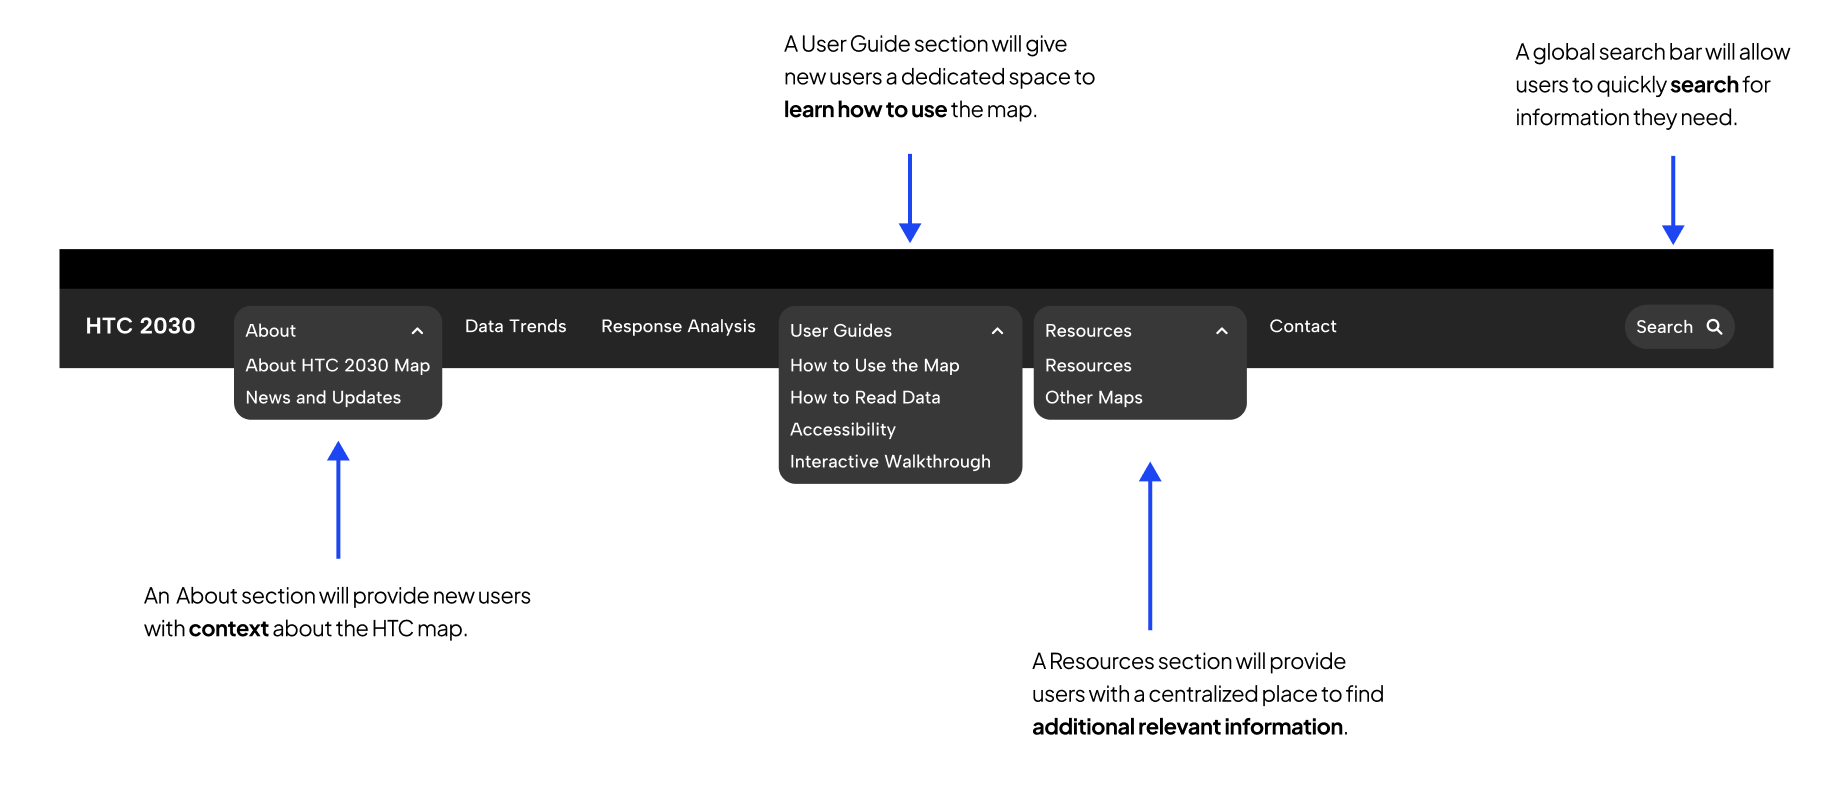
After: Our recommendations include a more structured list of drop down items in the main navigation that organize supporting content for the map and also provide context for why the map is an important resource for organizations invested in the success of the U.S. Census.
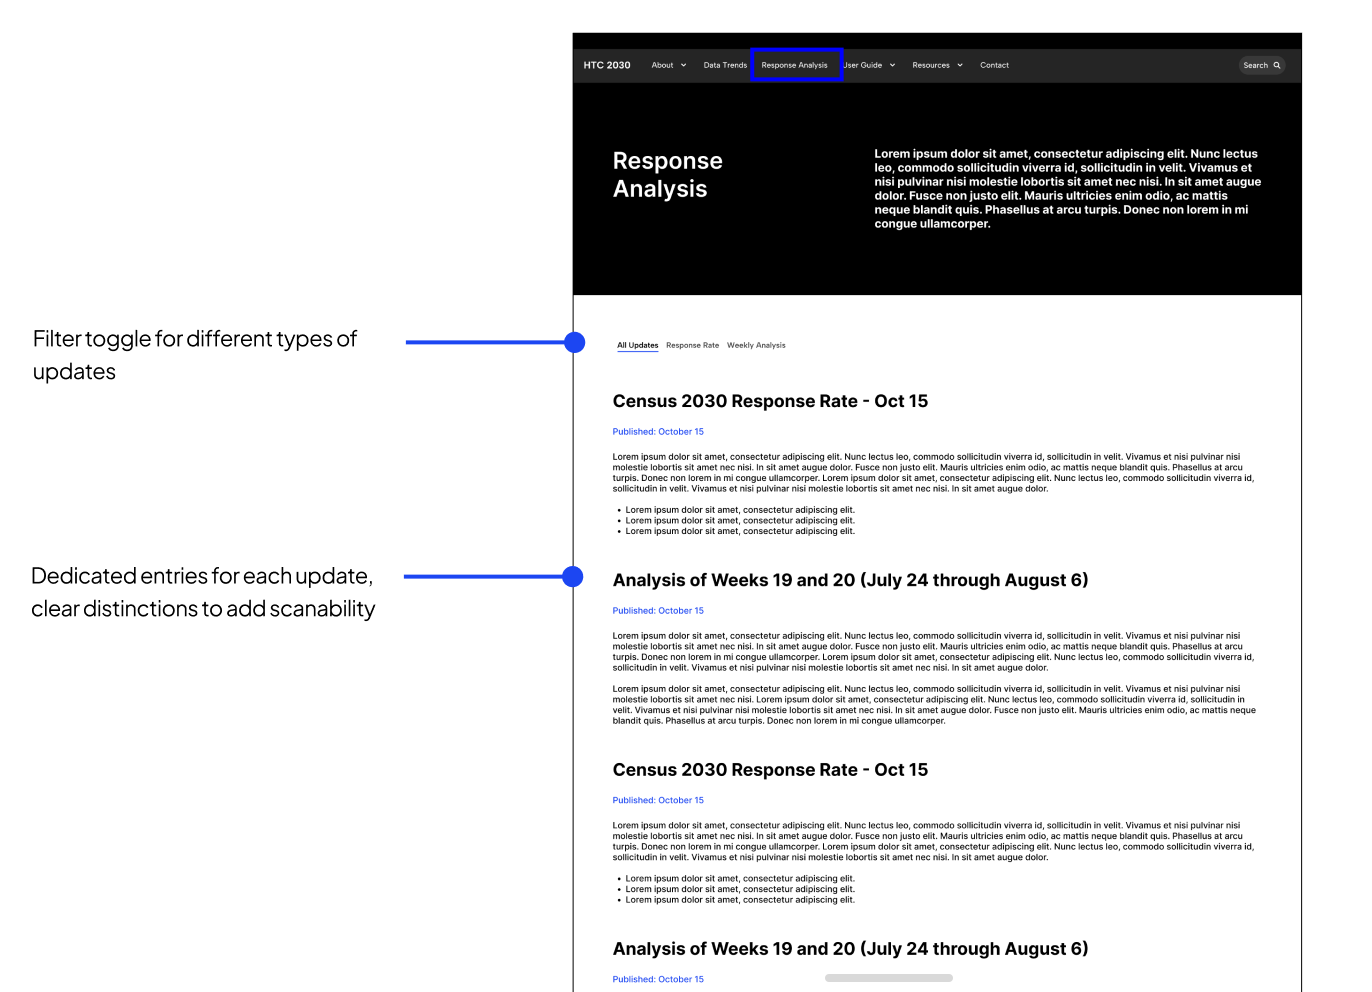
Greater clarity for updates and external resources – Content pages
Before: Our interviews revealed that transparency in updates is a large part in how websites can build trust with users. The existing CUNY map had very little distinction between the content on different pages, with site updates in particular being communicated with plain text and hyperlinks.
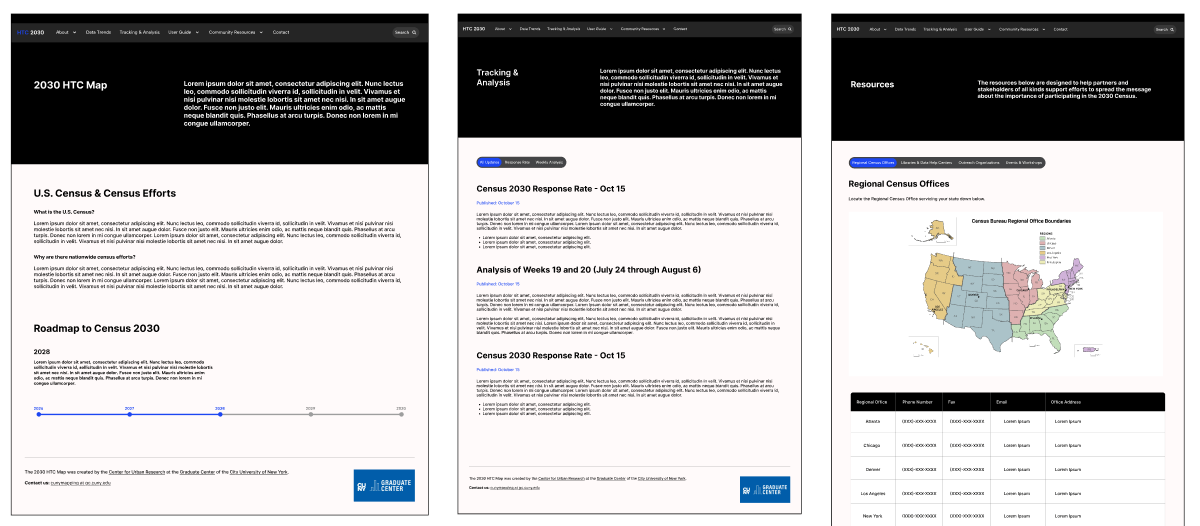
Three examples of pages (About, Tracking & Analysis, Resources) that utilize the content page template.
After: In order to provide users with greater clarity when accessing content, we created templates that utilize titles and whitespace to increase scanability. We also recommend introducing a tab system that allows users to easily see and switch between related pages.
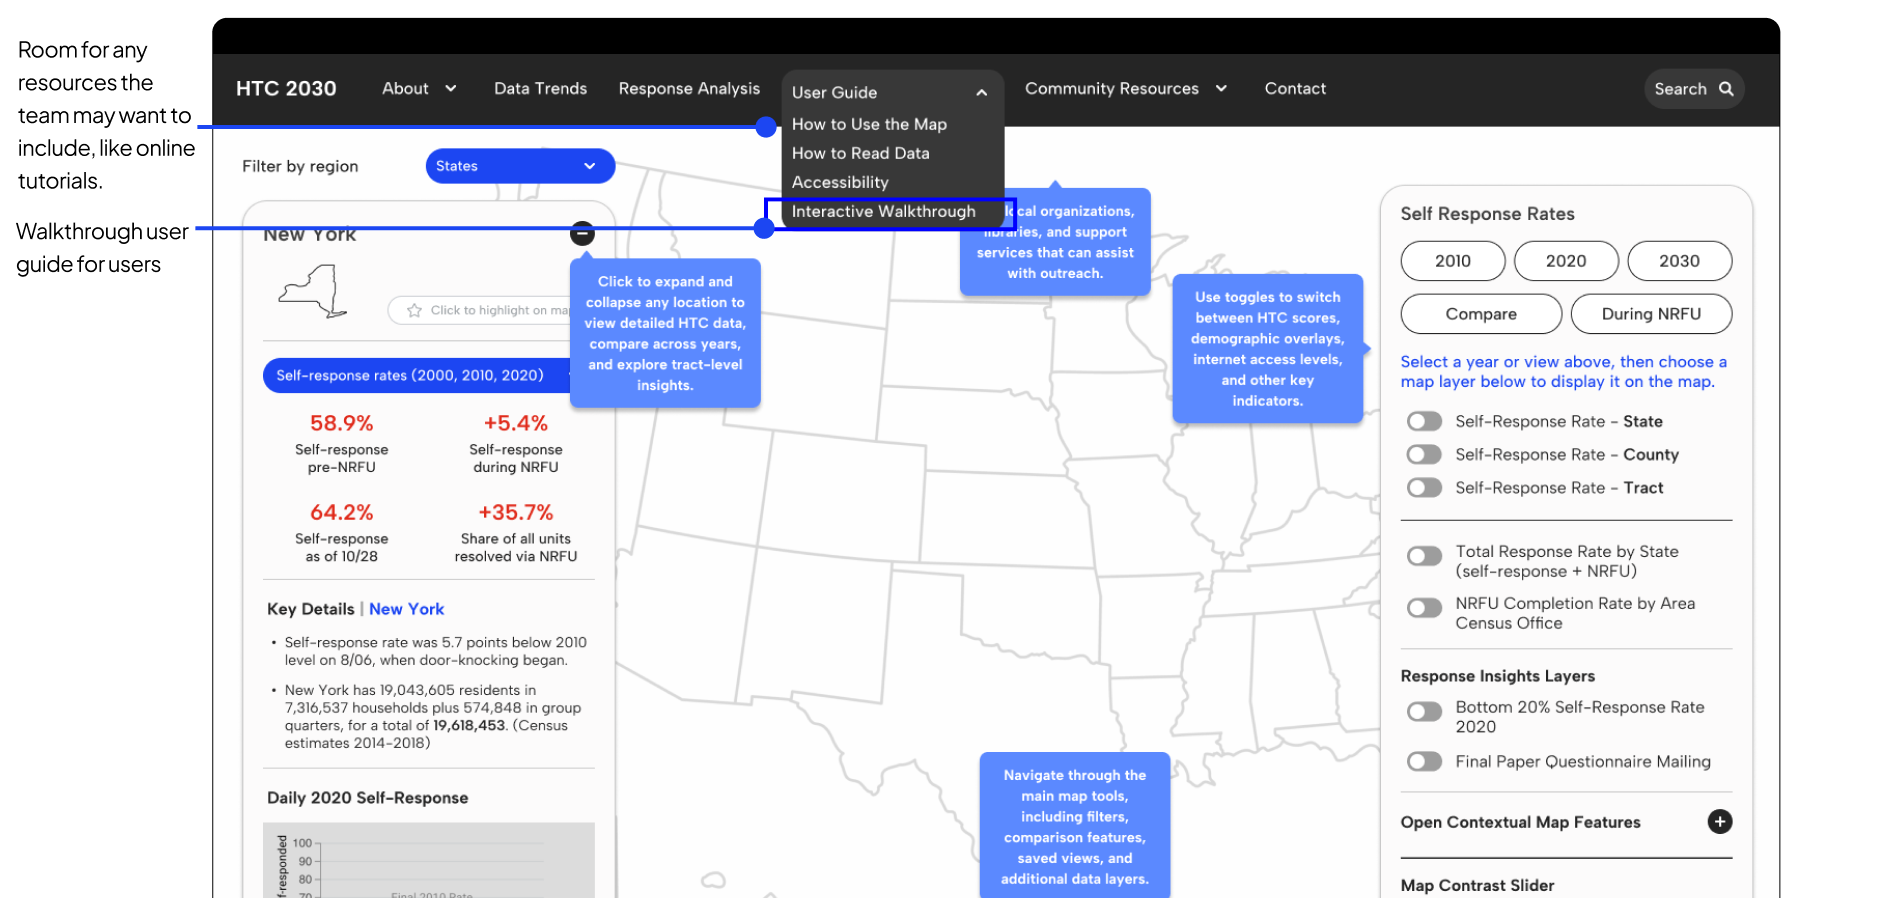
Pointing new and returning users in the right direction – User guides
Before: The user base for the CUNY HTC map spans a wide variety of users in different roles, some of which use it sparingly and some of which use the map every day. To address this spread of users and provide equity in usage, there is a need to ensure that support tools and information can be easily identified from the main dashboard. Previously, the CUNY map restricted tutorials at the bottom of a text only content page titled “Updates”, which did not align with user’s expectations of where they would look for these tools.
After: We recommend increasing the discoverability of user tutorials through a dedicated navigation item titled “User guide”. This section contains tutorial overlays that give users a visual representation of where certain tools are located on the map, in addition to a glossary and keyboard shortcuts.
Placing more emphasis on data – Dashboard panel
Before: The left dashboard panel on the CUNY map is text heavy with exposition, which takes away the discoverability of the data visualizations underneath. In doing so, it hides the essential information users access the dashboard for: direct up-to-date Census metrics for areas on the map.
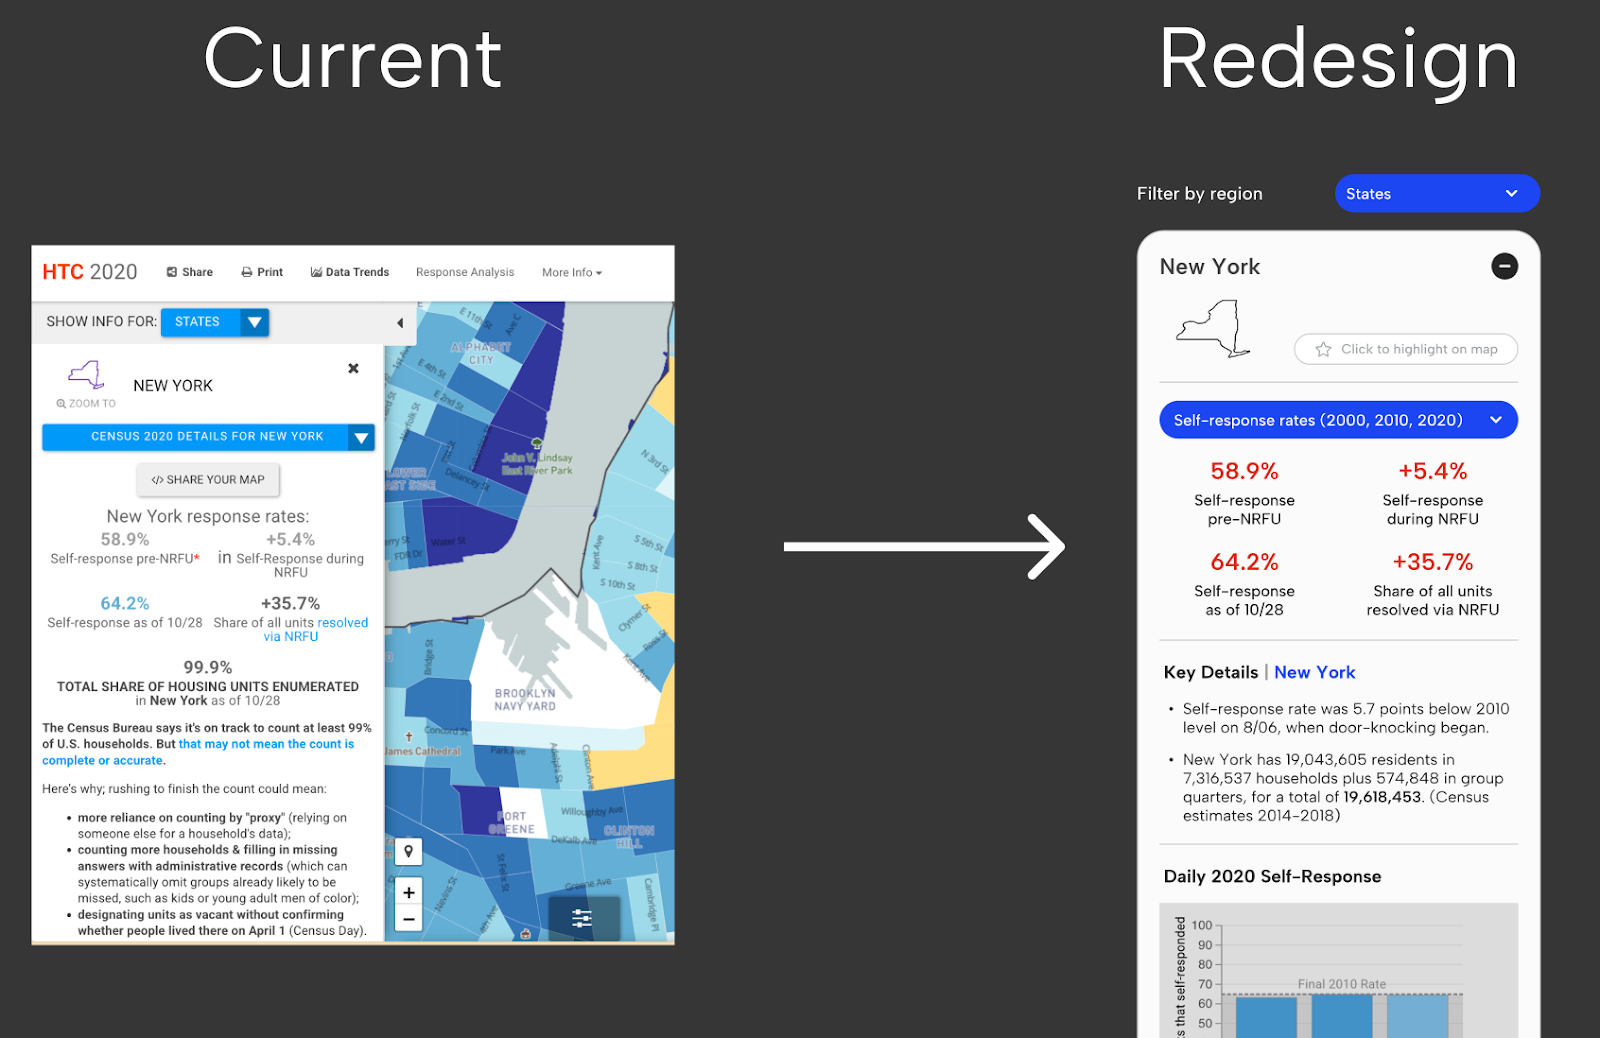
After: Our recommendation was to reprioritize visualizing relevant data on the left dashboard panel and giving users freedom to select areas of interest using an accordion menu. Sorting information into sparingly-used dropdowns allows users to focus on key parts of the map.
Dynamic control for users: Control panel
Before: The current right dashboard panel is a hybrid between a map legend and filter control toggle. This creates an experience that is not fully dedicated to either, creating friction for users who want to only engage with one of these functions.
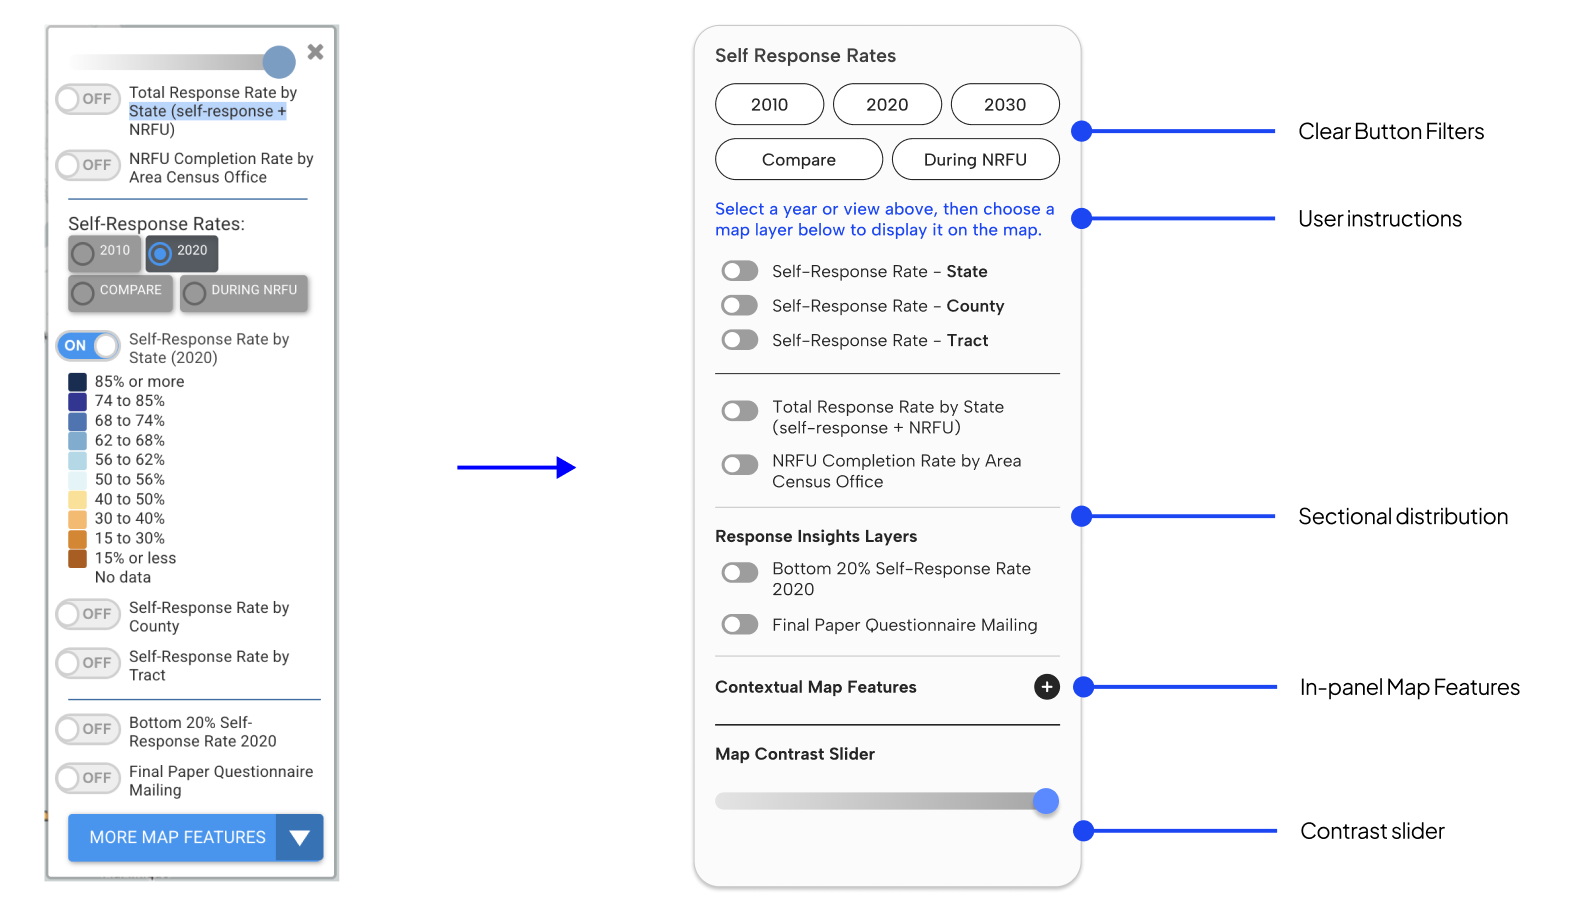
After: In order to create a more cohesive experience, we recommend focusing the right dashboard panel to enable a more dynamic and intuitive view for layer selection. Our design establishes a consistent, structured layout that organizes all map layers by category, including layers that toggle on and off relative to one another with switch controls and overlays that use radio buttons to tell users which layers are active.
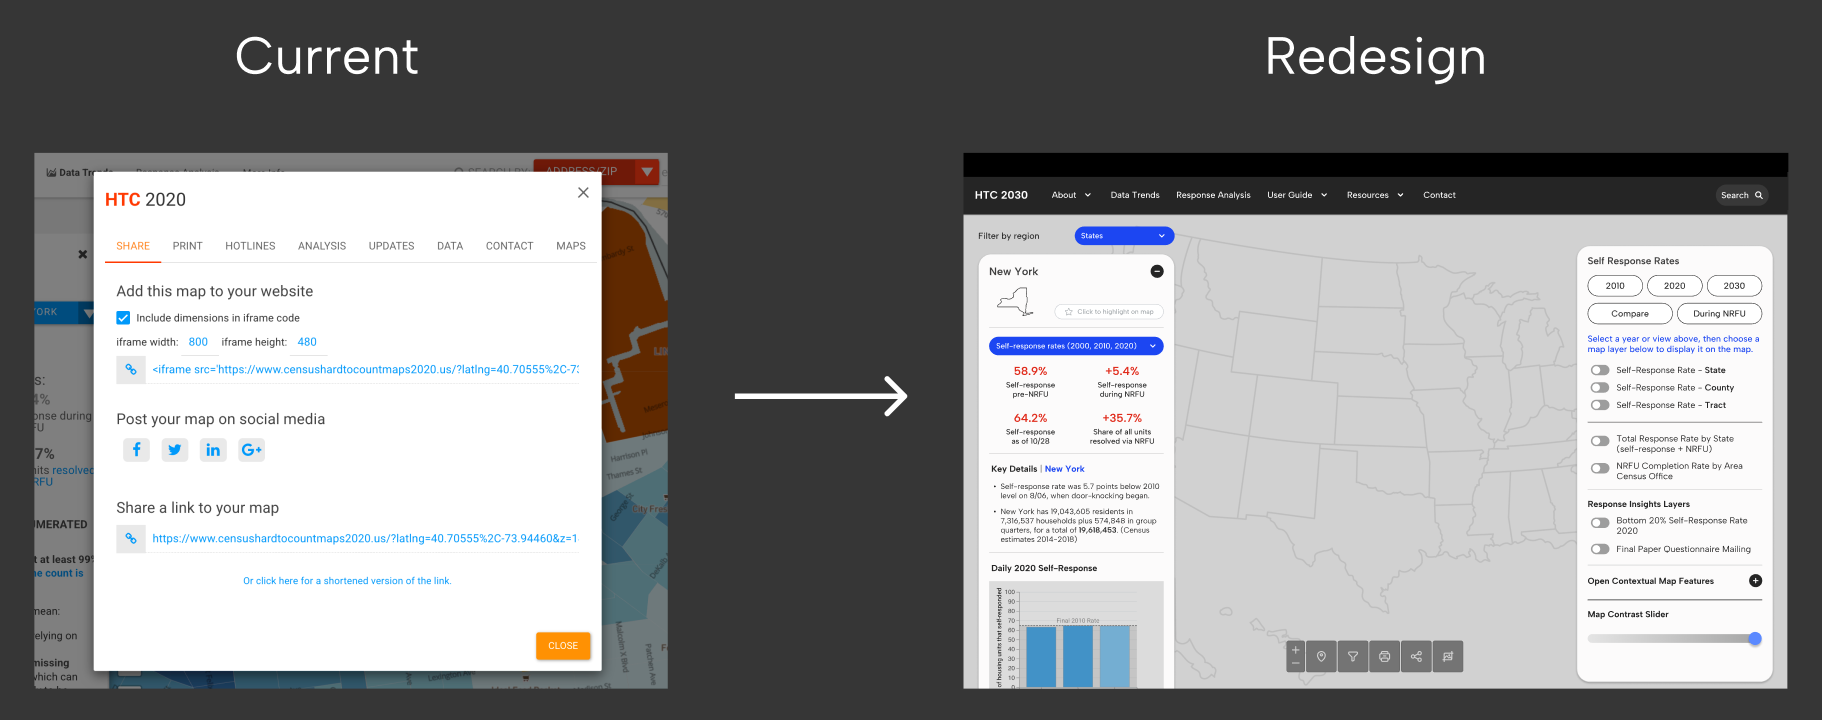
Increasing discoverability of sharing features – Printing and screenshot options
Before: While the current CUNY map contains various features that enable sharing map data such as printing the map view, our stakeholder interviews indicated that manually taking screenshots of the map view was the most popular option. This is a result of the sharing features being hidden within the top navigation bar and users finding the friction of accessing these features insufficient for their needs.
After: To make sharing features more visible, we recommend directly adding a toolbar to the bottom of the dashboard, ensuring that users always have access to a major tool that supports the goal of enabling collaboration.
Looking ahead to 2030 – Wrap up and next steps
The client was impressed with our team’s ability to quickly familiarize ourselves with the complex intricacies of the Census and ideate designs that accurately reflect what stakeholders of different backgrounds need to be successful in their real-time work. Using the finalized design recommendations, CUNY is on track to launch the next iteration of their HTC map by 2025 so their partner organizations can start preparing for the 2030 Census.