
The United States Census Bureau offers the public the ability to search, filter, and download data collected by the bureau during the decennial census and other, more frequent surveys, such as the American Community Survey.
The United States Census Bureau’s data repository at data.census.gov is a website that hosts the data collected by the bureau during the decennial census and other, more frequent surveys. The website provides an interface to search for data by topic or place of interest, then either view the requested data in the browser or download it for review and further processing on your computer.
Searching and filtering
The US Census Bureau collects a massive amount of data on a wide breadth of topics during the decennial census and yearly during various community surveys. Traversing data of such volume and varied nature requires search and filter functions that are robust, easily understandable, and easily tweaked.
Overwhelming results page
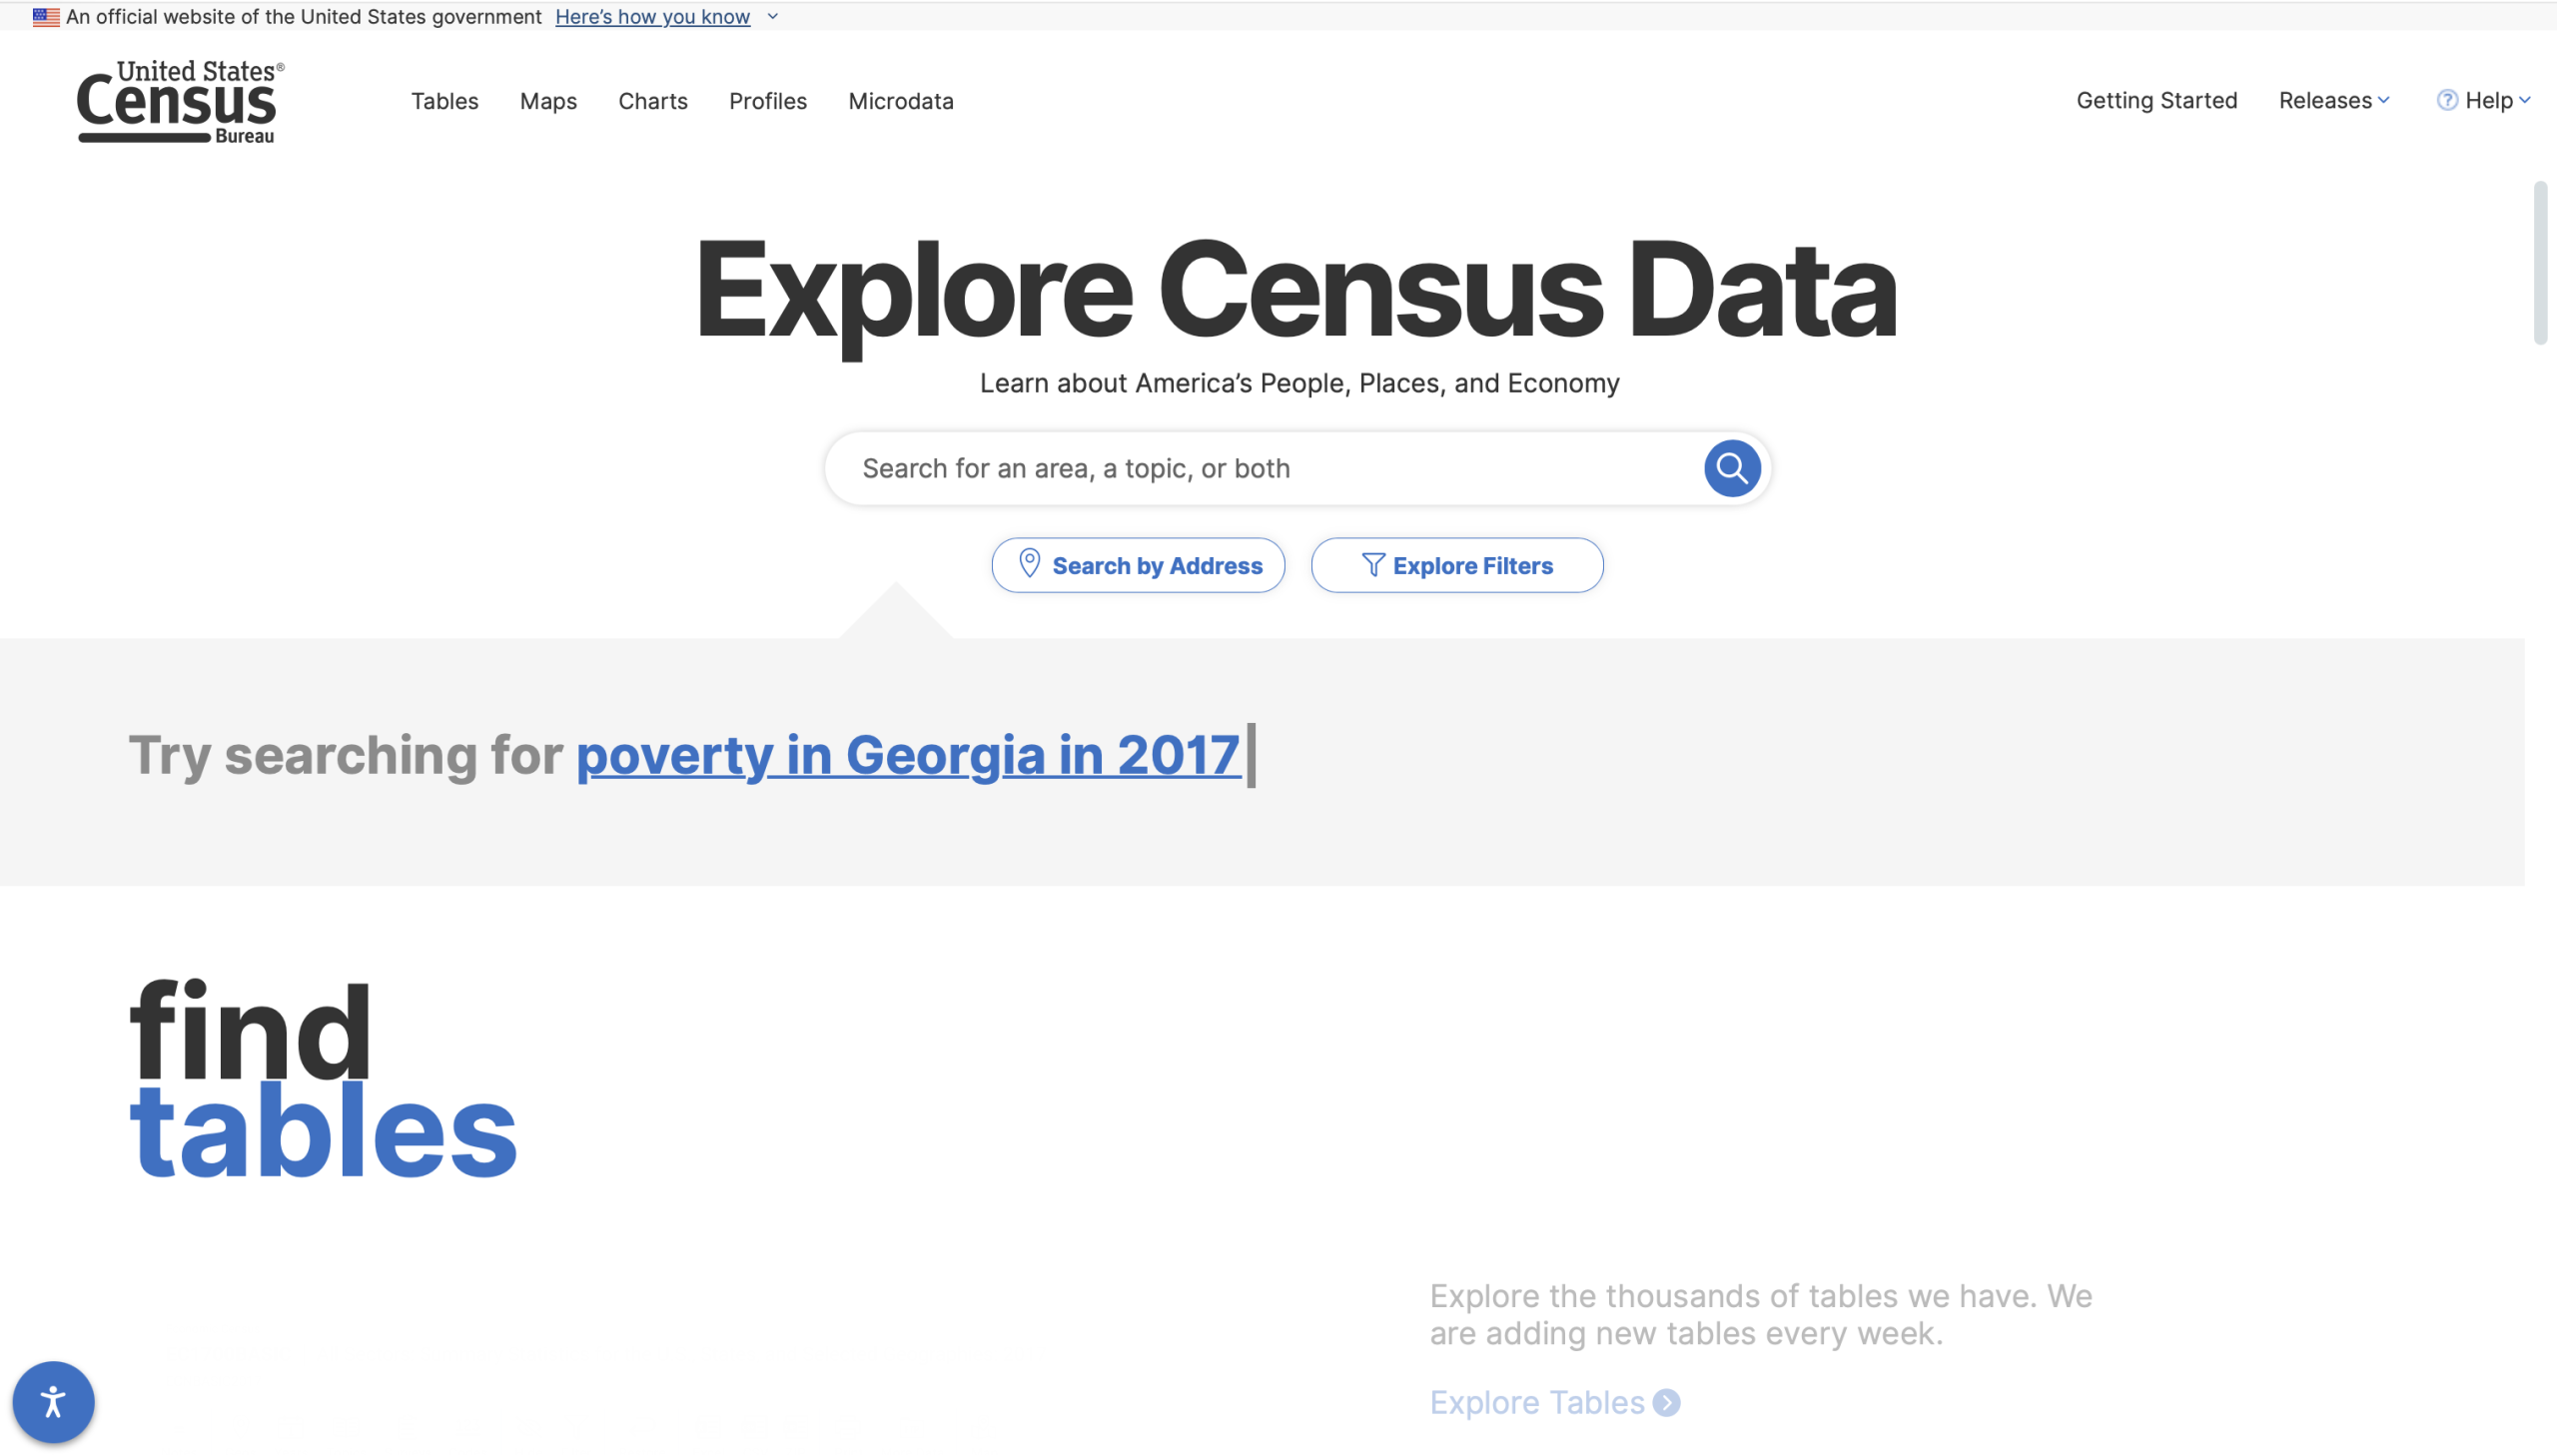
The search function on the home page offers a simple layout reminiscent of Google Search, with a centrally positioned text box that prompts you to “Search for an area, a topic, or both”.
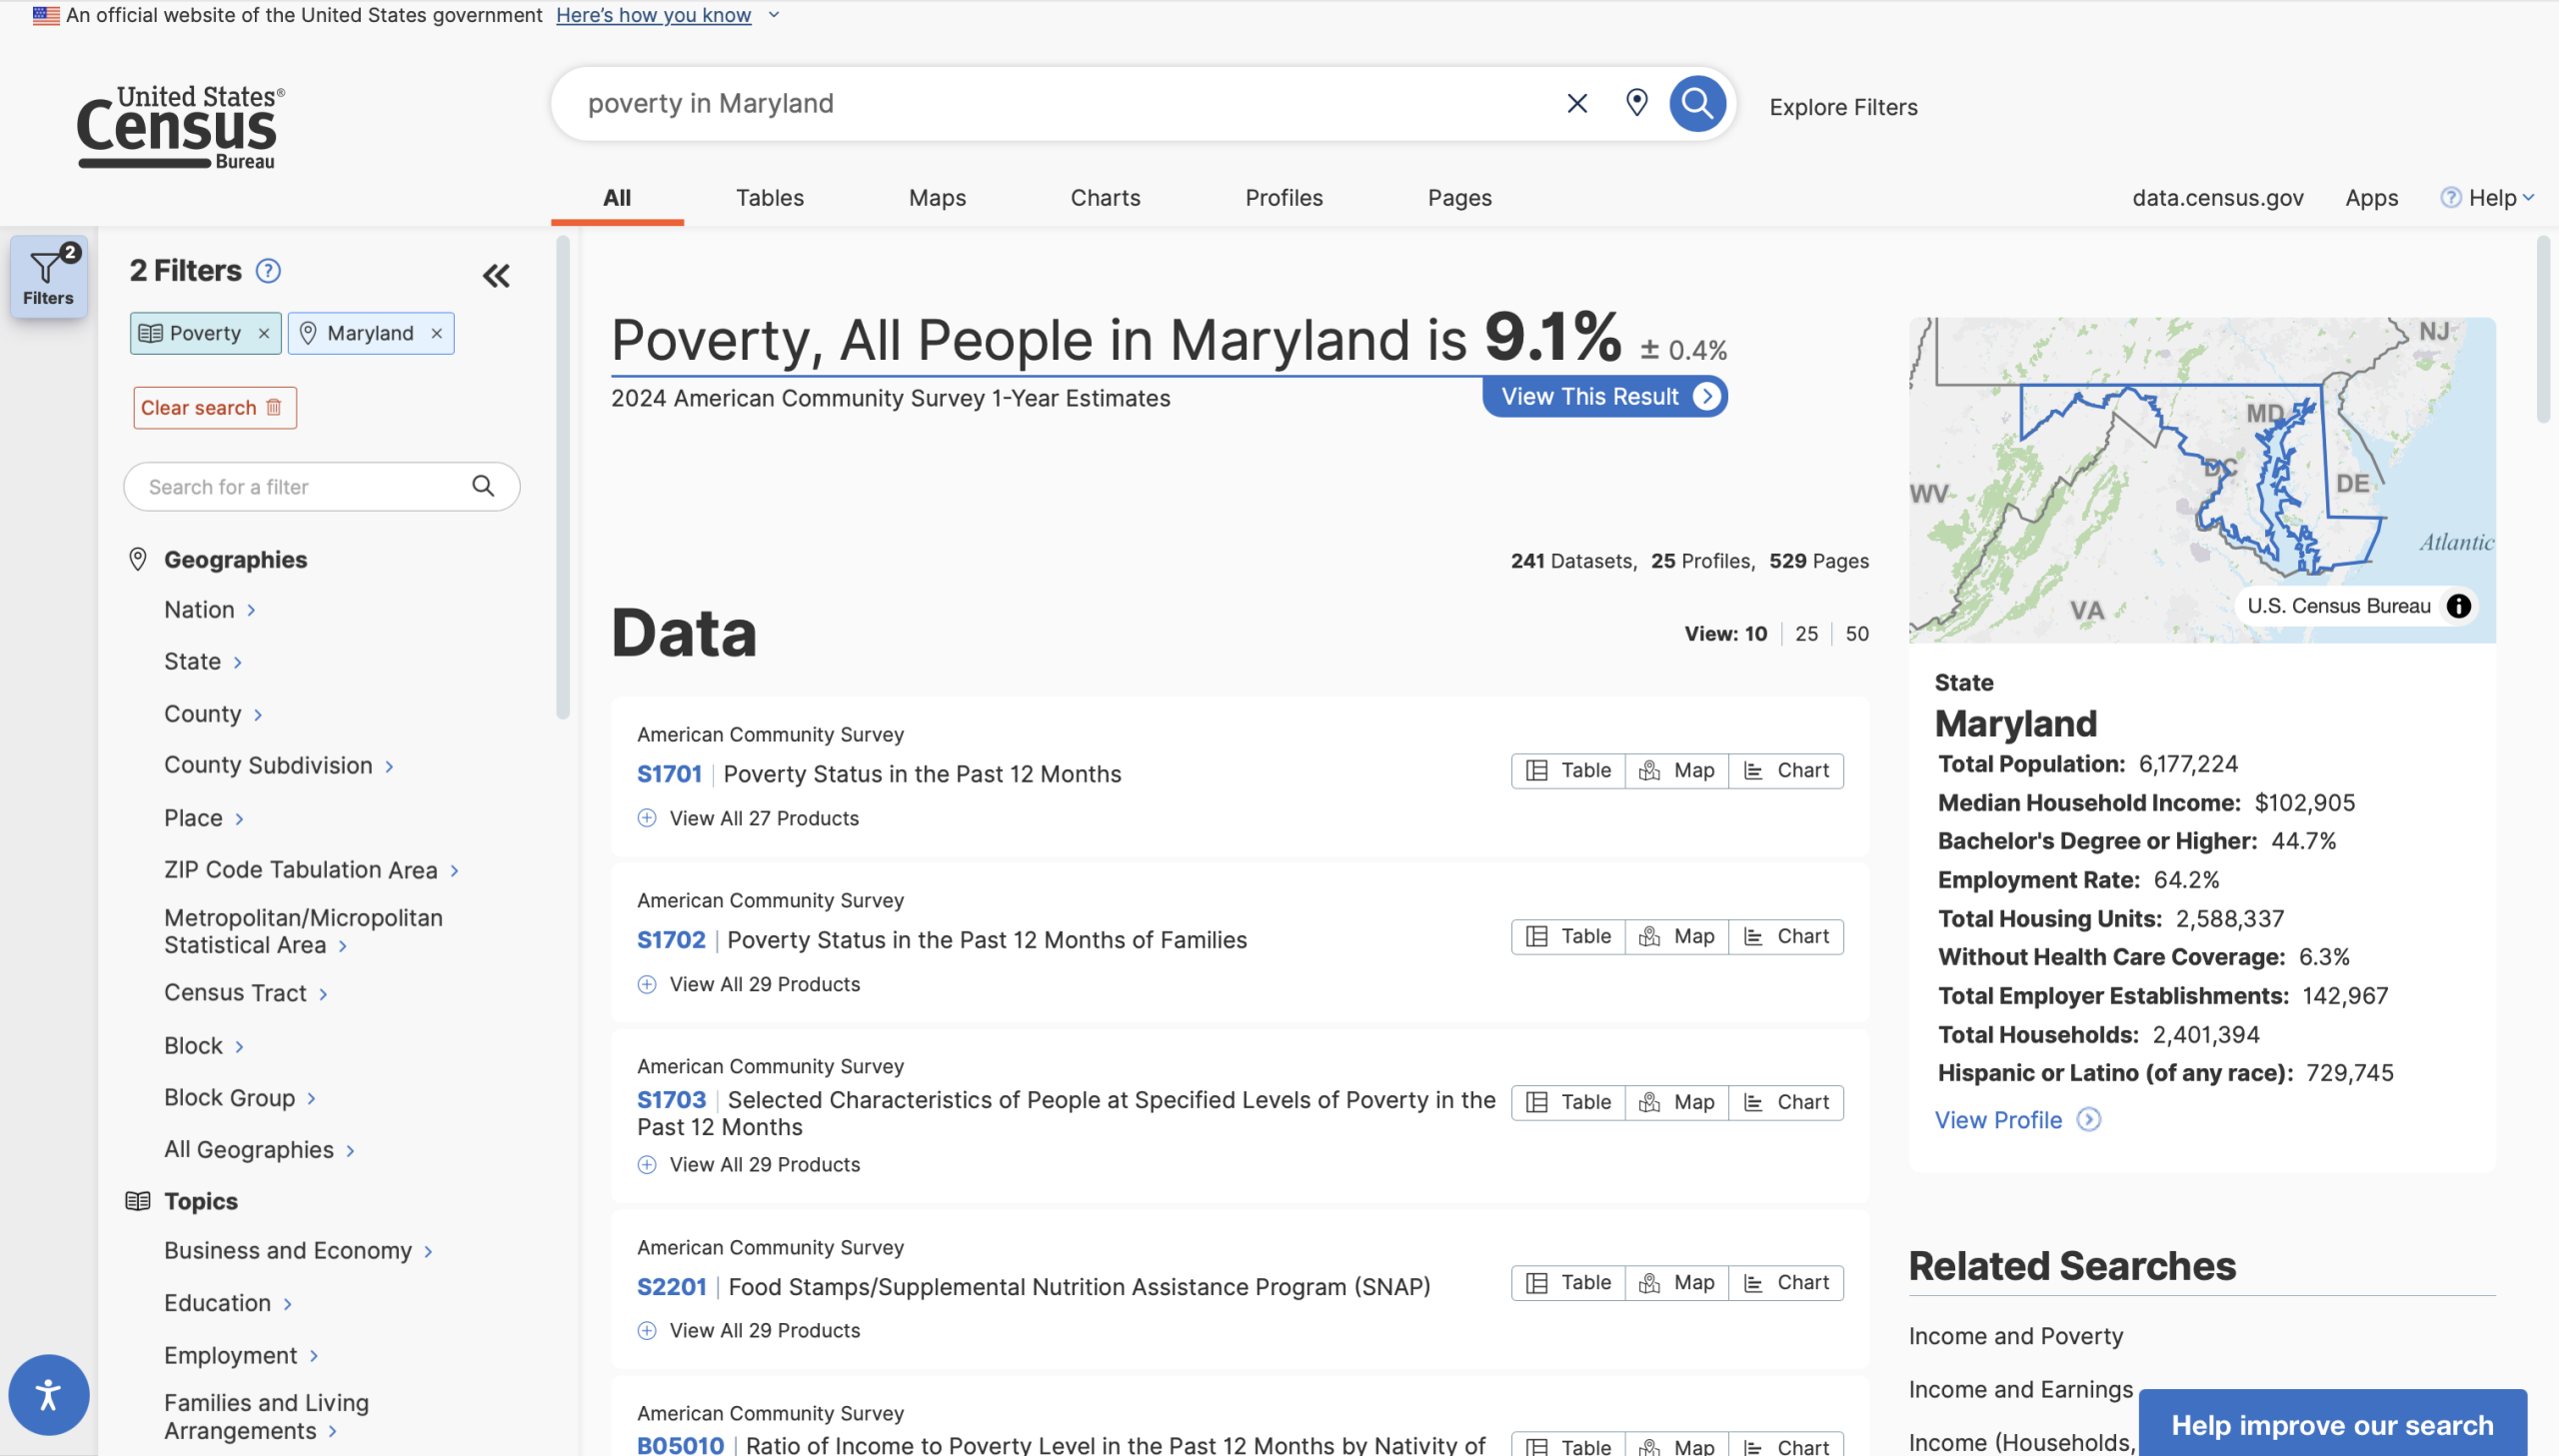
By contrast, the results page is overwhelming, with a glut of undistinguishable signifiers resulting in a visceral feeling of information overload and paralysis. First-time users will have a difficult time creating a system image of the sorting and retrieval process, because the nature of a “Topic”, a “Place” is not well described or demonstrated. The search and filtering process should walk users through a progressive series of steps with leading questions: What is your topic of interest?, Where is your area of interest?, What level of specificity are you looking for?, and so on.
Conceptual model of search term application
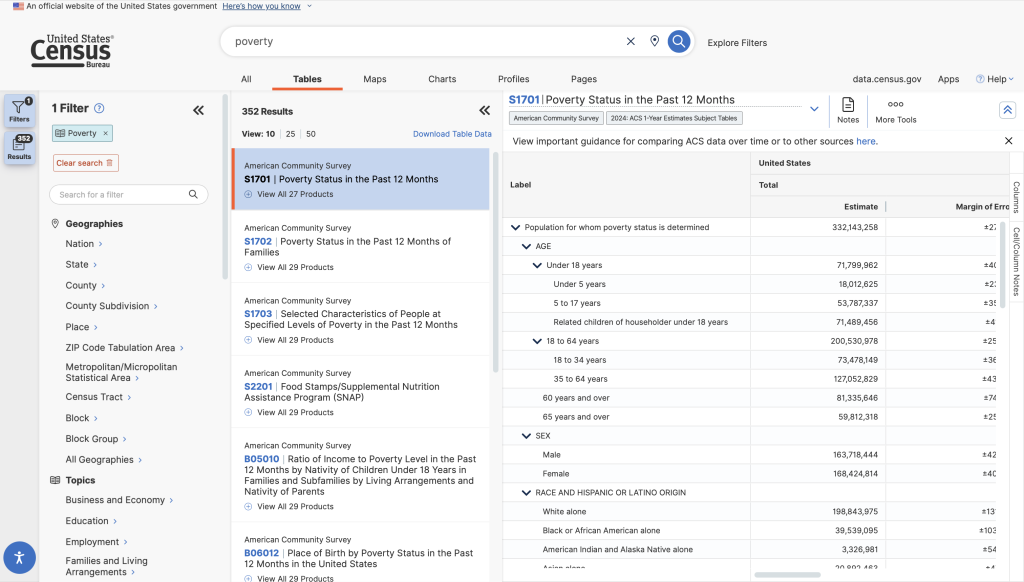
There should also be a more thorough explanation of preset filters and a looser “fuzzy” search. For instance, searching for “poverty in Maryland” instantly returns exactly what I’m looking for: a list of tables tagged with the pre-existing “Poverty” topic, filtered to only show information about Maryland.
However, if I were to search for “average rent in new york city”, things start to break down.
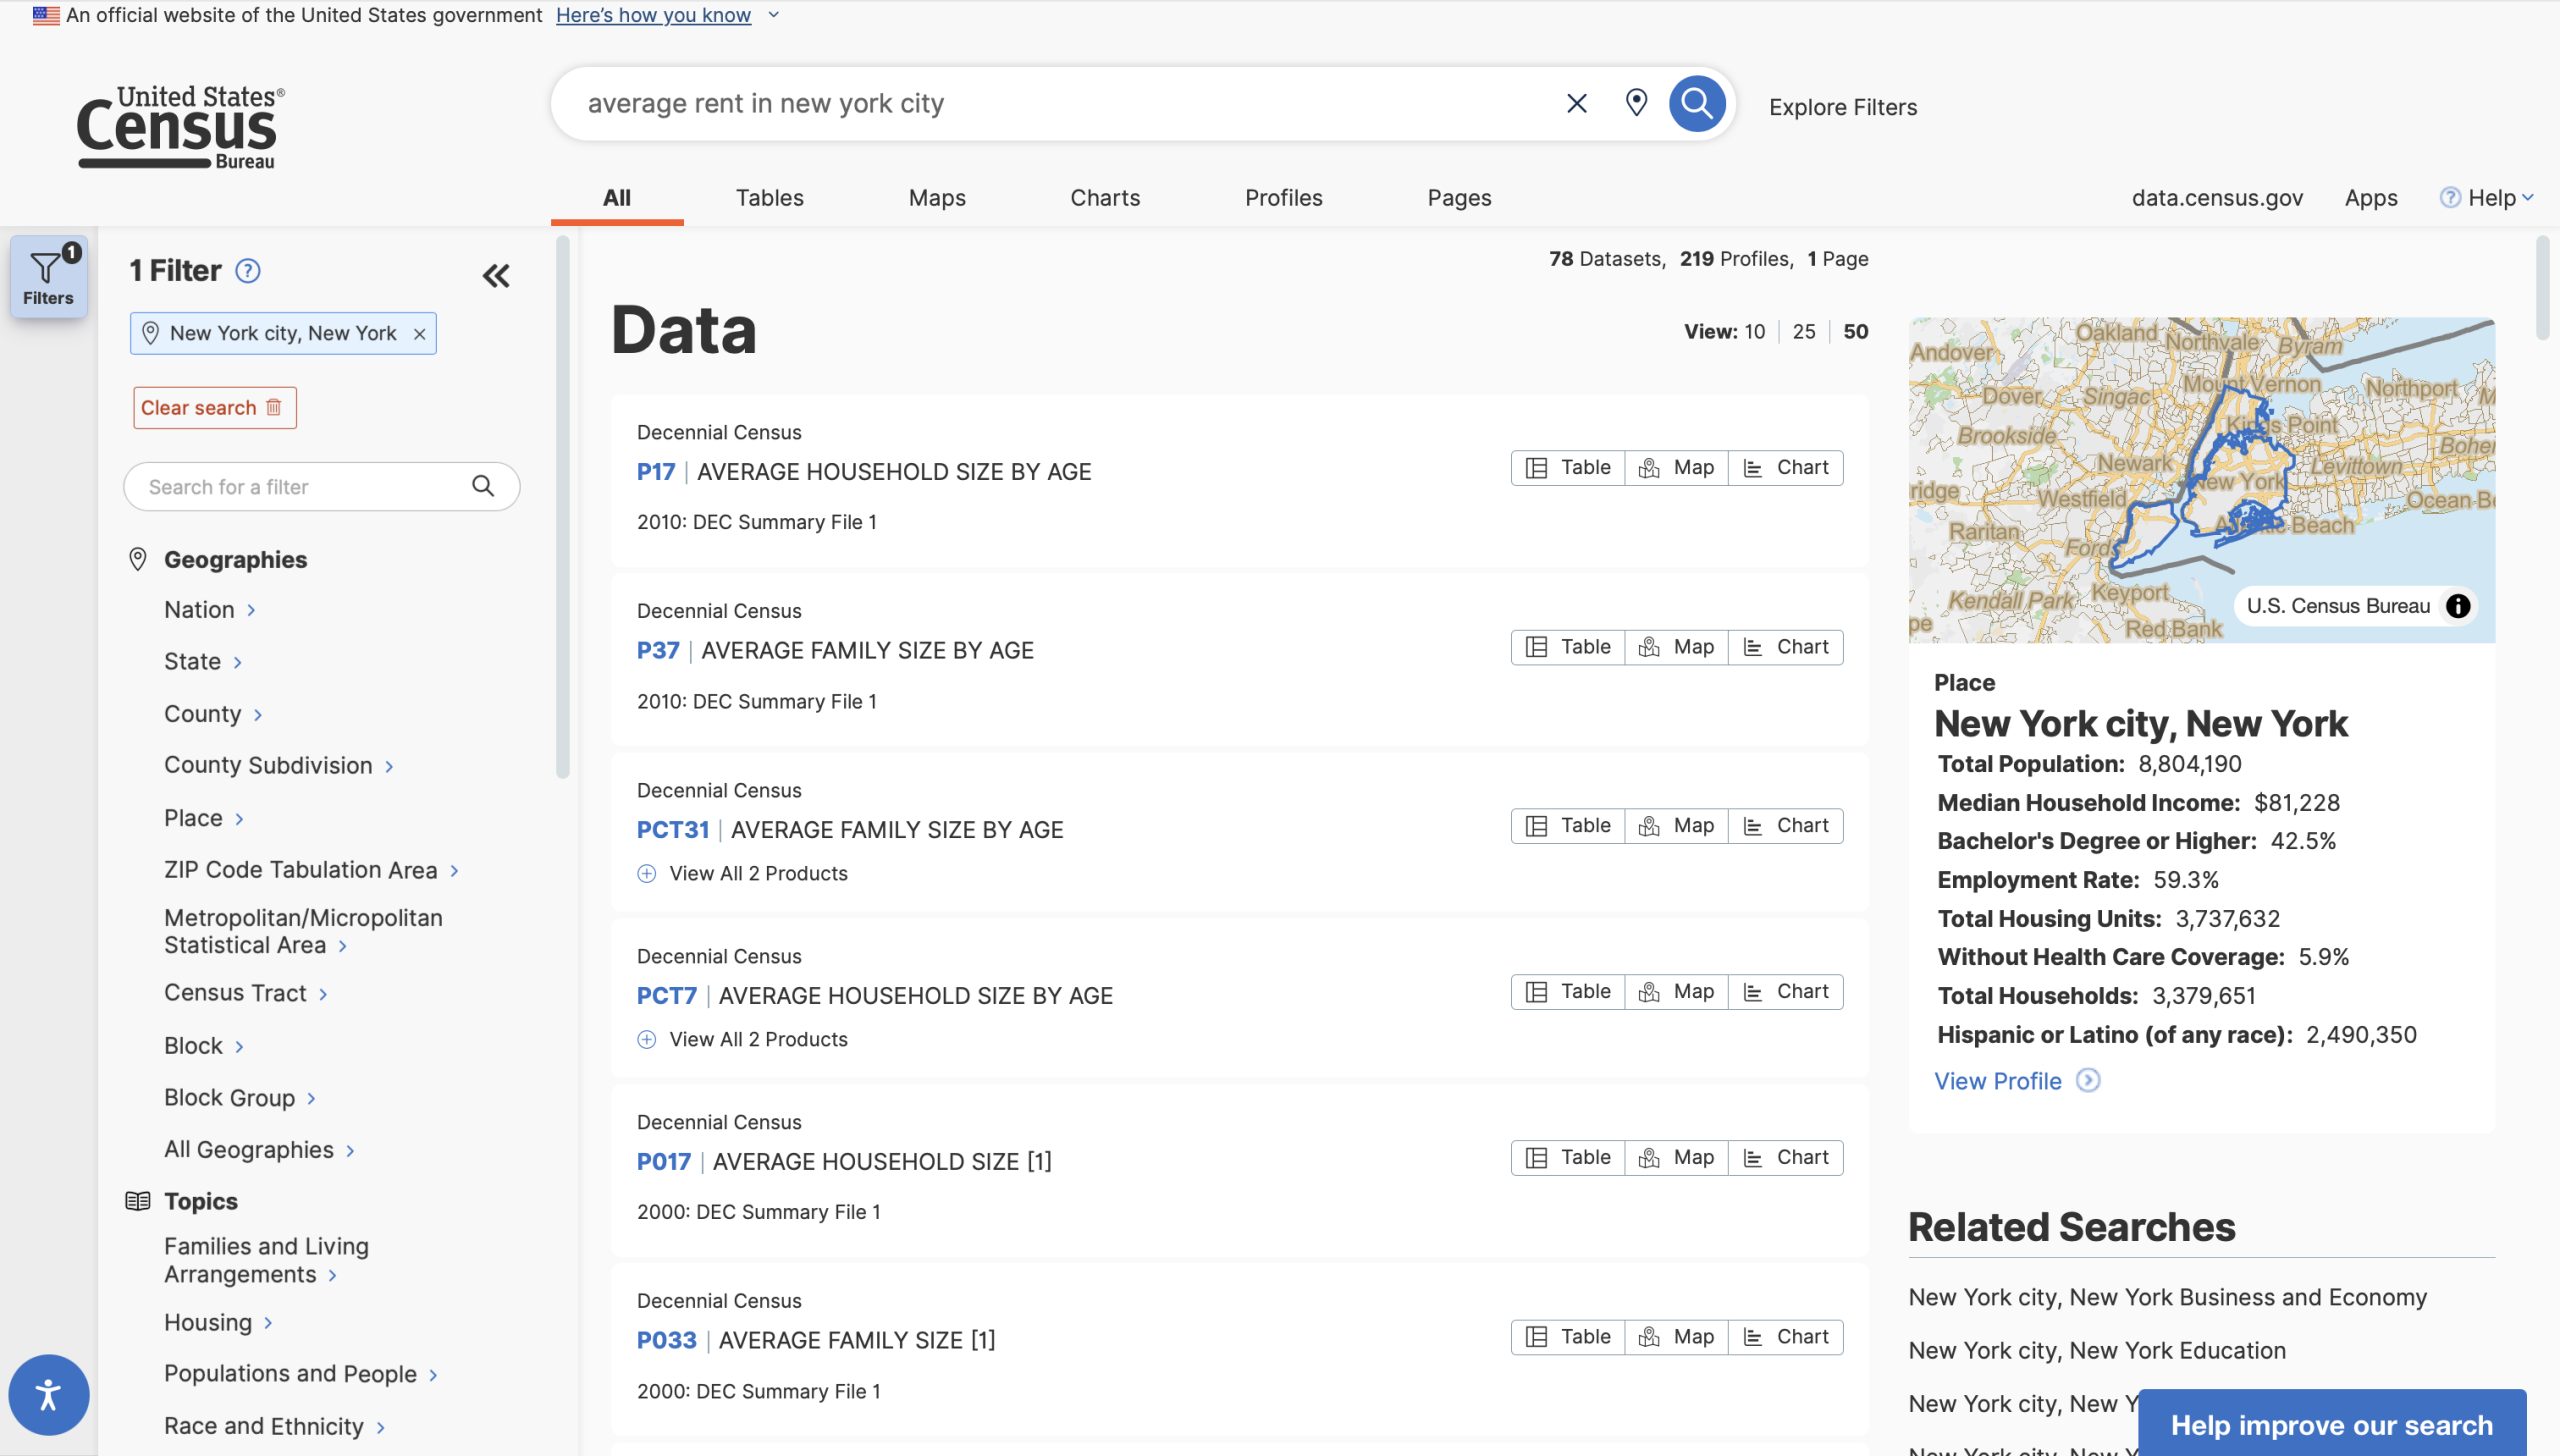
The results are correctly filtered to all five boroughs, and it indicates that the topic is “Housing”, but none of the results have anything to do with the topic of rent. There is a relevant table available – B25058 Median Contract Rent (Dollars) – but it is nowhere in the pages of results.
The search seems over-constrained when it does not match the word “average” to the concept of common measures of central tendency, leading users to believe that readily available information does not exist. This search should be “loosened” so that it can parse common statistical/scientific terms and match them to related concepts, and the website should foreground
Using the Census API
Hidden API Affordances
Like most modern data stores, the Census Bureau has an API that allows users to request and integrate their data directly into processing workflows written in programming languages such as Python or R. While it is possible to perform filtered searches via the API, users often find that the easiest way to figure out what data is available and preview its form is through data.census.gov. This use case seems to be known to the US Census Bureau — the API User Guide page has a link titled “Explore Census Data” that links back to data.census.gov — they could do much more to make the specific affordances of the API discoverable and usable. Once a user has found information, clicking the (hidden) API button under more tools gives them two links, with no explanation of how to use them or even a link to the Bureau’s own existing user guide.
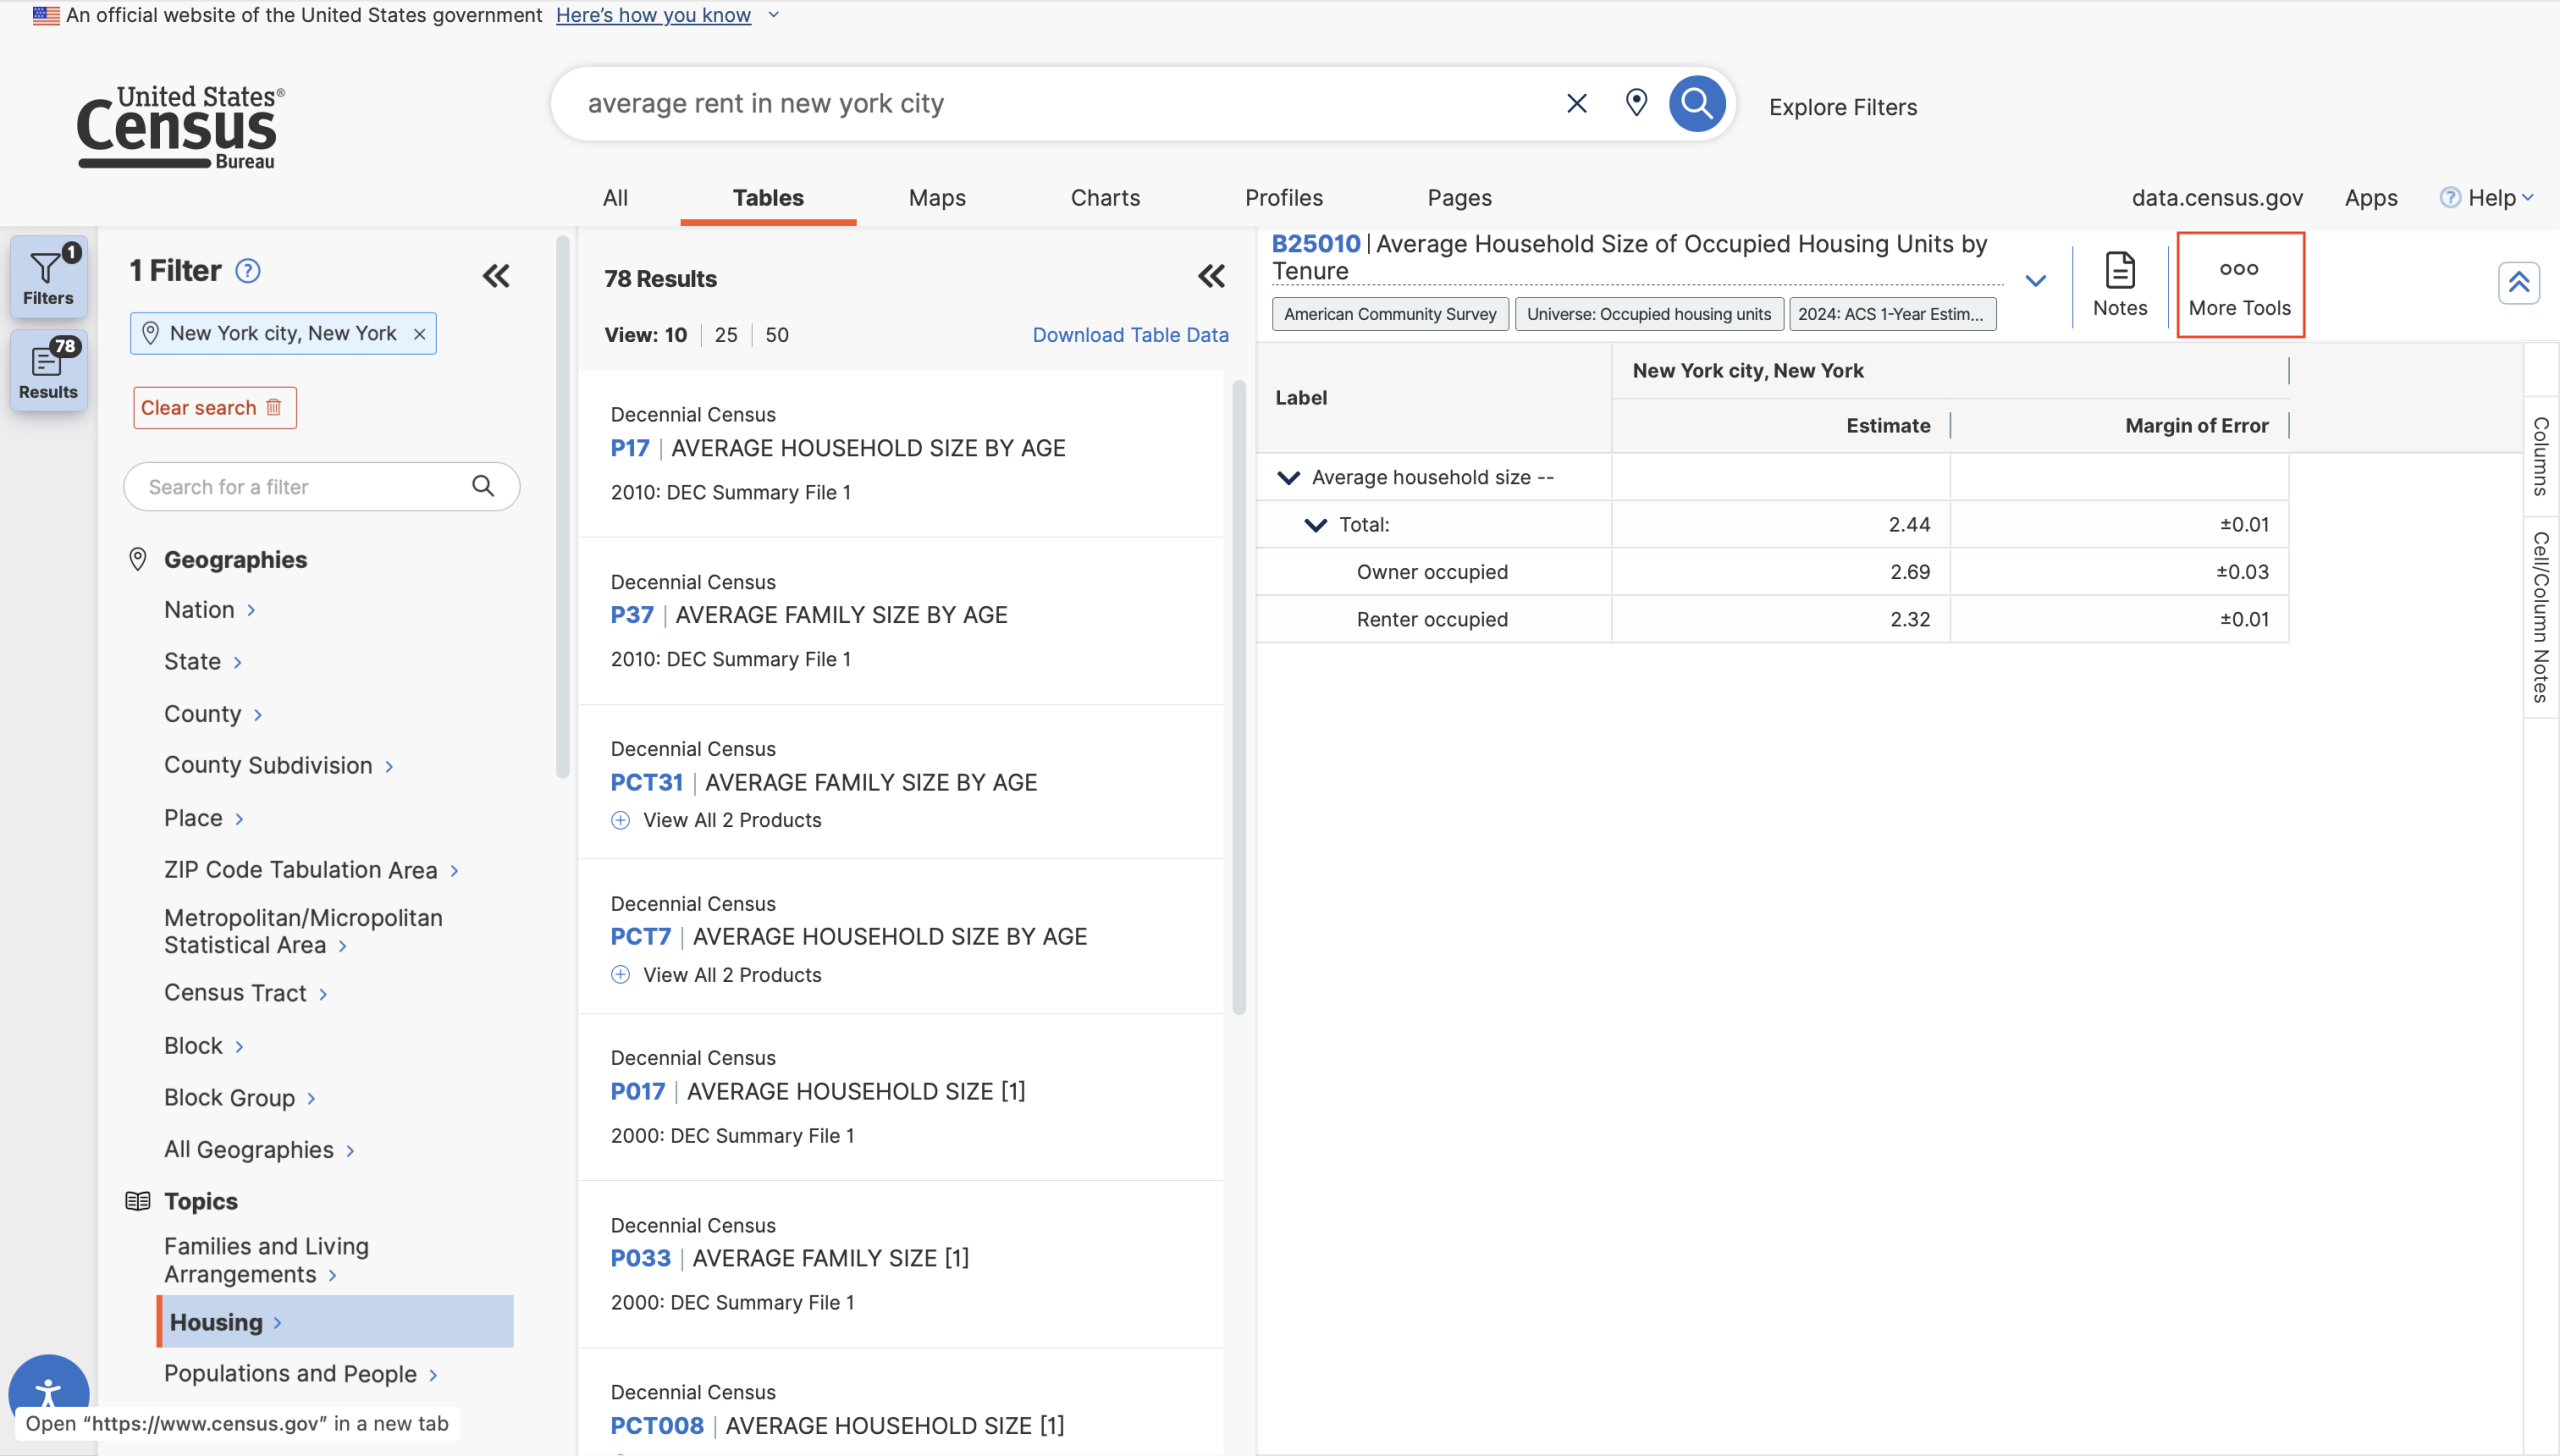
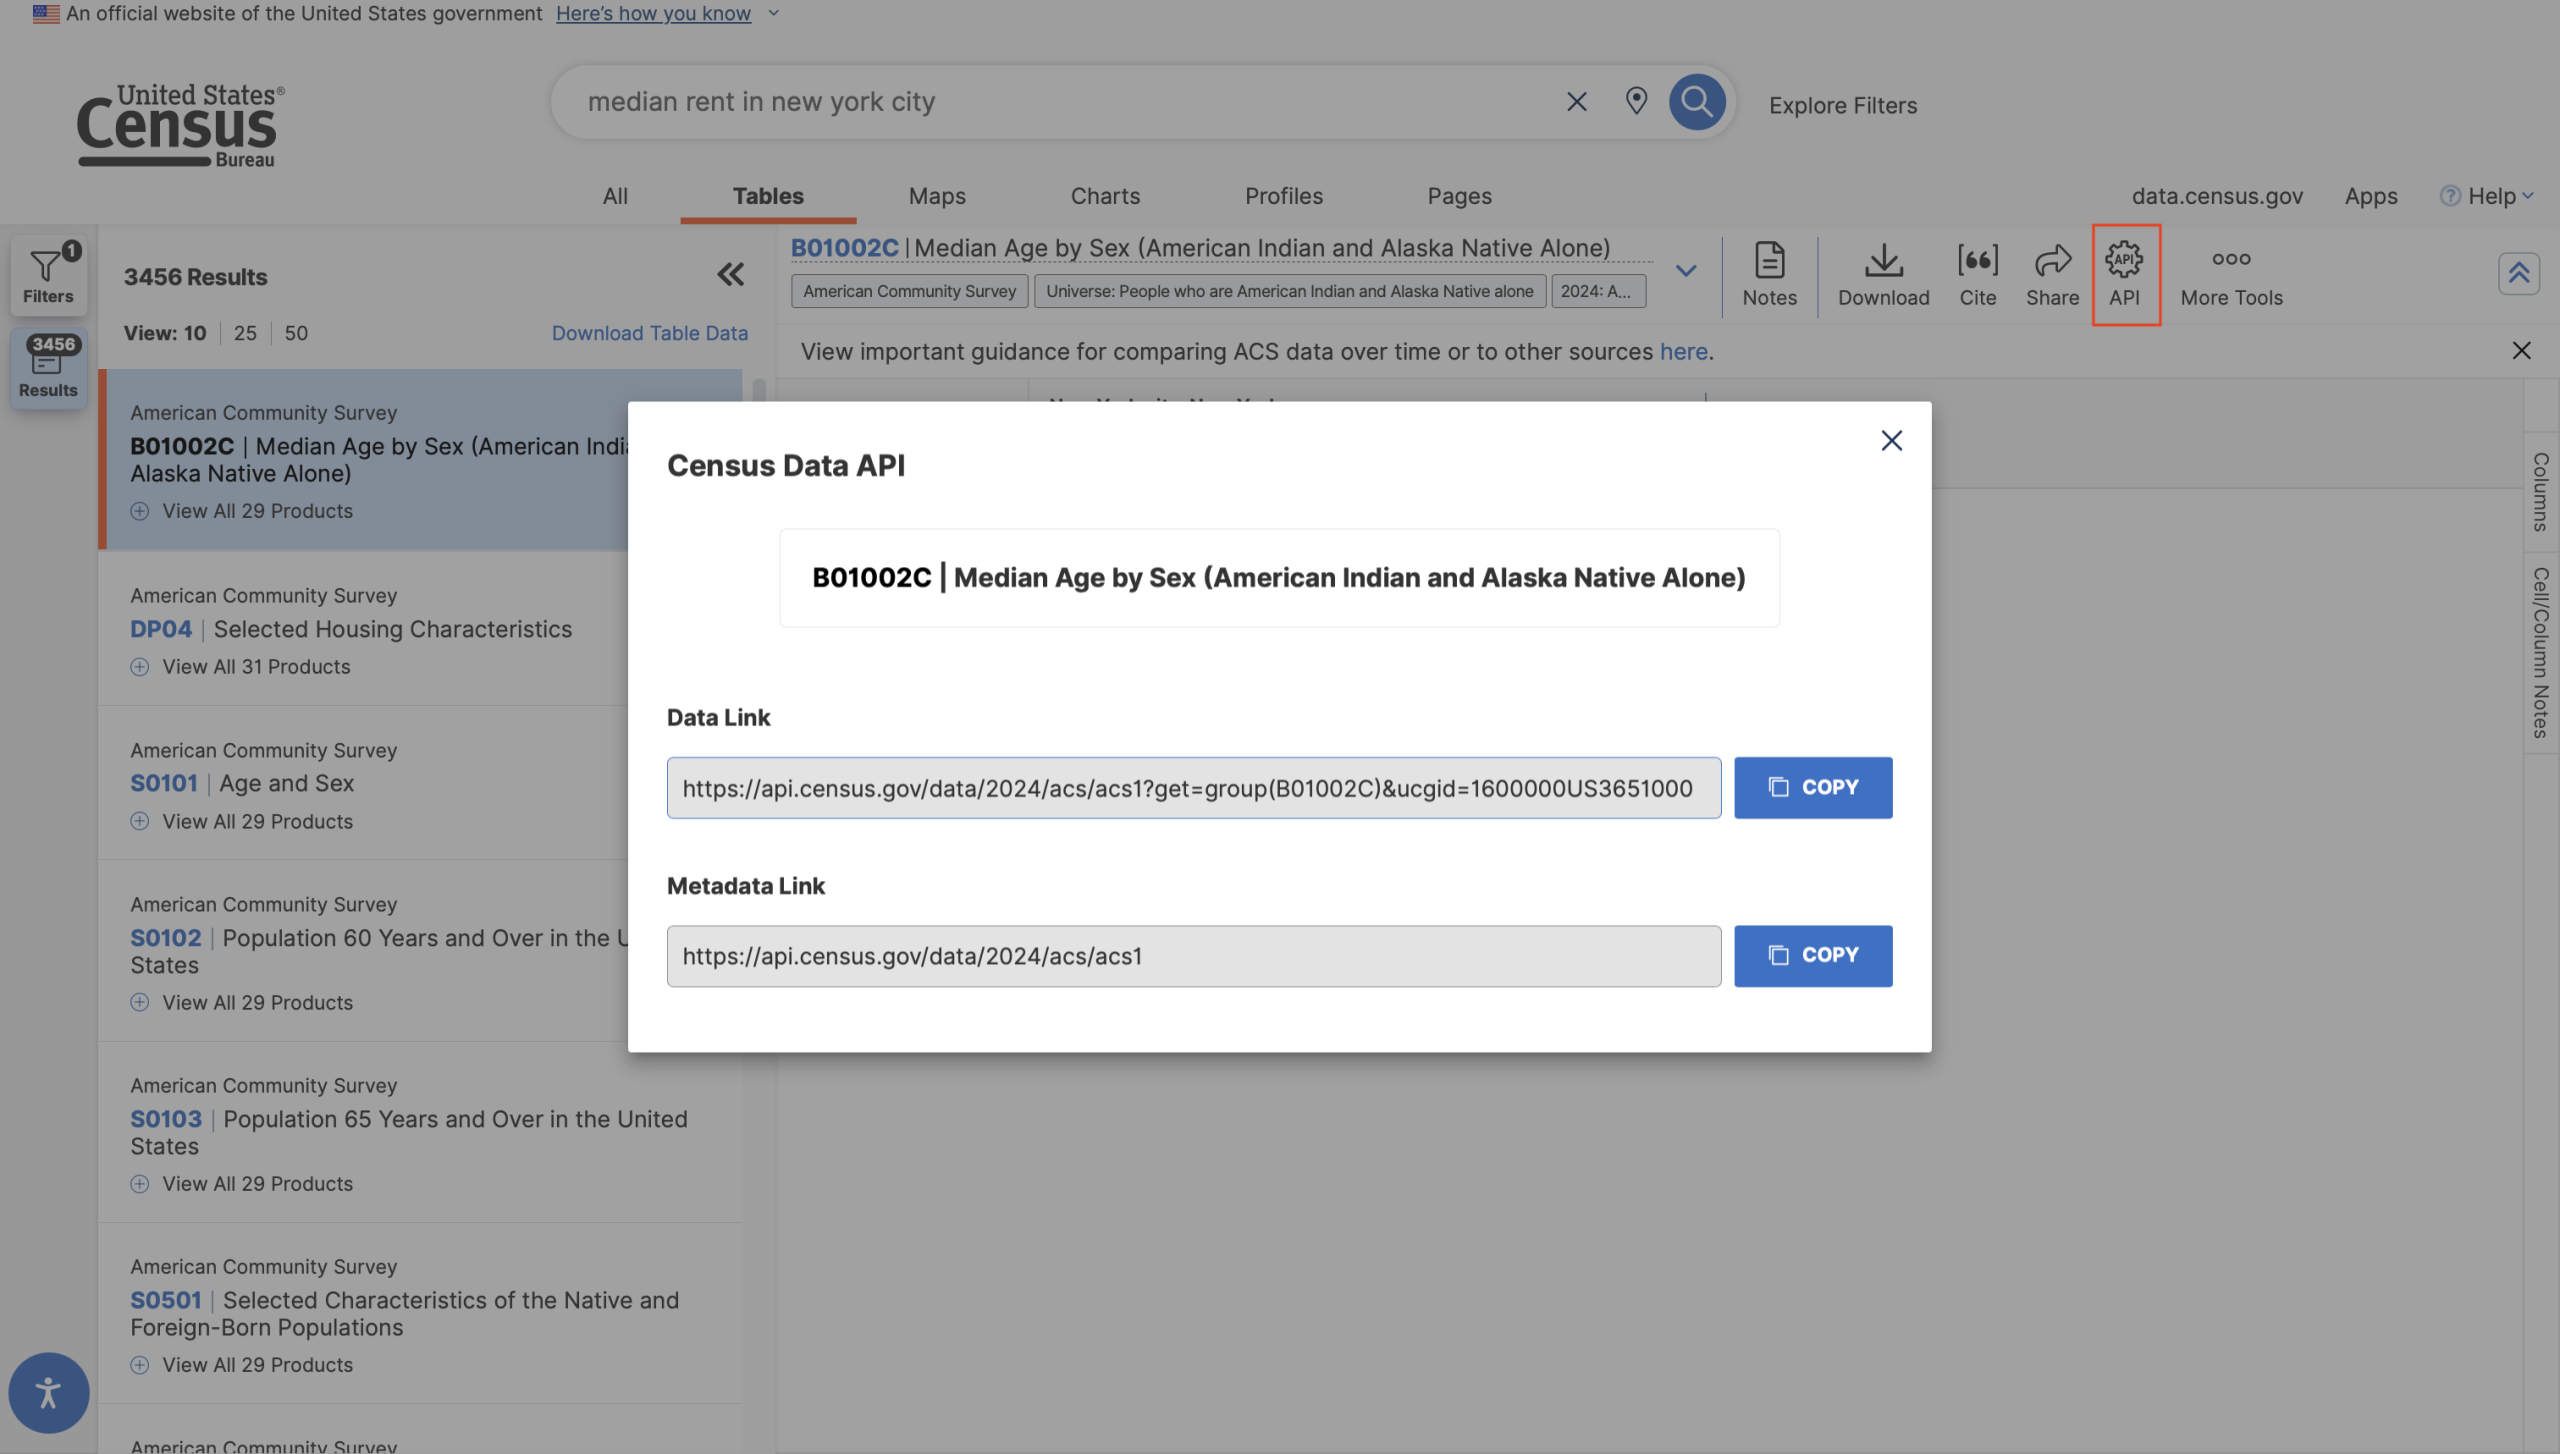
The affordances and constraints of the API remain woefully unclear to the casual data explorer. Some Census API libraries will not download calculated or computed tables — i.e., any table with normalized statistics — instead, these libraries work only with detailed tables (or base tables), which only include raw numbers, never percentages or rates. Base tables can be distinguished by their names: they begin with a “B” (for “base”). This is crucial information even for users who are not using the API, but it is not discoverable anywhere on the site; I first read of this distinction in the user documentation for pytidycensus! The naming conventions of these tables are important clues into what information might be found within and how it might be used, and even though the type of table is indicated by a small tag, users have to search themselves to figure out how a “Data Profile” differs from a “Subject Table” and so on. This information should be made readily available to the user when they click on the tag.
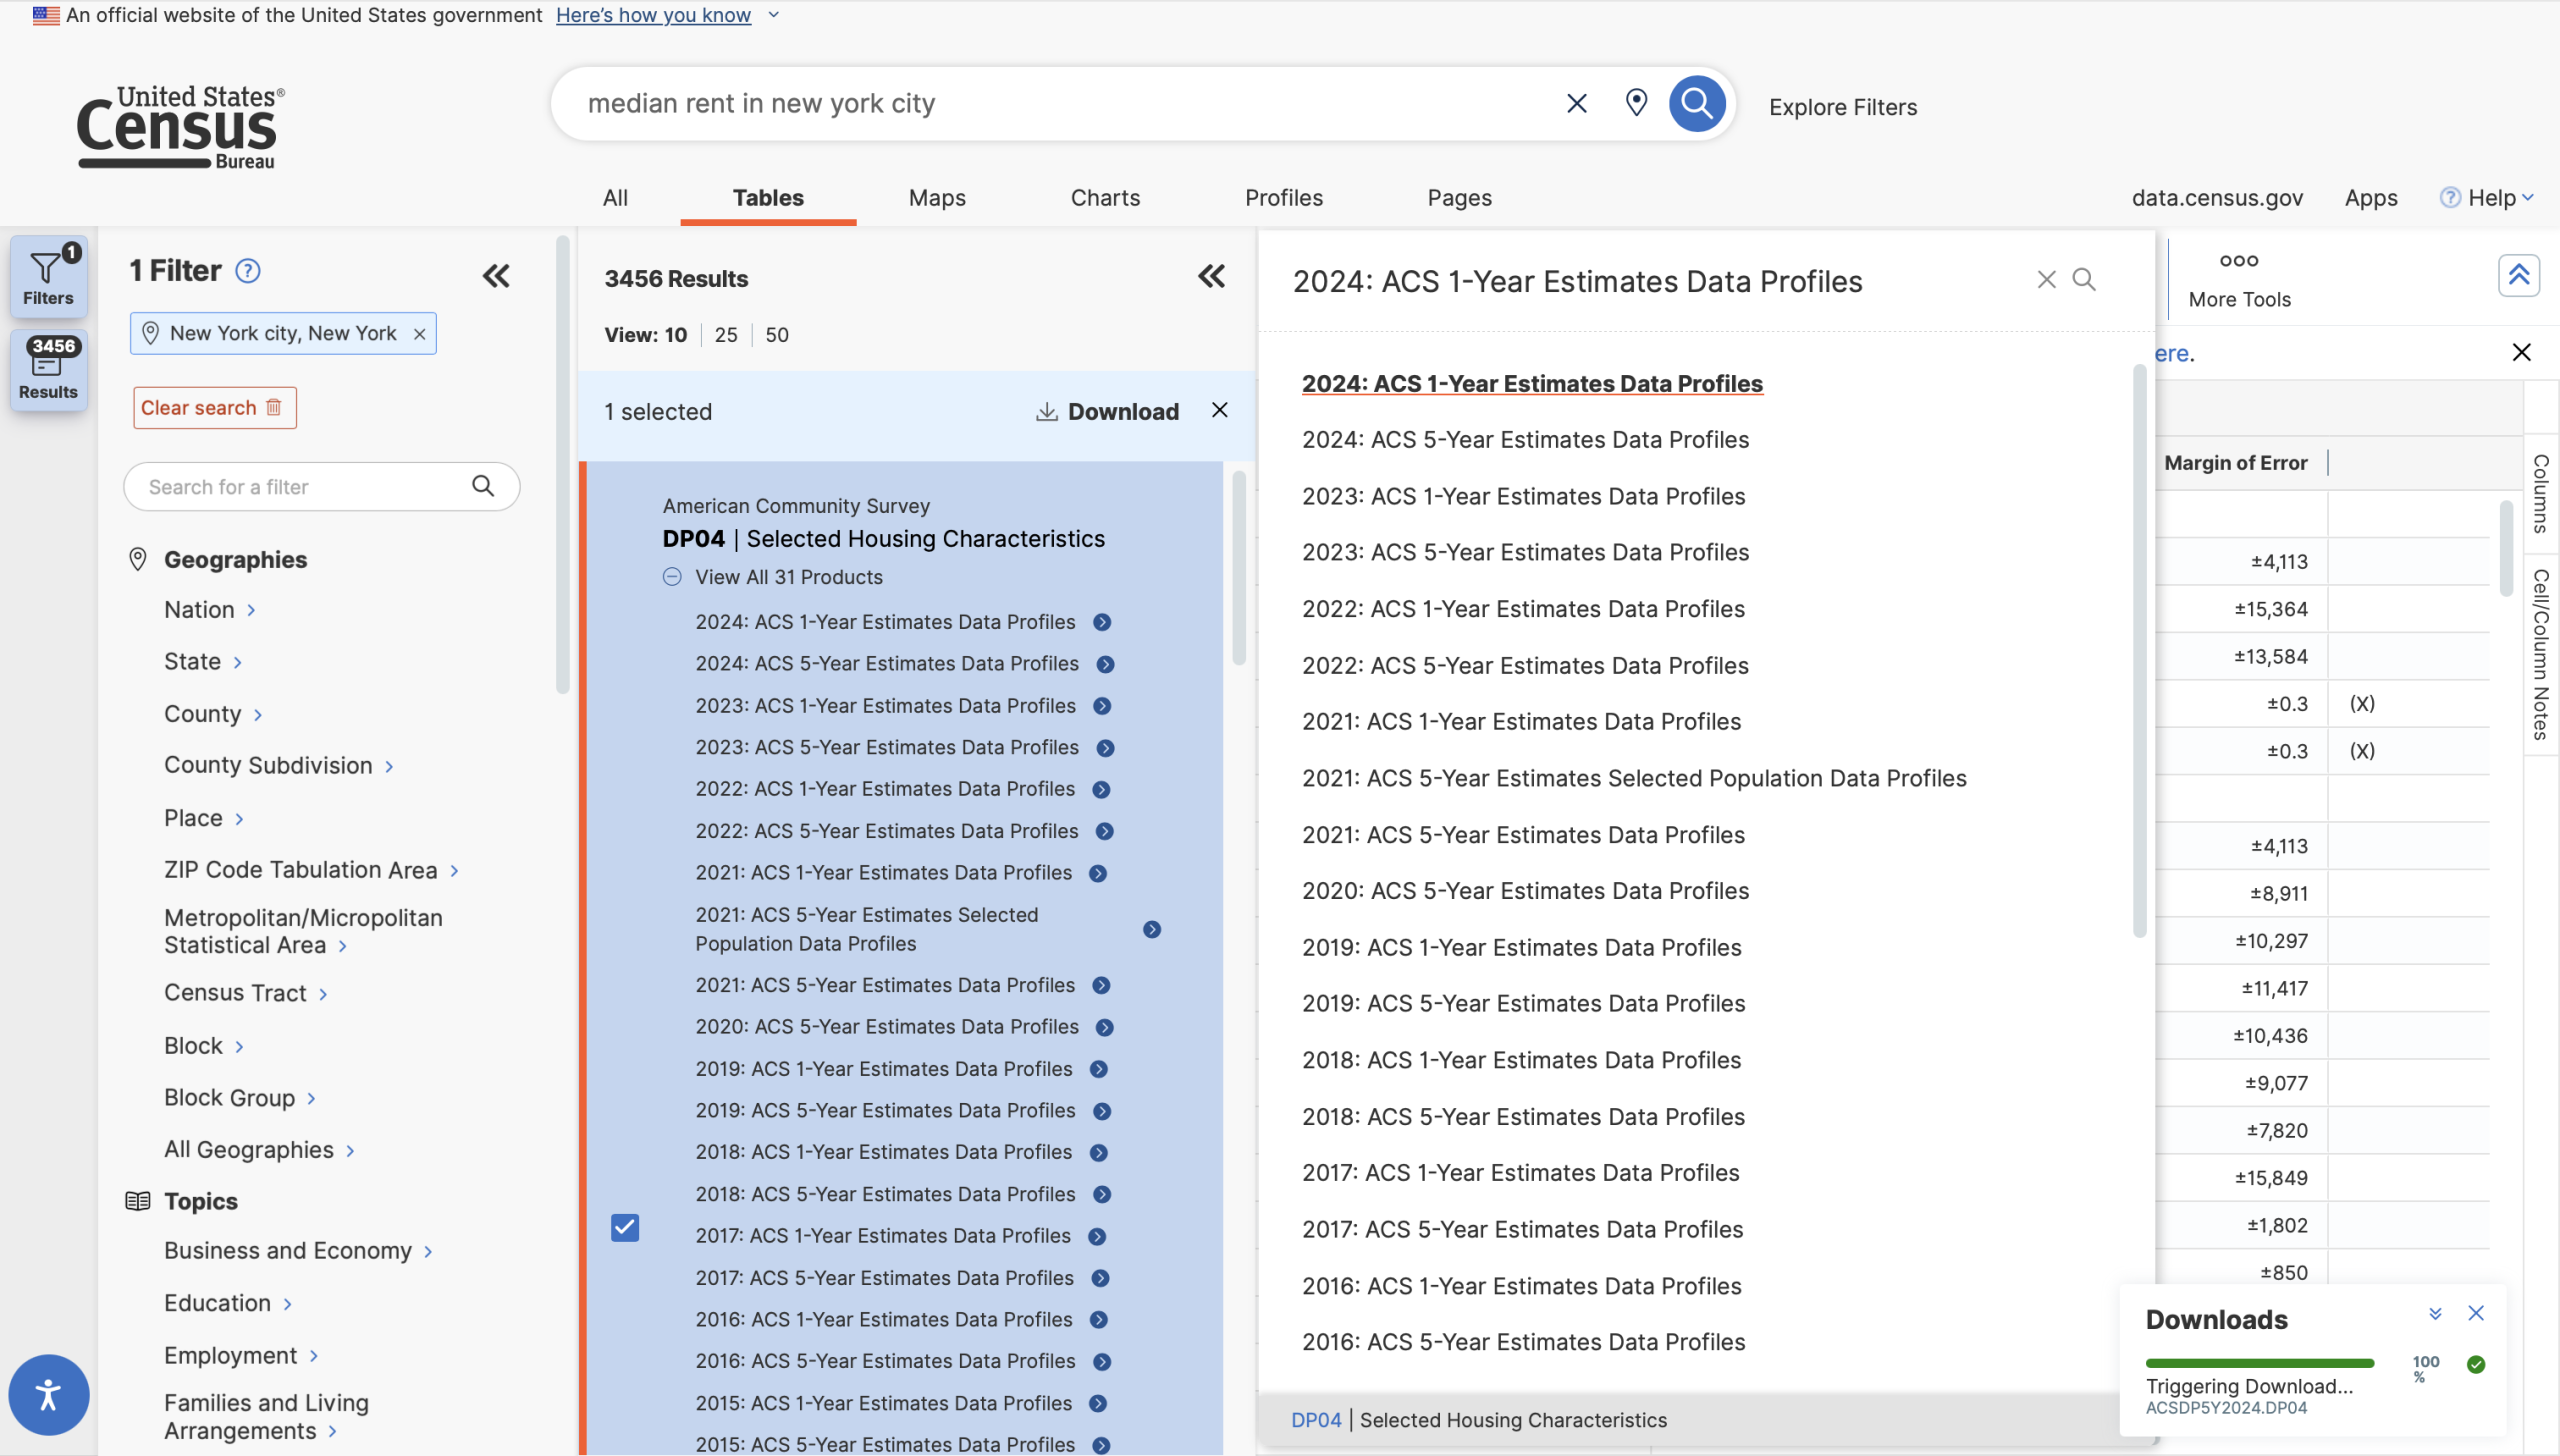
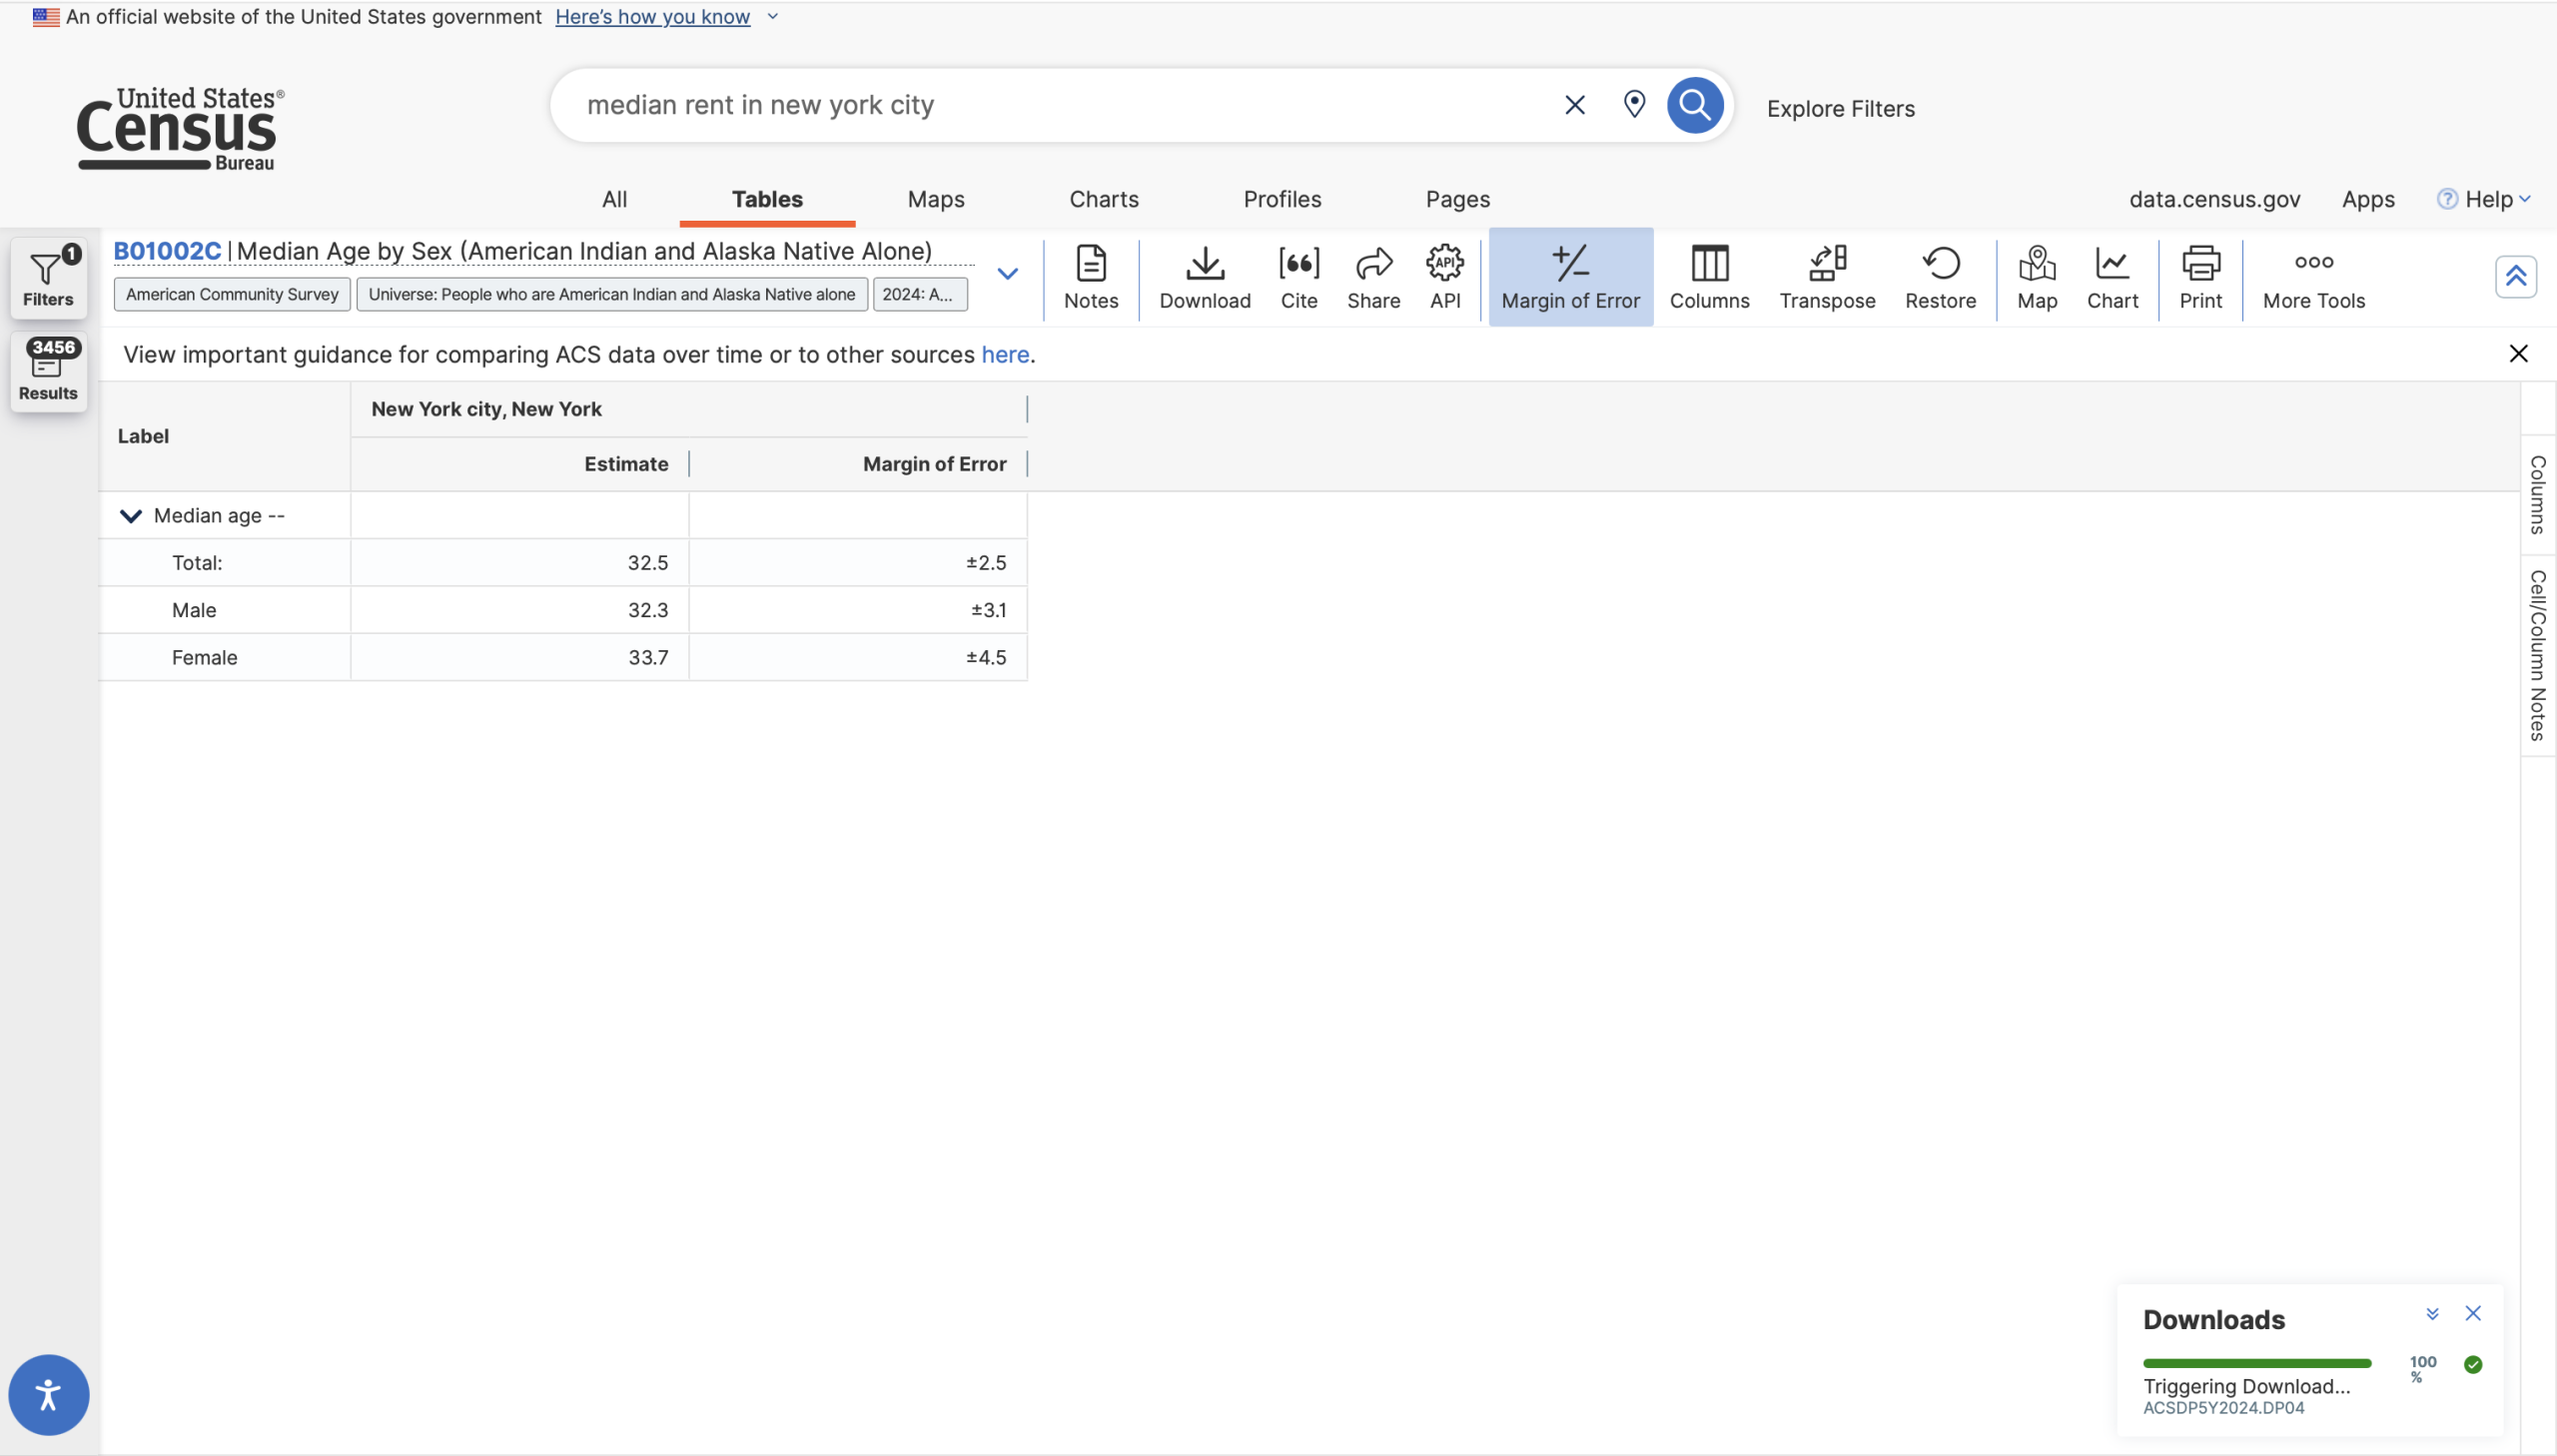
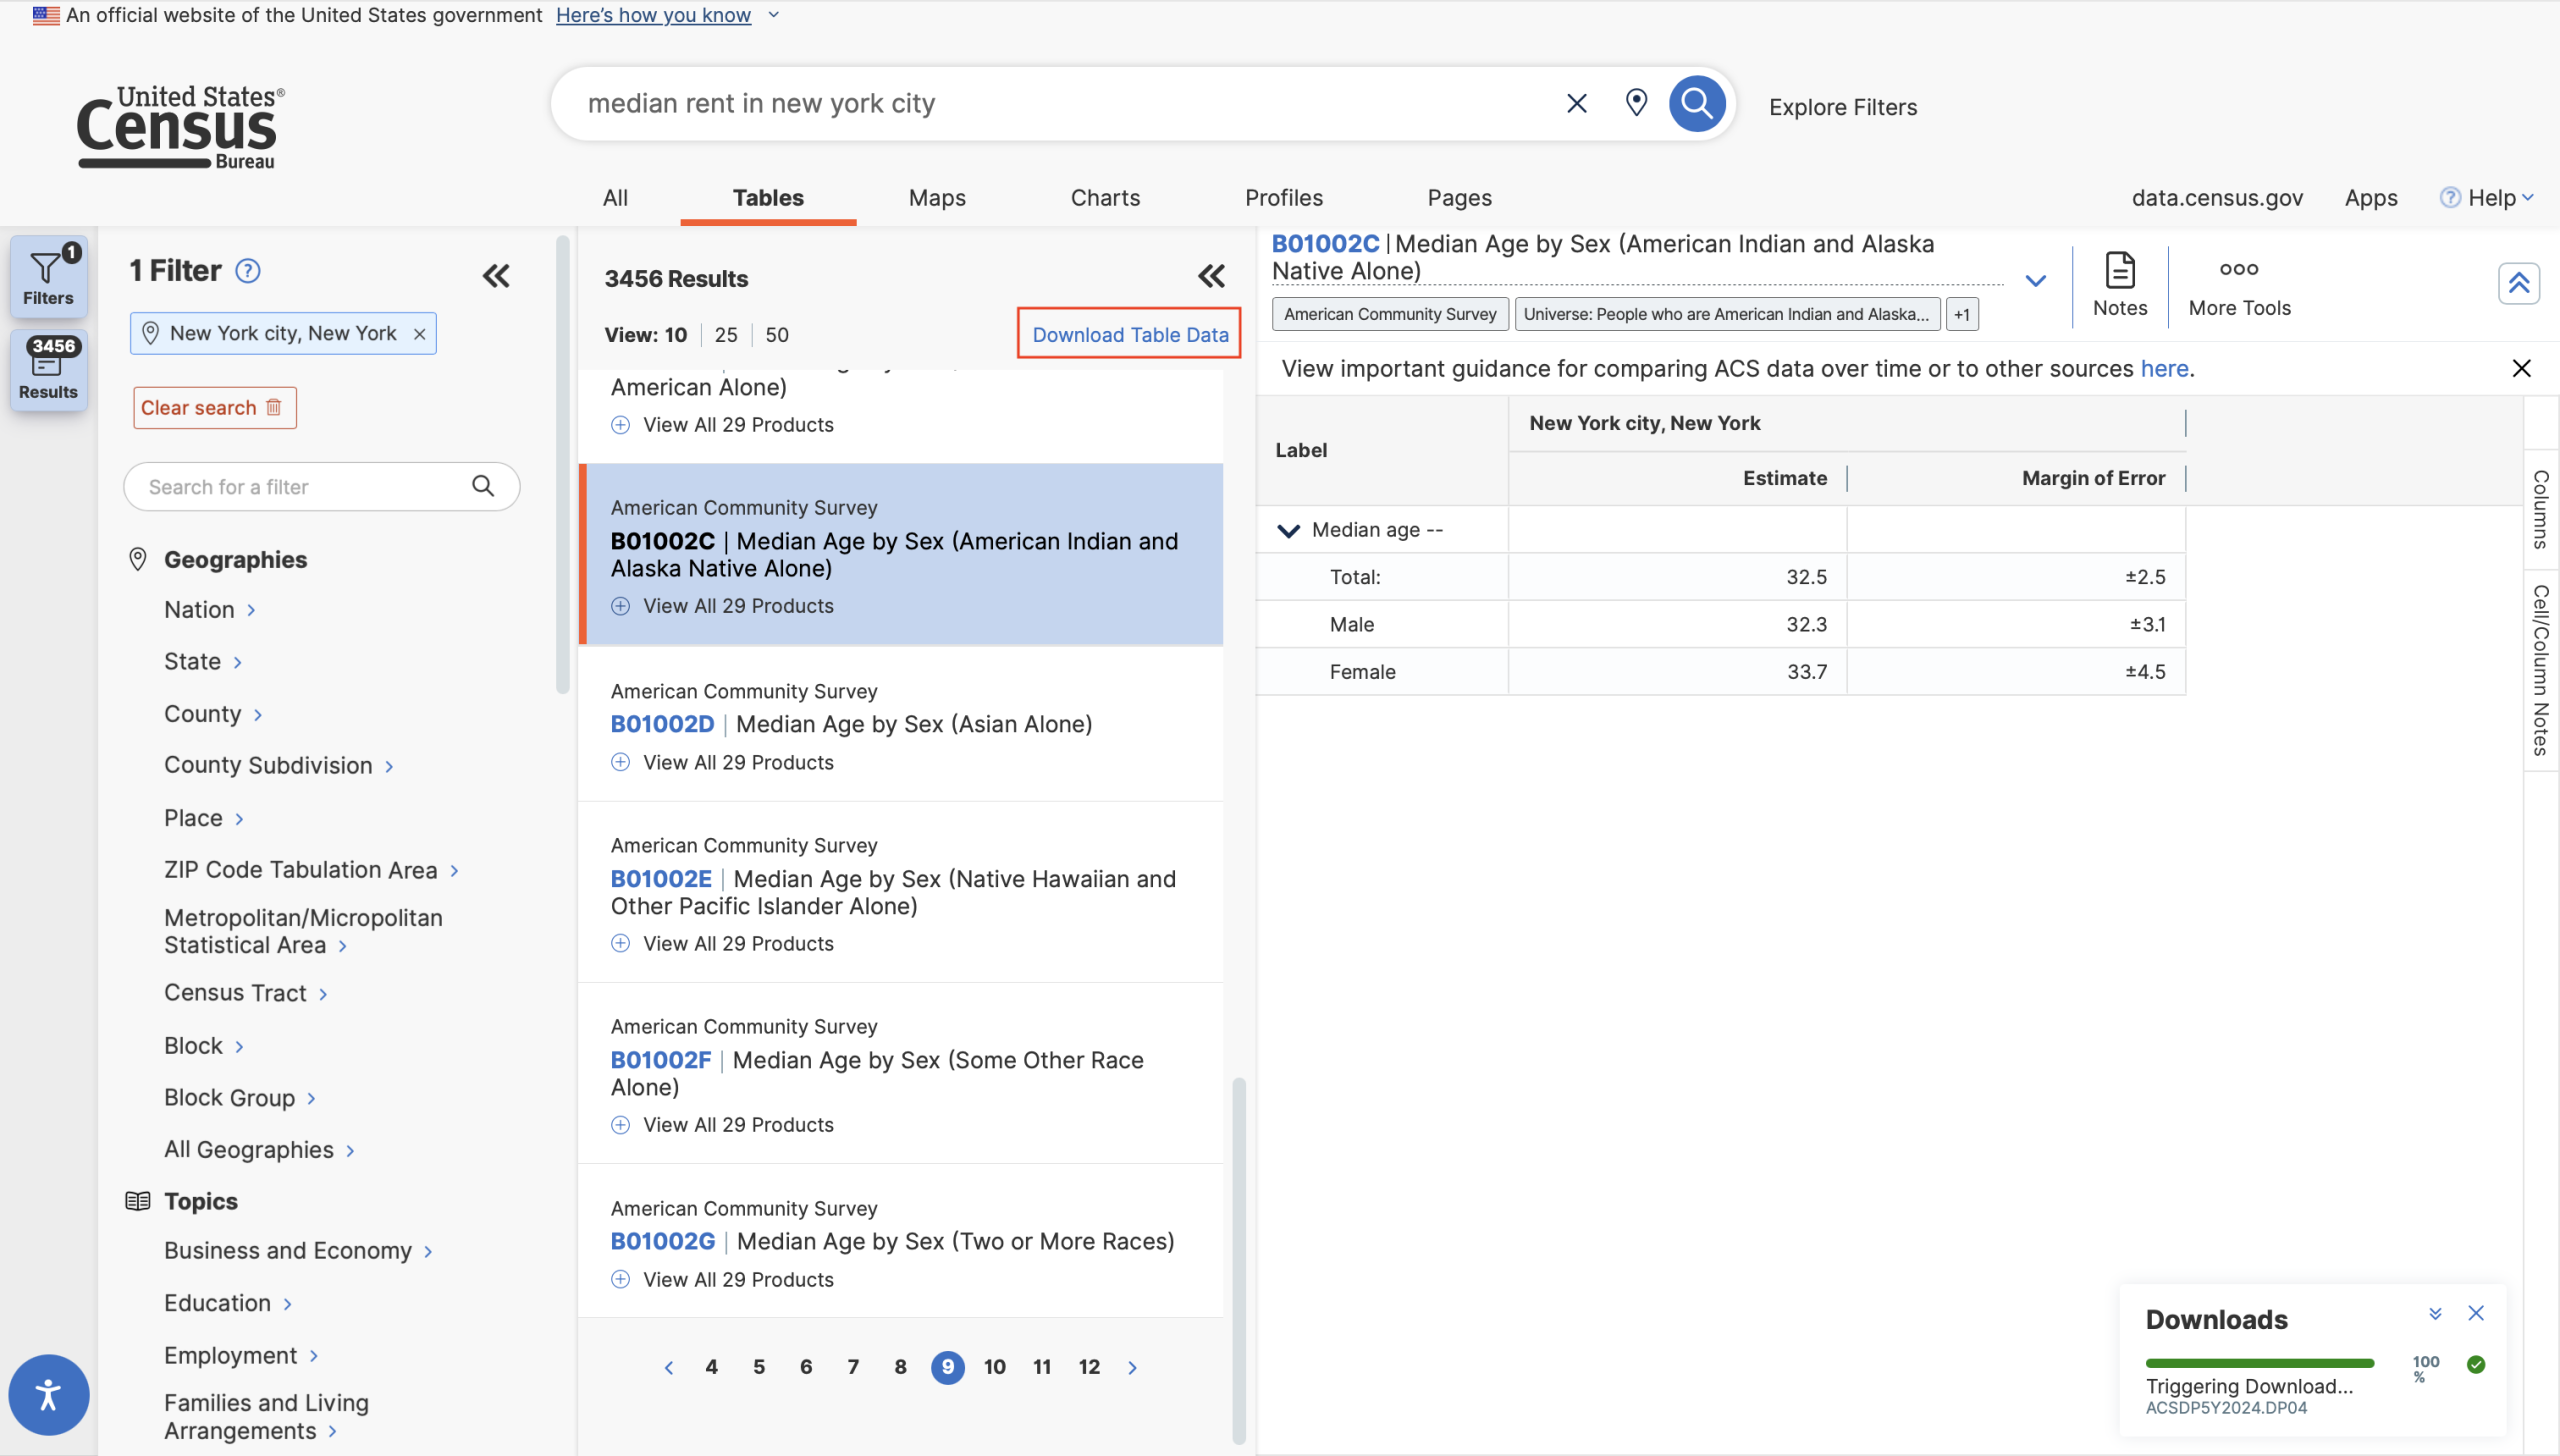
Hidden Access Codes
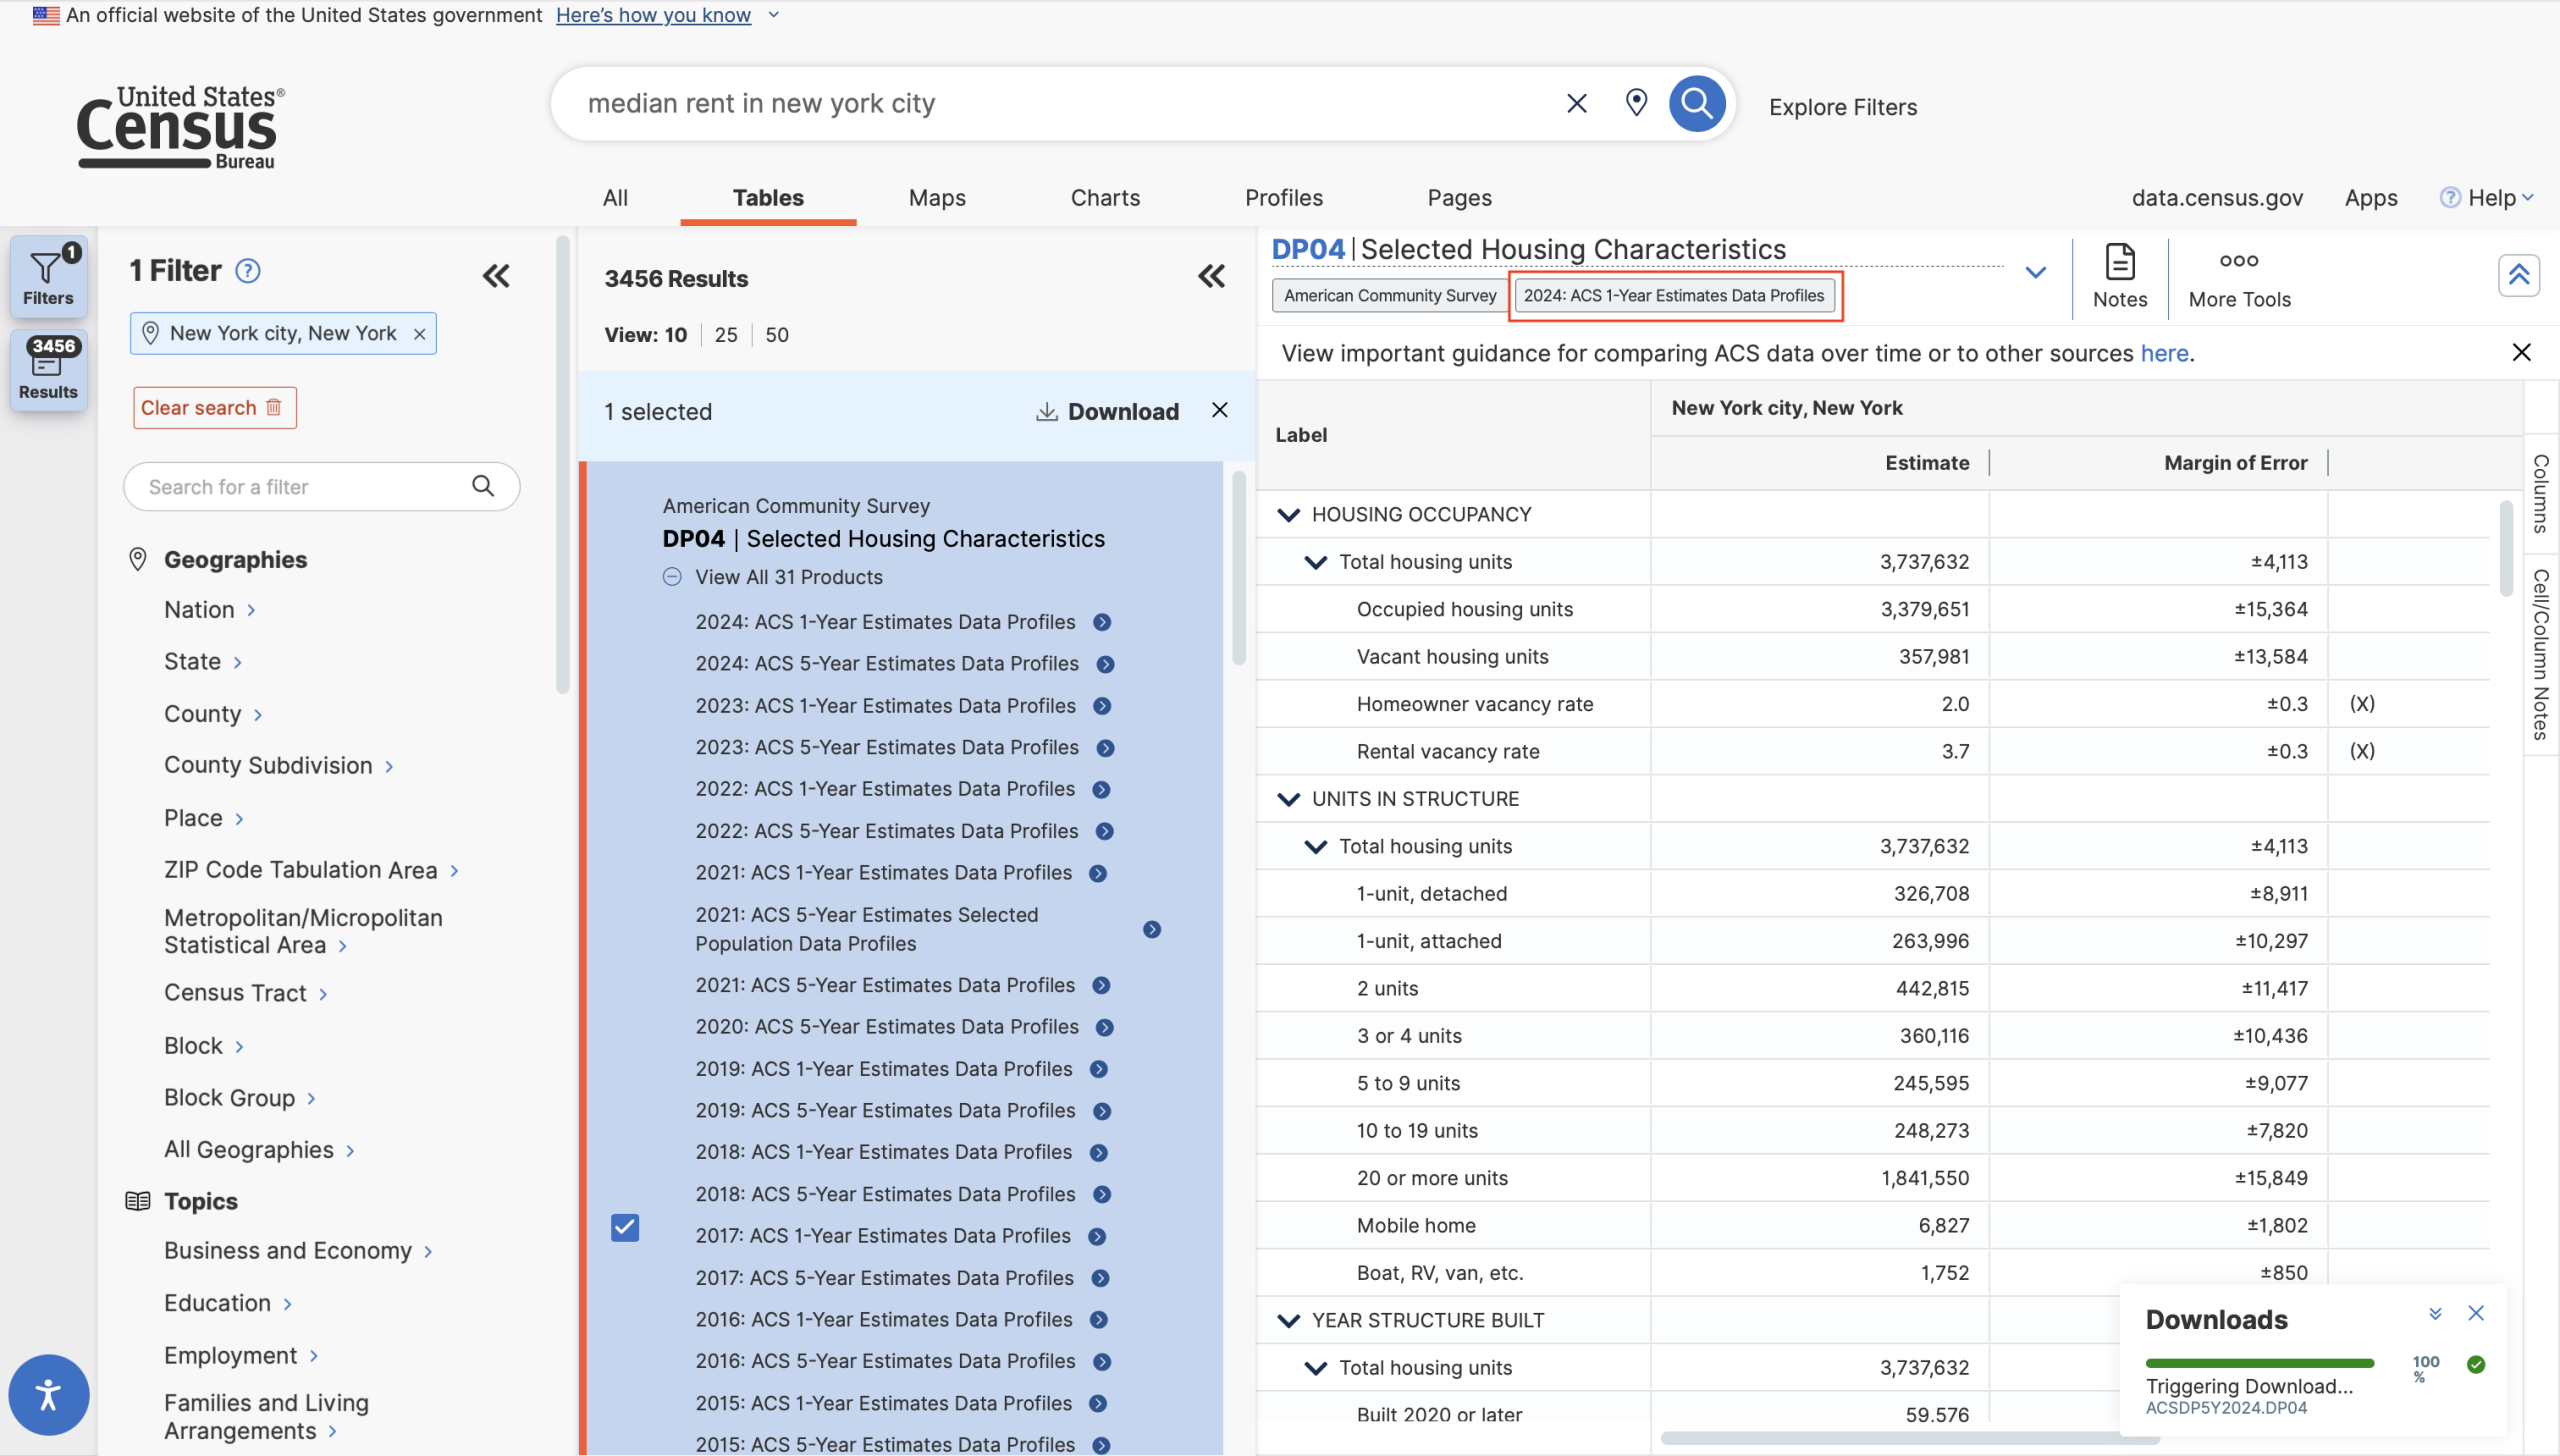
In data science projects that use the Census API, users are normally only looking for a select subset of the variables available in a table. Each column in a table has its own code. You would fetch the leftmost estimate column of table S0001 using the code “S0001_001E” and the margin of error for that estimate using “S0001_001M”. However, viewing these codes requires the user to perform their search, find the table with the variable in question, click the small “Download Table Data” button, select the table(s), select the specific survey they wish to use, and finally disable their pop-up blocker so the file in question can download. Then they can unzip the folder, find the relevant code, and enter it into their program to download.
This could all be avoided by simply presenting the relevant codes at the top of the table view in the browser, making the row optional as they do with the Margin of Error tool.