
Current consumer culture is being inundated with feedback requests in the form of user surveys and questionnaires. This may benefit the businesses requesting, but the technique is far from a user-centered approach. The Finnish company HappyOrNot is succeeding in a new form of customer feedback through the innovative use of emoticons to measure customer satisfaction.
UX is More than Usability
“High usability scores [are] not always correlated with positive emotional ratings.” (Garcia, 2016) Therefore, it is of interest to UX professionals to pursue effective tools for analyzing how users and clients feel when interacting with products and services.
When we consider the challenge of measuring emotions in the field of UX, we often consider biometrics such as skin sensors, eye tracking, facial analysis, and voice analysis. These metrics are often expensive and always time-intensive as the measurements must be gathered case-by-case in formal experiments. How can we collect large scale data in UX that measures emotions across many users?
Self-reporting is one category for gathering this type of data, if you can find a meaningful tool for users to record their emotional state. Many companies have turned to feedback questionnaires as a standard part of the consumer experience.
Survey Fatigue
At a time when it is nearly impossible to avoid the drumbeat of feedback requests from the companies we patronize, there is a logical incentive to investigate the process of systematically requesting customer input.
“How did we do?”
“We want to hear from you!”
“You didn’t forget about us, did you?”
We didn’t forget–how could we when we are bombarded non-stop? Yet the process of giving feedback and ratings for many of the products and services we encounter every day has become an expected part of the consumer experience, whether we like it or not.
A recent analysis of response rates for customer surveys have pegged success at often only a dismal 2%, and rarely over 20%. (Ganeshan, 2016) Some questionnaires are fast, while some are lengthy. Some feedback requests occur at the point-of-experience, and some come weeks later into your inbox. “Surveys have gotten longer and more complicated, not taking into account that today’s generation has a short attention span and is always on the go.” The sheer volume that we receive contributes to “survey fatigue.” (Ganeshan, 2016) Yet in a culture where feedback has become commonplace, users and customers are likely to participate if the means to do so is not onerous. Honest customer feedback can be of great value—but companies need to carefully consider how they procure this intelligence.
Seeking a Client-Centered Approach
Companies who seek accurate and valuable feedback must keep their clients’ perspective front-of-mind. When companies send questionnaires that are long, they are not respecting the respondent’s time. When the feedback is “disembodied” from the experience (by coming days or weeks afterward), the client may not have optimal recall for accurate responses, particularly for emotional measures. (Swinscoe, 2016) “Surveys are running amok and need to be considered as part of the customer experience, not tacked on at the end with no thought to how it will impact customer perception.” (Willott, 2016). The very measurement tool can potentially make the user’s overall experience with a company worse.
Happy or Not?
The next inning of consumer feedback could be at hand as we examine a successful satisfaction measurement tool ITRW (in the real world). HappyOrNot was founded in 2010 in Finland, with a mission to create “happiness in every business, worldwide.” Their point-of-experience terminals provide physical push buttons with a range of 4 emoticons for customers to let a business know how positive or negative their experience was (Figure 1). Because the option to press is anonymous and fast—clients can give feedback “without breaking stride” as they exit from a physical business location (Owen, 2018)—the rates of participation are excellent and this generates significant volumes of direct customer data for the businesses that use these terminals.
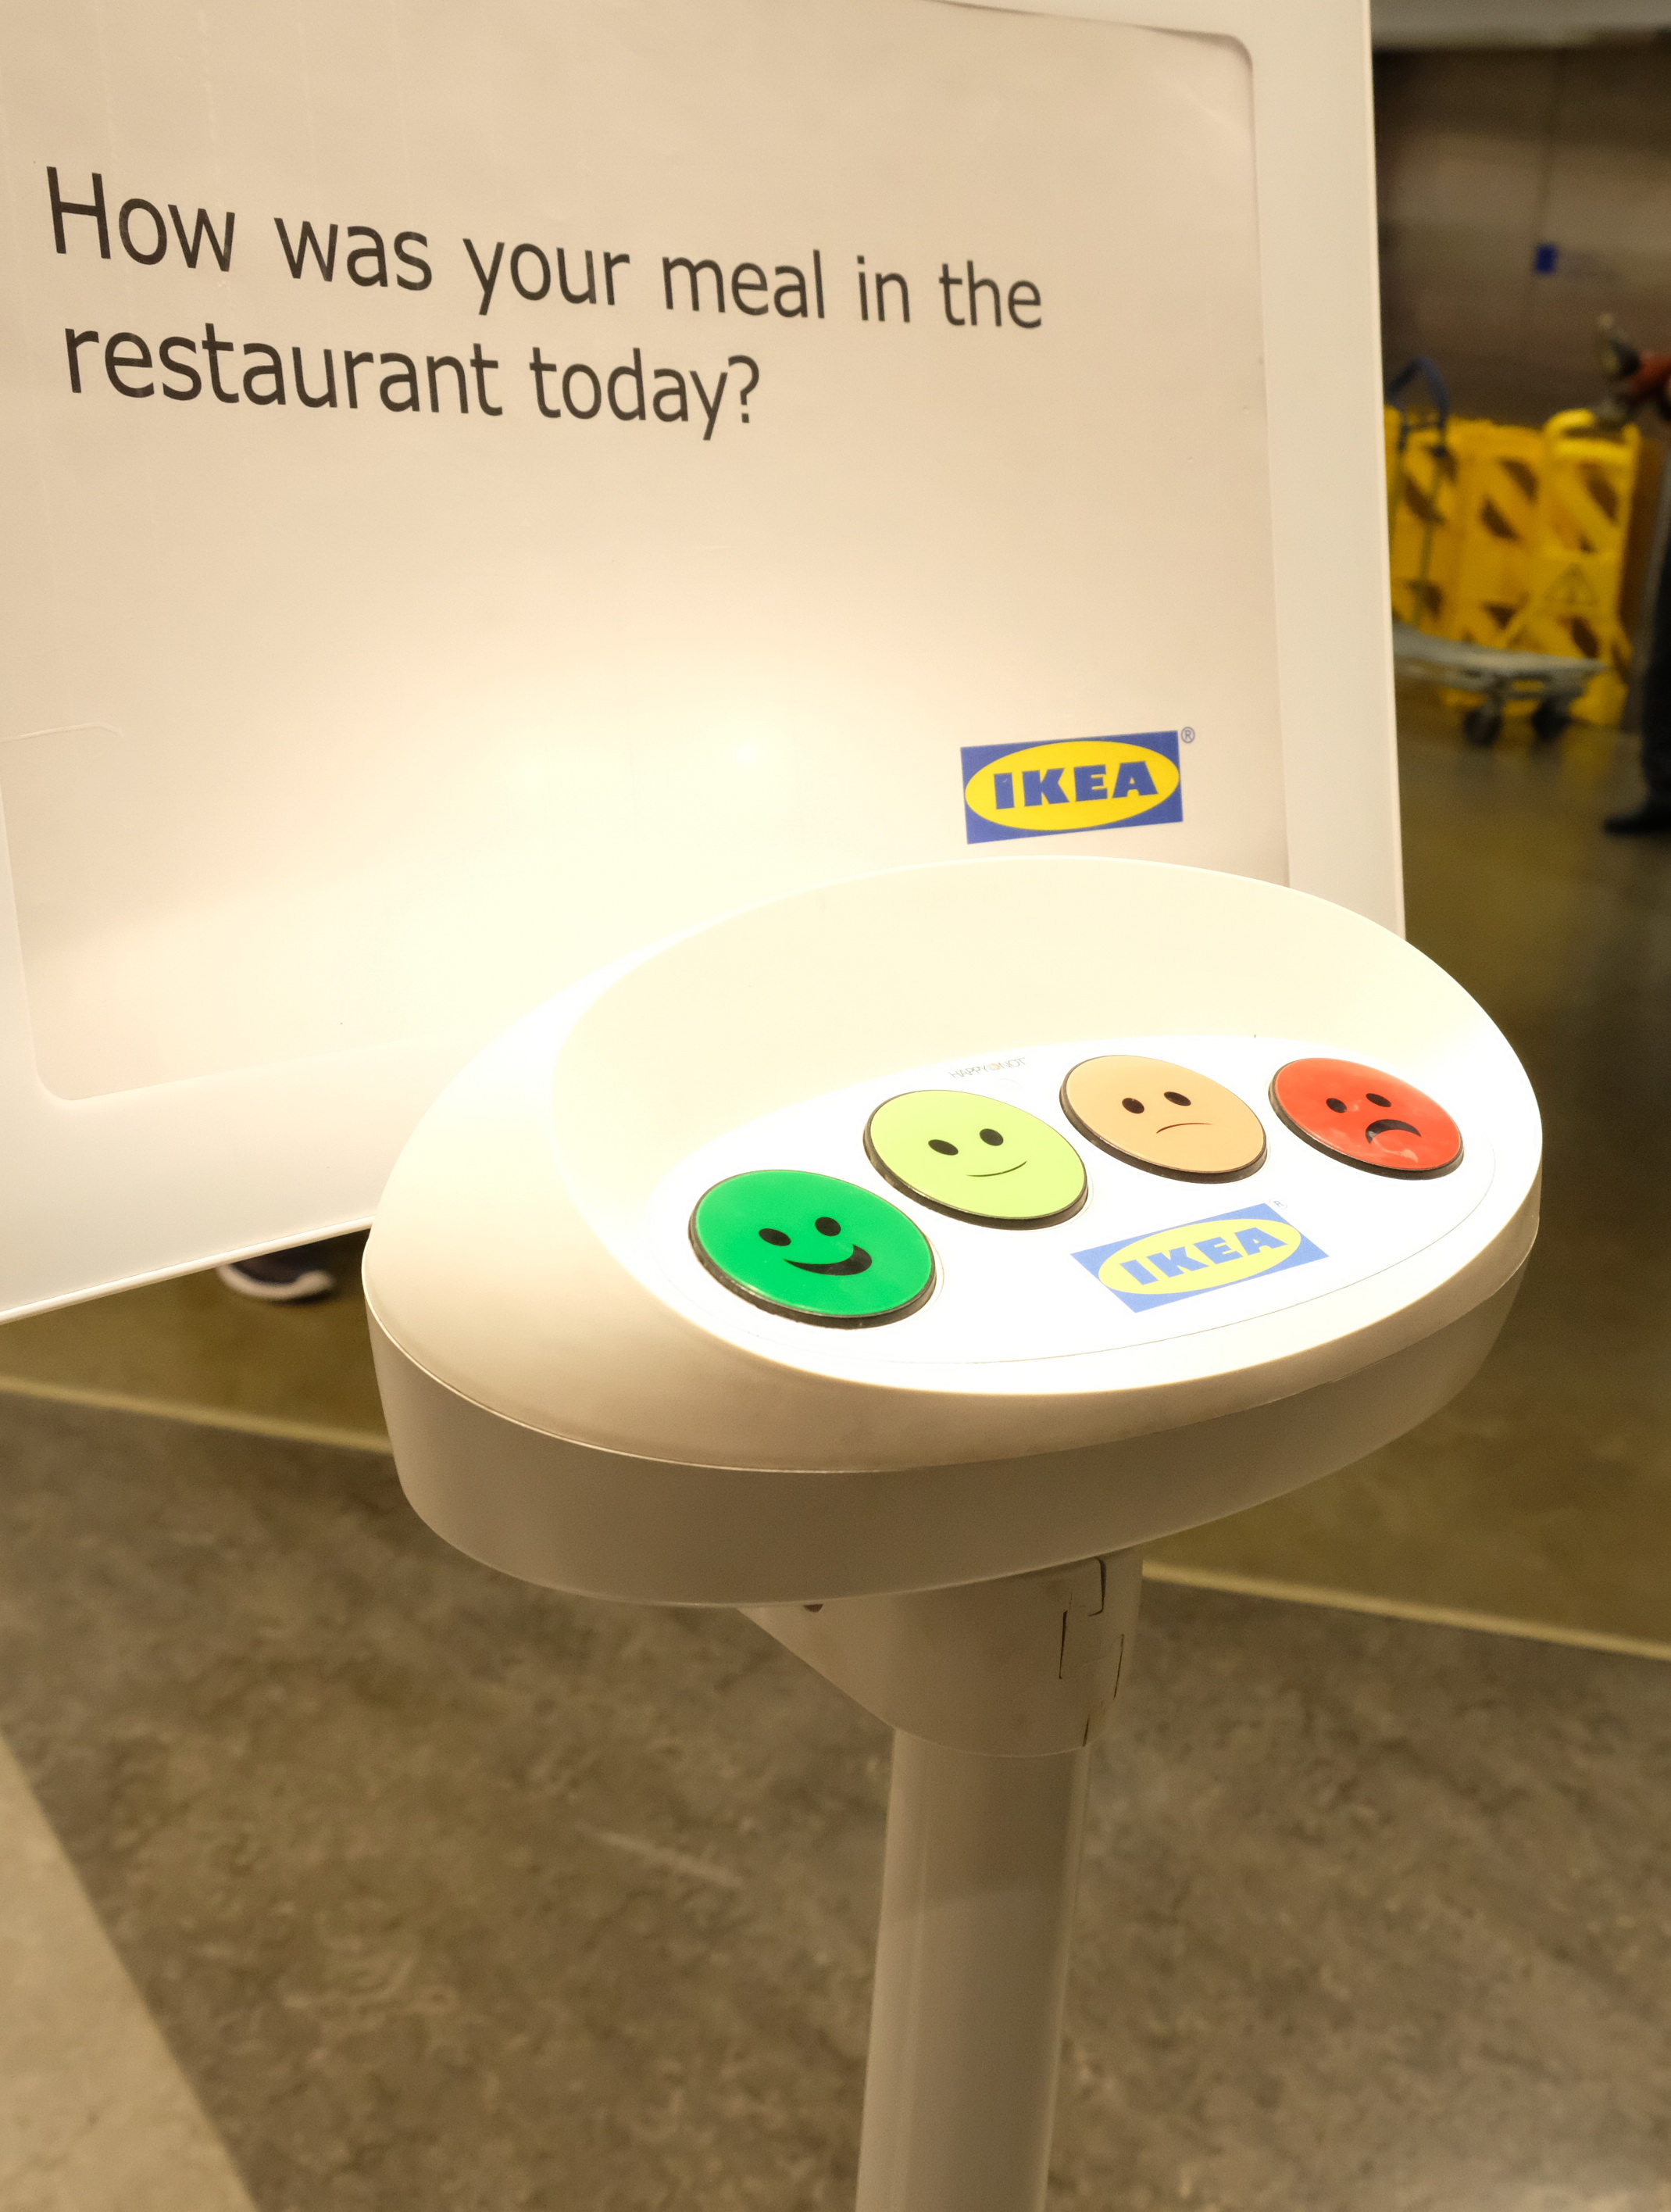
Customer presses are gathered with timestamp and location so that companies may look for patterns in the data to identify where customers are happiest and least happy. The terminals are currently in place at sports stadiums, airports, and retail outlets such as Ikea. If a particular location during a particular timeframe is consistently collecting unhappy presses, more investigation can be done to see whether lines are too long, perhaps more employees are needed, or even if an ineffective manager needs more training.
While this one-press system has limitations to the qualitative data it collects, emoticons provide an interesting case that can be applied online. Specifically, the emoticons provide a way to measure emotions and gather emotional data on a broad scale, from many customers, quickly and unobtrusively.
A History of the Emoticon Language
Using emoticons along with a scale from 0-10 to measure patient pain, became an institutionalized approach for hospitals in the early 2000s. Numbers as a “universal language” became the quantifiable metric for a highly subjective perspective in medicine. “Emoticons were a hit in health care way before you could text them on your phone.” The illustrations of faces in states of happy (0) to agony (10) were far more relatable to patients than simply number scales. (Gordon, 2016) What the “smileys” help to capture, is the emotional levels of the patient or the user. In an online world that is increasingly visuals-based, rather than text-based, emoticons offer a fast and familiar “read.”
Based on a study in the journal Social Neuroscience in 2013, when we look at a smiley emoticon online, “the same very specific parts of the brain are activated as when we look at a real human face” (Owen, 2013 & Seiter, 2016). Humans have a genuine emotional connection to emojis, making them a powerful tool for UX studies.
UX Measurements that Work for Companies and Customers
When companies seek to analyze customer experience online or ITRW, using multiple complementary strategies for data gathering will yield the most valuable insights. Using emoticons at specific points in the online customer experience (i.e., at the end of a chat session, or after completing an online purchase) gathers direct user feedback that is emotionally based, while respecting the visitor’s time and activity flow. This type of feedback can be given in the course of the task, making it accurate for the business and easy for the customer. If it is easy, it will have a higher participation rate, providing the company with a meaningful volume of data across a larger percentage of their users.
Lengthy questionnaires mostly serve the company sending them out. A more empathetic approach to the client will align with companies whose mission is to, in fact, improve their users’ experience. When further user experience data is needed (beyond a simple emoticon click), perhaps traditional evaluations with vetted recruiting methods and appropriate compensation for the participants would be the most principled course.
References:
https://www.happy-or-not.com Retrieved on March 12, 2018.
Churches, Owen (2013). Journal article: “Emoticon in Mind,” Social Neuroscience. https://www.tandfonline.com/doi/abs/10.1080/17470919.2013.873737?journalCode=psns20#.VLadY2TF871 Retrieved on March 31, 2018.
Ganeshan, Susan. (February 26, 2016) Article: “The Deadzone: Why Customer Surveys are Dead,” Mycustomer.com. https://www.mycustomer.com/experience/voice-of-the-customer/the-deadzone-why-customer-surveys-are-dead Retrieved on March 18, 2018.
Garcia, Sarah (2016). Article: “Measuring Emotions: Self Report as an Alternative to Biometrics,” UXPA Magazine. http://uxpamagazine.org/measuring-emotions/ Retrieved on March 31, 2018.
Gordon, Elana. (2016) Article: “Reassessing the assessment of pain: how the numeric scale became so popular in health care,” The Pulse. https://whyy.org/segments/reassessing-the-assessment-of-pain-how-the-numeric-scale-became-so-popular-in-health-care/ Retrieved on March 12, 2018.
Owen, David. (2018) Article: “Customer Satisfaction at the Push of a Button,” The New Yorker. https://www.newyorker.com/magazine/2018/02/05/customer-satisfaction-at-the-push-of-a-button Retrieved on March 12, 2018.
Seiter, Courtney (2016). Article: “7 Reasons to Use Emoticons in Your Writing and Social Media, According to Science,” Bufferapp blog. https://blog.bufferapp.com/7-reasons-use-emoticons-writing-social-media-according-science Retrieved on March 31, 2018.
Swinscoe, Adrian. (March 13, 2016) Article: “Some People Say That Customer Surveys Are Dead, They’re Wrong And Here’s Why,” Forbes. https://www.forbes.com/sites/adrianswinscoe/2016/03/13/some-people-say-that-customer-surveys-are-dead-theyre-wrong-and-heres-why/#6a88e4f430fa Retrieved on March 18, 2018.
Willott, Lindsay. (February 29, 2016) Article: “When Surveys Run Amok,” Customer Thermometer. https://www.customerthermometer.com/customer-surveys/when-surveys-run-amok/ Retrieved on March 18, 2018.