——Yes, They So Much Love To.
Introduction
To be a great designer of user experience, it matters that the design work is brilliant. Nevertheless, to be a opinion leader of great designers, evaluation metrics of designs and effective communication of works are of considerable necessity. In this post , this post and this post, We will discuss about Quantifying User Experience, the relation between designers and Statistics, types of user testing and sub-classification, A|B Testing as a most common technique of comparing designs and how designers tell stories and make use of statistics through data visualization.
Inspiration
When I first looked for related information on internet, I cannot find a systematic way of discussing the topic “Quantitative Usability”. I then turn to Library for help, luckily I found several related physical books such as “Quantifying the User Experience”, “Eyetracking the User Experience”, Thanks to Librarian Nicholas Dease from Pratt Library who provide instruction about partial keywords search, such as inputing “Quan*”,you will get all related resources of keywords: quantitative\quantify\quantity. In the following paragraphs, several questions are provided to guide the thinking process in detail.
What UE Disigners Think of Statistics?
Initially, “The last thing many designers and researchers in this field of user experience think of is Statistics.” quoted from “Quantifying the User Experience”,Jeff Sauro / James R.lewis, 2012 P1. In this phase, Statistics are similar to giant strong devil to designers. Designers try not to work with numbers and they fear and are not confident to think about Statistics, not to mention make good value of it.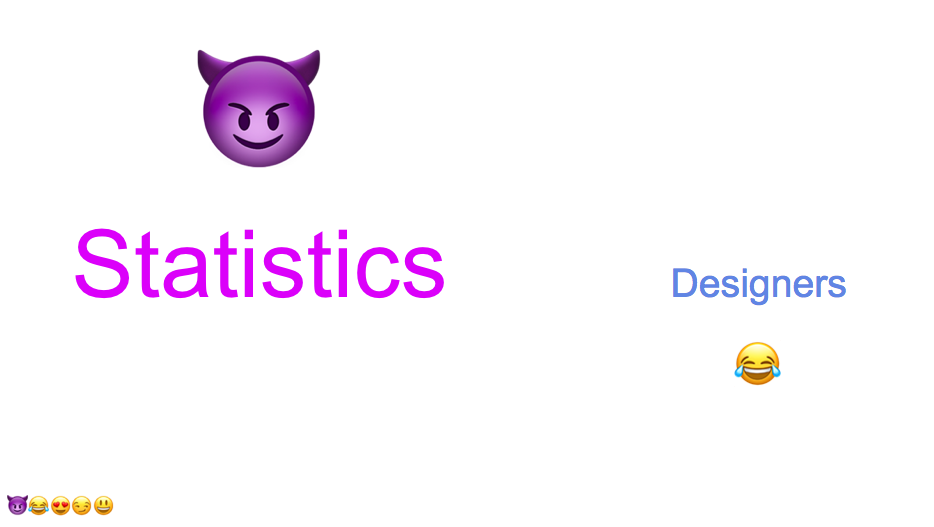
“Increasingly, usability practitioners and user researchers are expected to quantify the benefits of their efforts. If they don’t, someone else will- unfortunately that someone else might not use the right metrics of methods.” quoted from “Quantifying the User Experience,Jeff Sauro / James R.lewis, 2012 P1. After seeing the good application of statistics and also the persuasion through data, designers are more likely to cope with quantitative methods, especially proving in numbers why their designs worth favoring.

How Useful is Quantitative UE Research?
In the next phase, designers are confident, they not only can see Statistics as a tool, but also, they are trained with more mastery. Designers are smiling, with a smirk face (smirk means to smile in a way that expresses satisfaction with yourself or pleasure about having done something or knowing something that is not known by someone else.) “The user of statistics method does not guarantee 100% correct decisions, but it doesn’t have to be perfect to be effective.” (Quantifying the User Experience,Jeff Sauro / James R.lewis, 2012, P272 ) Statistics provides “the world’s most specific way of saying maybe” (Searles, 1978, P110)

Concepts
While making statistics useful, there are a few steps to take. Let’s start with some concepts.There are two types of user testing: Formative and Summative
Similar as tests of student learning, these terms come from education(Scriven, 1967)
Formative: providing immediate feedback to improve learning.
Summative: evaluating what was learnt.
When we try to Quantify User Experience, we see more specific definitions.
Formative: finding and fixing usability problems
- A small-sample qualitative activity
- Data form-problem descriptions and design recommendations.
- Quantify the problems in terms of frequency and severity
- Track which users encountered which problems
- Measure how long it took them to complete tasks
- Determine whether they completed the tasks successfully.
Summative: describing the usability of an application using metrics
- Two types of Summative tests: Benchmark and comparative.
Benchmark tests are similar to comparative tests, when one of the comparative object is set as a fixed requirements/standards. We will talk about comparative tests more this time.
What if we want to know
if there is a Statistical Difference between Designs?
“Many researchers first realize the need for statistics when they have to compare two designs or products in an A|B Test or competitive analysis.” (Quantifying the User Experience,Jeff Sauro / James R.lewis, 2012,P272 )
Comparative: (A|B testing)It can be a comparison of a current with a prior version of a product or comparison of competing products. Please refer to The Post about A|BTesting, you will find details about this widely useful technique. Moreover, after mastering skills, designs find that they not only mastered statistics, but also make it fun while creating data visualizations. Thus, designers can play with statistics when that happens.

Category