
The basic traffic metrics like seven-day active users, page views etc. are not good to evaluate the impact of User experience changes as firstly, they are generic and do not directly relate to the quality of the user experience, and secondly, it is difficult to make them actionable. This calls for a strong need for a user-centered metric.
Heart Framework
Heart Framework was designed by Kerry Rodden, Hilary Hutchinson and Xin Fu from Google’s research team, looking to improve on the general metrics. The name of the framework is an acronym where the five letters represents the following metrics: Happiness, Engagement, Adoption, Retention, Task success.
This framework can be used to test any single feature or a product helping to focus on the aspect of the user-experience and decide whether to include or exclude a category.
Happiness helps to measure the attitude of the user and tracks the subjective aspect of user experience like perceived ease of use, visual appeal, likelihood of the user to recommend it to people. This metric is primarily gathered from surveys and feedbacks which may be built in the product. You should focus on this metric if your users are dissatisfied with the product.
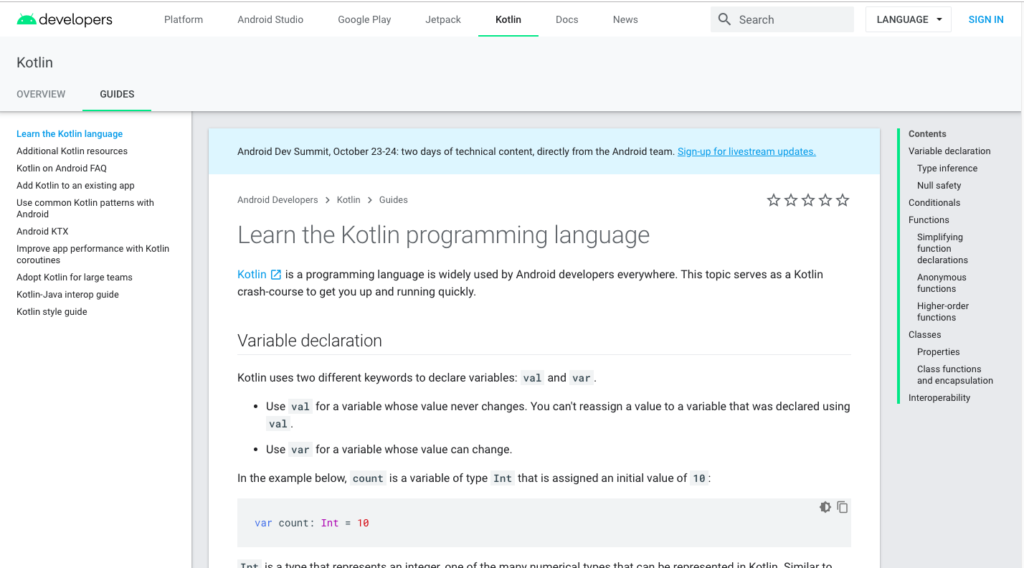
For example, Google’s developer site which provides resources and tutorials to build apps captures any early negative sentiment by its on-page star rating (see fig. 1) which is embedded in their documentation. This real time feedback helps to improve the experience by quantifying the signal which can be used for comparison.
Engagement is a metric to see the level of user involvement and depth of interaction over a time period. This is mainly determined from bounce rate (the percentage of visitors to a particular website who navigate away from the site after viewing only one page), number of visits per user per week, photos uploaded per user per day, number of shares, time-spent in app, number of sessions. You should focus on this metric if users are not interacting enough with the product.
For example, in order to understand the level of engagement the Gmail team chose to see the percent of active users (how many users visit or interact with the product or service) instead of measuring the count. The percentage helped to measure the usage more accurately compared to the count which may be due to more users.
Adoption measures how well the product or any feature of the product is spreading to new users. For example, to measure this we can see how many accounts were created in the last seven days, how many people upgraded to the latest version. You should focus on this metric if you want to acquire new users.
Retention on the other hand helps to see if the existing users are returning to use the product or a particular feature of the product. For example, to see the percent of active users in a given week, who are also active three months later. You should focus on retention if you want your users to come back and use the product or any particular feature.
Both adoption and retention are important metrics to consider when a new feature is added to the product or when the product undergoes redesign.
The final metric of the heart framework is Task Success which sees how well the task are performed associated with a particular feature i.e. to measure the efficiency (time taken to complete a task), effectiveness (percent of task completed) and error rate. This can be done using remote usability or a/b testing. You should focus on this metric if you want to know how often the key tasks are associated with any specific feature or product are being performed well.
For example, google maps used to have dual box one for entering “what” and other for “where” (e.g. (pizza)(NYC)). During the A/B testing both versions were tried one with the dual box and other with the single box. Finally, after comparing the error rates in the two versions it was found that users adapted well with the single box search. This led to the removal of the dual box for all the users.
Advantages
The acronym for the framework makes it easy to remember and use during discussions.
Though it is designed for large projects, it can also be implemented on small projects therefore making it easily scalable.
This framework facilitates marketing to gather requirements from the point of view of user as marketing is becoming more and more user-centric.
Disadvantages
This framework is naturally geared for User Experience (UX) projects. Though it can be used for non-UX or non-design projects but does not feel like a natural fit.
More research is needed to put a particular metric in each category which will accurately reflect that particular category.
This framework is used best with the goal-signal metrics as it helps to decide which category to choose in a better manner.
Conclusion
This framework is comprehensive enough that it can be adapted successfully within an organization. Also, this framework can be used as a base to choose the category and more metrics can be added to each category depending on the goals of the organizations. Long-term observations will provide better data and help decision-making when measuring the user experience using this framework.
References
Rodden, K., Hutchinson, H., & Fu, X. (2010, April). Measuring the user experience on a large scale: user-centered metrics for web applications. In Proceedings of the SIGCHI Conference on Human Factors in Computing Systems (pp. 2395-2398). ACM.
Balboni, K. (n.d.). How Google measures and improves UX with the HEART framework. Retrieved from https://www.appcues.com/blog/google-improves-user-experience-with-heart-framework
Google’s HEART Framework for Measuring UX. (2016). Retrieved from https://www.interaction-design.org/literature/article/google-s-heart-framework-for-measuring-ux