
A team of four researchers completed an analysis of Monterey Bay Aquarium’s website in order to provide the Aquarium’s digital team with recommendations on how to increase email subscriptions from its live-cam viewing audience. This research was completed for the Digital Analytics class at Pratt Institute taught by Prof. Elena Villaespesa.
Project Overview
client meeting
On October 28th, the research team met with Liz MacDonald and other members of the digital team at Monterey Bay Aquarium, in order to clarify the scope of the project. The original project brief detailed the Aquarium’s primary goal: to improve its email subscription conversions, primarily among its website users who watch its live-streamed videos of various ocean life.
During the meeting, our teams decided to focus on live-cam viewers who watched from its website, rather than from videos hosted on the Aquarium’s various social media accounts. For that purpose, the Aquarium team granted us read access to their Google Analytics and Siteimprove accounts, which included data from the website’s relaunch in March 2020.
research team

This analysis was undertaken by a team of four students: Hannah Bauer, Clarissa Liu, Mingqi Rui, and myself. Our team split the workload fairly evenly, and met virtually several times over the course of the project to discuss our progress. I held a leadership position on the team, communicating with the clients as well as our team members to ensure everyone had a clear idea of the work to be done. I created most of the data dashboard, with the team’s input, and wrote the Introduction section of the report as well as one Finding & Recommendation. In addition, I took the lead in providing a final content edit & stylization of the report, and the style & color coordination of the dashboard. I was also one of our team’s two speakers during our final presentation to the client.
The Analysis
initial analysis
Google Analytics and SiteImprove were the tools made available to the research team; I primarily worked on the data within Google Analytics. I also exported some Google Analytics data into a spreadsheet in order to perform a more in-depth analysis. Because of the website relaunch in March 2020, the team collectively decided to work with data from April 1st, 2020 to October 31st, 2020, to keep our numbers consistent.
DATA DASHBOARD
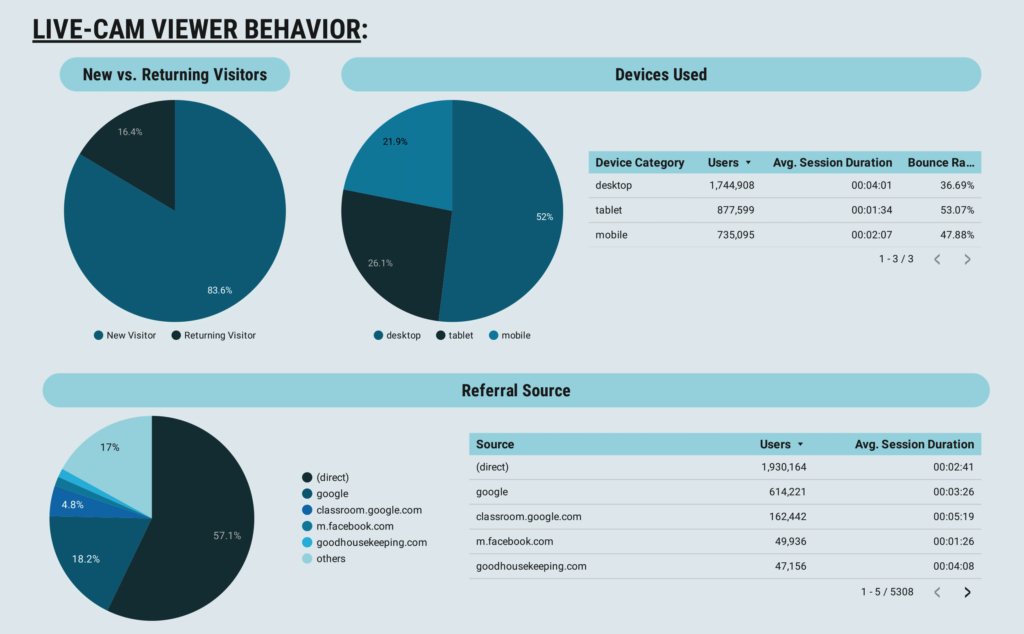
After the initial analysis was completed, the most relevant pieces of data were compiled into a dashboard using Google Data Studio. The key metrics on this dashboard reflect the project’s goals; they primarily monitor the behavior of live-cam viewers, as well as those who successfully convert to email subscribers.
Among the metrics included on the dashboard are:
- Number of pageviews for the entire site
- Number of pageviews for live-cam pages
- Average time spent on live-cam pages
- Total number of email conversions
- Email conversion rate
- Most popular entry pages for email subscribers
- Email subscriptions from live-cam pages
The full dashboard is available to view here.
Major Findings
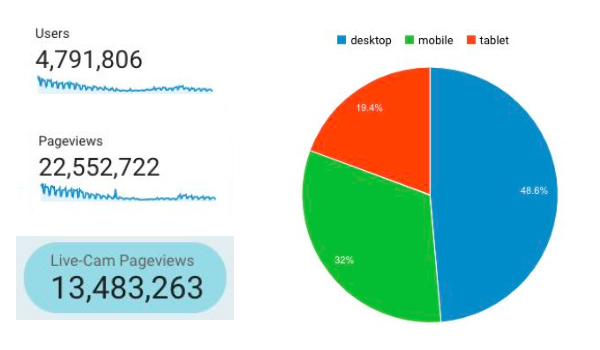
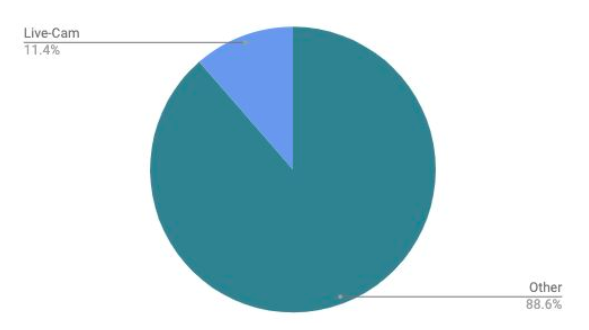
In terms of overall user behavior, the Monterey Bay Aquarium website received 22.5 million pageviews from 4.8 million users during the six-month period analyzed. About 48% of website traffic came from users using desktop devices, compared to 32% from tablets and 20% from mobile devices. Out of the total pageviews, 13.5 million came from live-cam pages, making up about 60% of the total site traffic.
After conducting a full analysis, the research team selected four main areas of focus:
- Current email conversions
- Live-cam viewers’ behaviors
- Mobile live-cam viewers’ behaviors
- Aquarium live-cams on YouTube
The full findings and recommendations are outlined in a detailed analytical report; below are the two most important recommendations we made.
Recommendation 1: tailor email content and sign-ups to live-cam viewers
In the timeframe analyzed, there were a total of 13,133 email conversions, representing an overall conversion rate of 0.19%. 1,495 of those conversions, or about 11%, were made by users who visited live-cam pages within the last three clicks before subscribing.
In order to improve the number of conversions coming from live-cam pages, we recommend including information in email newsletters that is relevant to the live-cams, such as feeding times or the times of other notable events for which viewers might want to tune in. Following that, email sign-up options on the live-cam pages should advertise the presence of relevant information in the newsletters. We expect more live-cam users to subscribe to email updates when they know the emails will be relevant to their interests.
Recommendation 2: prompt live-cam viewers to subscribe to email updates
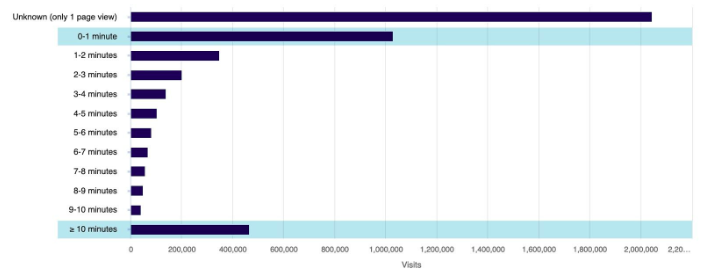
In terms of the average time spent on live-cam pages, Siteimprove was able to record that data for 44% of visits. Out of those visits, while 39% of people spent less than one minute on the page, the second-largest category was people spending more than 10 minutes on the page: 18% of visits, or almost half of the proportion that spent under a minute.
In order to specifically target users who are most invested in watching live-cams — i.e., users spending the longest time on live-cam pages — we recommend issuing prompts for email subscription specifically among that audience. These prompts could take the form of a pop-up notification, or a brief interruption to the live video feed; the exact timings of these notifications should be decided upon following further research into the user experience of such a mechanism.
Project Conclusion
This project culminated in the delivery of a presentation to the Monterey Bay Aquarium digital team; following the presentation, we met with the clients to go over our report and dashboard in greater detail.
The clients seemed to be satisfied with the results of our analysis; in particular, they were grateful to have concrete recommendations that they could implement in order to take advantage of their large live-cam viewing audience.
Future analyses might take into account the user experience impacts that our recommendations might have on the Monterey Bay Aquarium website. In addition, we hope that the data dashboard will continue to be used by the Aquarium to monitor the effects of any actions they take towards improving their conversion goals.
Despite our project’s limited scope, I believe we aided our clients in discovering real, actionable roads forward in furthering their conversion goal. I look forward to seeing how these recommendations are implemented on the Monterey Bay Aquarium website.