Website Analytics
The research aims to collaborate with the redesign of the museum's website. With the data analysis, we wanted to understand the behavior of the user of the Chicago area and outside Chicago within the current web to improve and generate engagement with the content online and show what the museum offers.
Goal 1: Connect more with Chicago Community
Goal 2: To understand how the user journey might affect museum attendance.
My role on the project was to create the mockups of the different documents: the report, the presentations, and the dashboard. We divided the report into two sections. I was in charge of developing goal #1. Also, I organized various meetings with the group.
The team Beatrix Walter | Jessica Chalmers | Alissa Fioretto
THE PROCESS
Data analysis
First, we interviewed Marty Spellerberg, Digital Strategist Specializing in Arts and Culture, and discussed their website’s redesign goals. After the meeting, we discussed the goals and what metrics to use to achieve them. Based on the interview, one Challenge was leaving aside some website sections, such as the online store and the design focused on tablet or mobile. These had not been thought of in the redesign project. Something curious here was that browsing the website from mobile was more user-friendly than from the web.
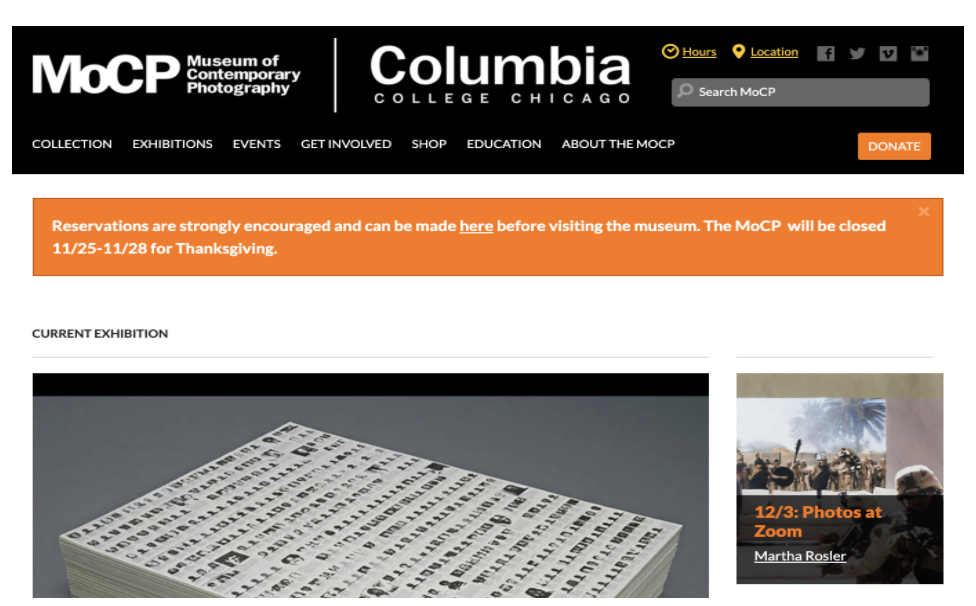
Platforms analyzed: Museum website.
The period analyzed: September 1, 2020, to August 31, 2021
Tools: Google Analytics
Data transformation: Data Studio, Spreadsheets
Key Metrics:
- New Users
- Returning Users
- Bounce Rate
- Referrals
- Site Behavior
- Pageviews
When analyzing the museum website google analytics, we found some missing data, making it challenging to find potentials and problems to conclude with some findings. The Challenge we had was finding out what people were searching for when they landed on the website. The internal search tracking is not active. This led us to focus on other metrics. Having this clear, we created the dashboard on Data Studio. We started with three goals. However, while creating the dashboards, we realized that two had repetitive information. This led us to better define the goals by making them more concise and focusing on two types of audiences and their behaviors.
- Overall Chicago Users vs Outside Chicago behaviour
- Visitor Experience
WEBSITE FINDINGS
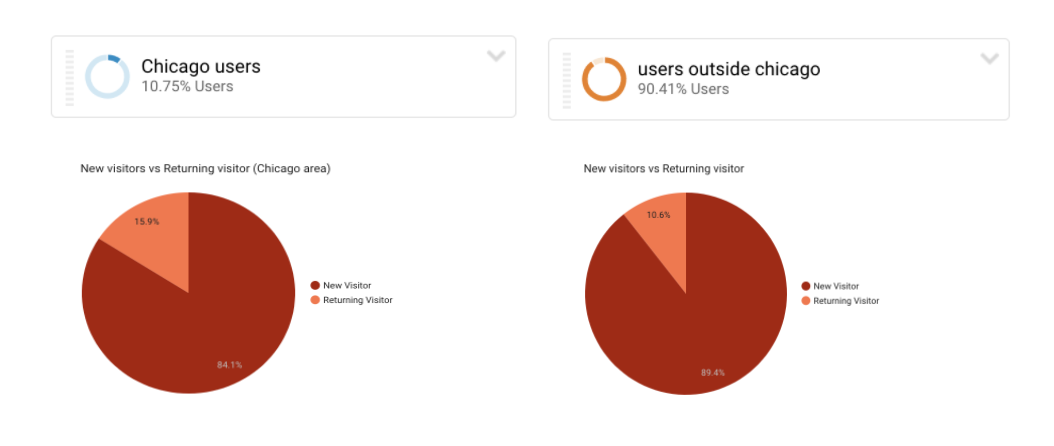
Chicago users vs. Outside Chicago users
- Chicago users are more engaged with the website, regarding the low numbers of sessions and pageviews
2. Different behavior in the user journey through the website between Chicago users and Outside Chicago users
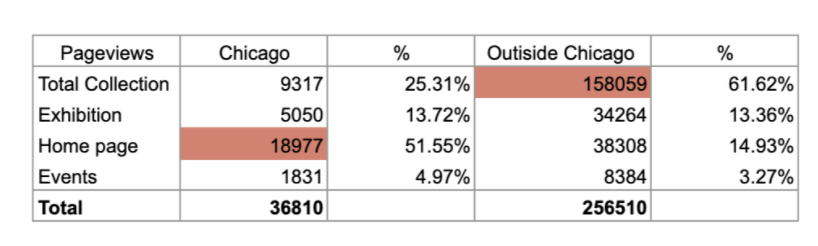
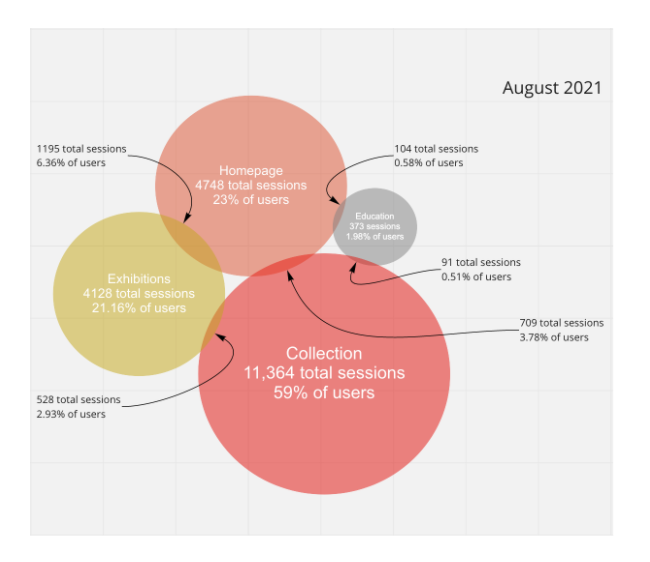
We can see that the home page is the most viewed page for both users. But the most viewed page after that is the online collection, with a high bounce rate. To conclude, users only navigate through one object of interest and leave the website.
Recommendations
- Focus on customizing the website to attract diverse users
- Personalize the website: it is important to show the collections or exhibitions representing the Chicago Area, highlighting Chicago-based photographers or photography.
User journey
- Low engagement in Education, High engagement in Collections
2. New users are greater than returning users
- Over 238K new users
- Over 54K returning users
Recommendation
- Focus on customizing the website to direct user journeys
Overall recommendations
The design of the main page and has to reflect what the museum offers.
The design of the collection pages can direct user interaction to additional pages that lead to more engagement.
CONCLUSION
Client feedback
We present the information to the client and send the report with the dashboard. The client told us that the information obtained after the research would be beneficial, especially the comparison between Chicago users Chicago and outside Chicago users. He told us that the team did not have that information about the audience separately. He also mentioned that after this report the design team will give importance to the issue of recognizing the user and showing diverse content.
Key takeaways
When managing a web page, something essential to keep in mind is to have active google analytics and internal search tracking. Another critical takeaway of this research was to think about the website’s design for both desktop and mobile.