
The Montana Historical Society is the State of Montana’s primary cultural heritage resource for historical archives and permanent state agency records. As MHS continues their efforts to bring more attention toward its many historical resources, our research group conducted an analysis of their website’s performance metrics, as well as an audit of its SEO performance.
The Challenge
Help the Montana Historical Society examine their website data through a variety of exploratory methods in Google Analytics and Looker Studio, and conduct a thorough audit of SEO best practices to help extend the organization’s online reach.
My Role
I largely handled the exploratory data analysis and visualization portion of this project. My background in data analysis was important when making sense of raw metrics and translating insights to use in an easy-to-use dashboard solution.
Process and Methodology
As the Montana Historical society continues to make improvements to its museum and archives, our group sought to answer the following research questions:
What types of content are appealing to audiences?
How is the current SEO performing?
How does the behavior of local vs. non-local audiences compare?
What issues hindered user engagement?
Timeline
October – December
2023
The Team
Kiyo Yang
Angela Li
Kailen Santos
Priscilla Ignacio
Research Disciplines
Web Analytics
Search Engine Optimization
Tools Used
Google Analytics 4
Looker Studio
Woorank
Screamingfrog
Moz
Wordtracker
Metrics Measured
- User engagement rate
- User bounce rate
- Avg. session duration
- Pages/Session
- # of Sessions

Research Plan
In order to translate our goals into actionable items, we first had to consider the steps to discover insights from users.
- Discover how users are accessing the website
- Find out where the largest sources of traffic are located
- Identify popular content and improve retention strategy
- Segment users by device type and default channel group
- Create a separate segment to highlight local vs. non-local sessions
- Create path explorations based on segments to highlight content
Google Analytics Explorations
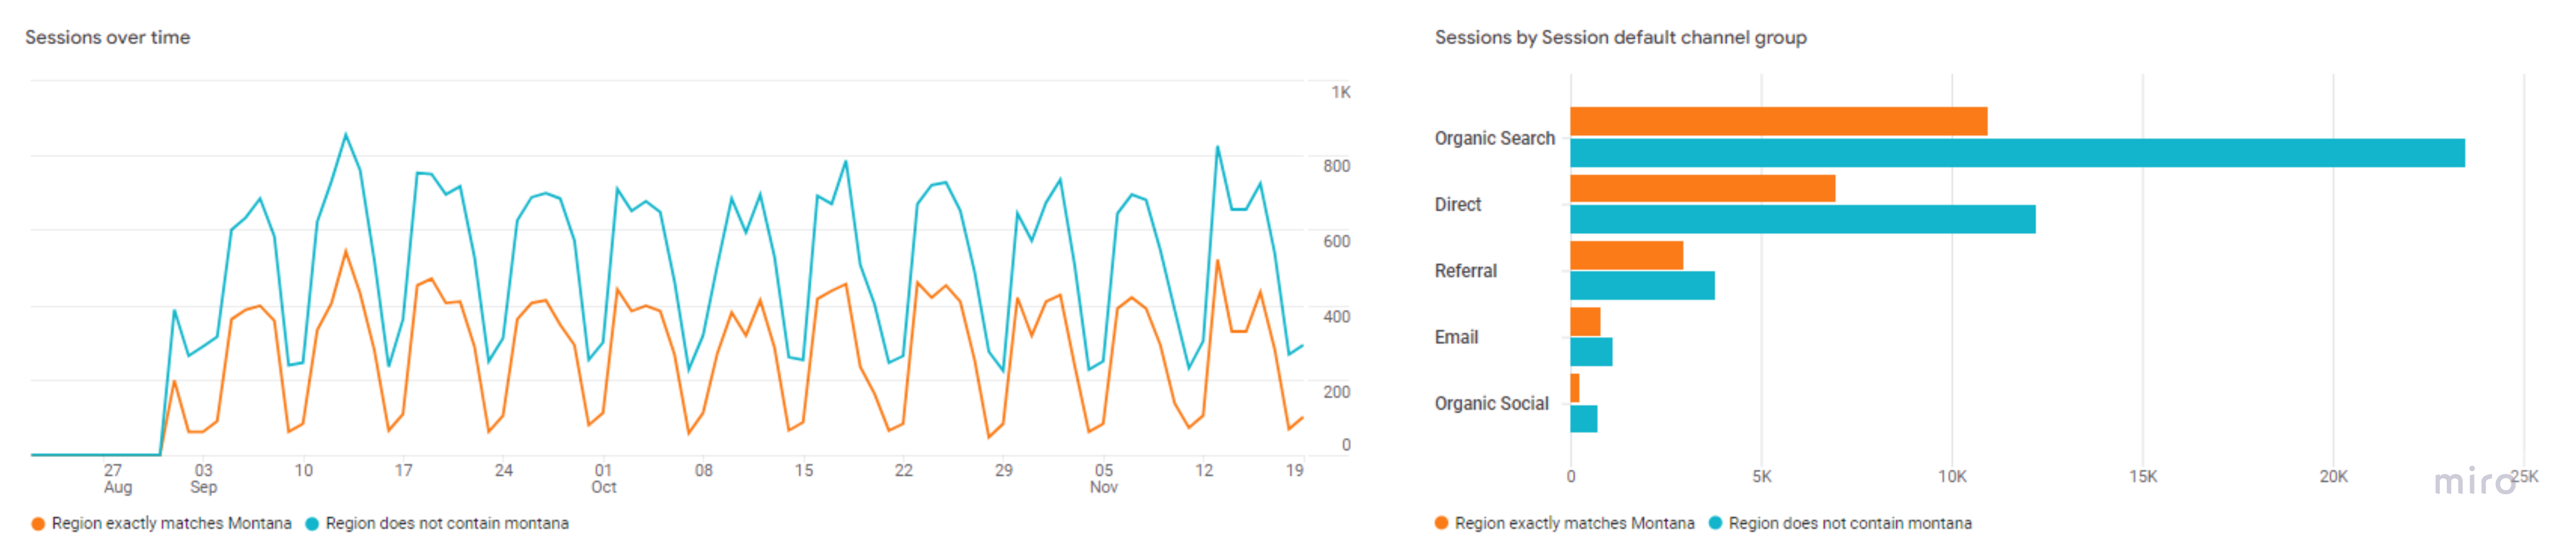
Through our initial explorations in Google Analytics, we discovered some key metrics when observing user behaviors. The first discovery we made is in regard to traffic acquisition. For non-local users specifically, an overwhelming majority accessed the MHS website via organic search
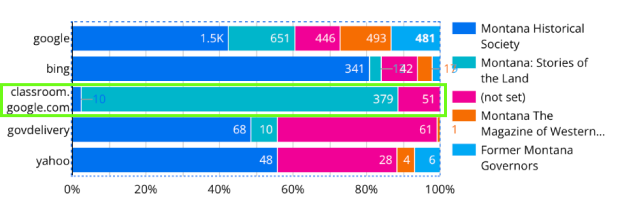
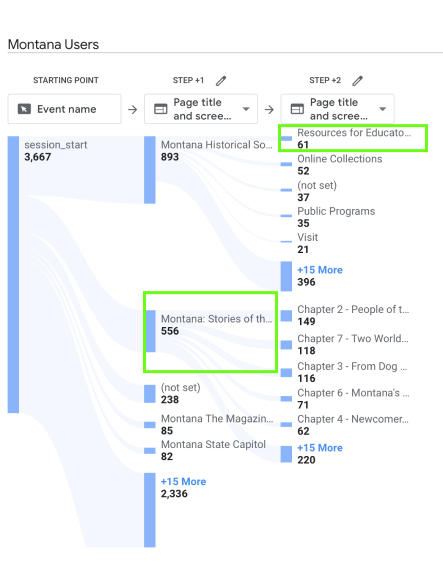
Upon further inspection, local users also tended to access the MHS website for educational purposes. Looking at the path exploration of local users, we can see that a large share of users bypass the homepage completely, instead starting their sessions on the “Montana: Stories of the Land” page. This could mean that many users aren’t actually browsing the website, but finding the exact webpage they need — in this case, the Stories of the Land page. Furthermore, referrals to the Stories of the Land page came largely from classroom.google.com.
Lastly, when exploring different device categories users were using, we found that a larger share of non-local users were accessing the mobile version of the website. What was more telling was that mobile users also had a significantly higher bounce rate on average.

Big Picture Findings
After conducting our initial analysis, we identified 4 key findings that would help the Montana Historical Society achieve the goals set by this research:
Non-local users prefer mobile browsing on the MHS website
Local users tend to prioritize education resources
Lack of meta description in critical pages resulted in low traffic
Accessibility failed in image URLs
Putting it All Together
Given our big picture findings, we then asked ourselves how can the Montana Historical society take action on our insights and work to improve the performance of its website and SEO. Through our research, we came up with some suggestions that could get our client on the path to success.
Improving Mobile Responsiveness to reduce Bounce Rates
Because we discovered that the bounce rates on mobile devices for some pages was higher on average, we looked into the functionality of the website’s mobile platform Upon browsing, we highlighted some shortcomings that, when addressed, can help to lower bounce rates and create a more seamless user experience.
One example of this is to restructure the homepage to ensure ease of navigation. In the example here, we suggest moving the navigation bar to the top of the page, as opposed to the bottom, to increase its discoverability and aesthetic value.

Improving sitemap and increasing presence in education sector
Based on our research findings, users who are looking for education resources aren’t typically searching for them. However, sitemap issues, such as untitled slugs and missing meta descriptions can still make navigating the website a difficult task. We suggest looking into each page, especially popular ones such as the Stories of the Land page, and making sure meta descriptions are properly assigned, and that they exist in an intuitive location in the sitemap.


Conclusion and Future Work
By conducting a deep-dive on the Montana Historical Society’s website metrics, we were able to create an action plan for the organization to follow in order to make future improvements to its website and content strategy. To continually monitor key performance indicators, we provided MHS with an interactive dashboard created with Looker Studio. The dashboard will be an essential part of tracking any improvements implemented after our suggestions were delivered, noting any changes based on the date range selected.

In the future, we also recommended that the Montana Historical Society looks into using Supermetrics to extend the scope of their user research by referencing social media analytics as well. The organization typically uses Facebook for their social media posting, so increasing presence on platforms such as Instagram and Youtube could help to further grow their online presence. Lastly, one research question we weren’t able to answer was how different age groups behave when accessing the website. Though age demographics were not available to us at the time that this research was conducted, we recommended setting up Google Analytics to track these dimensions for future analysis.