Summary
This article briefly described the differences between qualitative and quantitative usability study methods, indicated that high cost is one of the disadvantages of quantitative methodologies, and introduced the System Usability Scale (SUS), which is a quick, efficient and reliable usability study method, and explained SUS’s working process.
Quantitative Usability vs. Qualitative Usability
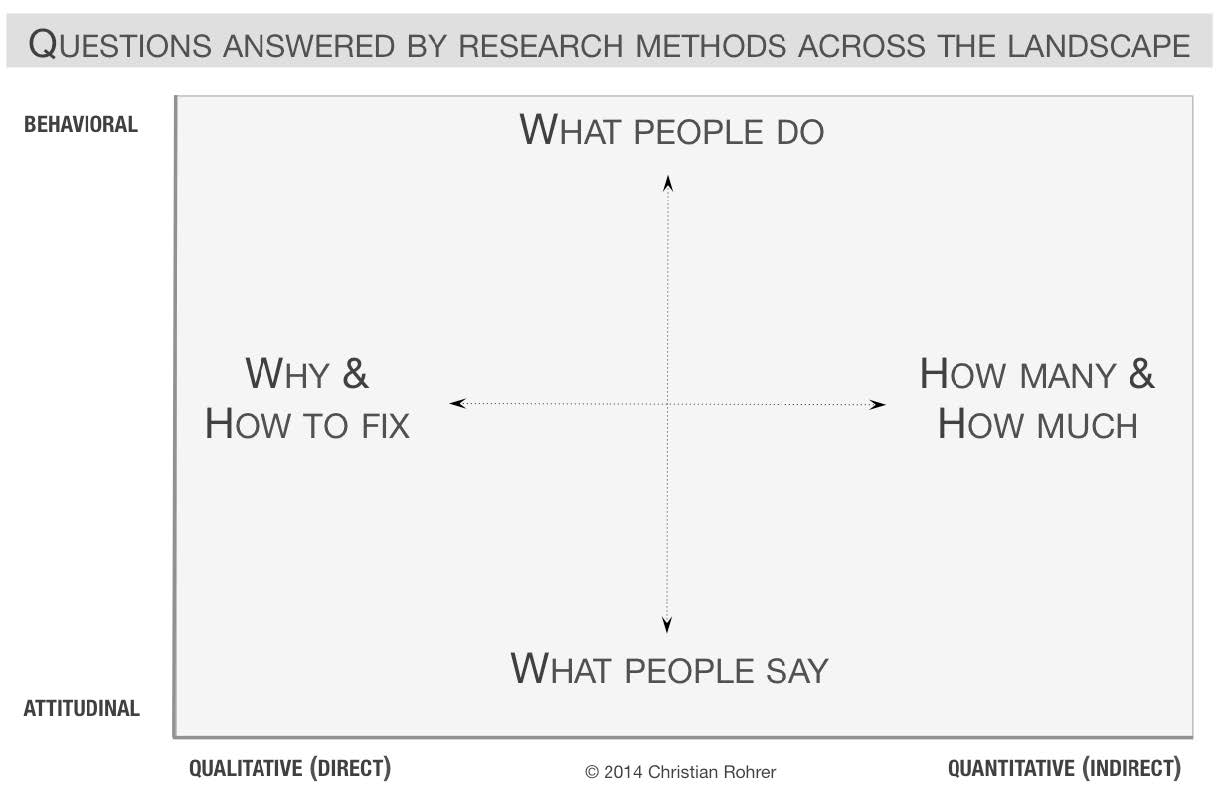
The quantitative usability study is usually been considered as an expensive method that can cost “four times as much as” qualitative studies, and qualitative studies “often generate better insight” (Neilson, 2001). However, quantitative studies is still a good supplement to the qualitative usability study methodology (NNGroup) and can offer an assessment of tasks’ difficulty (Budiu). As Jenna Erickson has stated, both qualitative and quantitative data are both necessary if you want to fully understand an average user’s potential behavior (Erickson). Qualitative research might help researchers understand the specific flaws of a product (Budiu), and can tell you why and how your test participants conduct a certain task intuitively, it also can be biased. While qualitative testing determines “users’ experiences, perceptions, opinions, and feelings” (Usability Testing) and answers questions such as why and how to fix a problem, quantitative methods answers questions such as how many and how much (see fig.2), in order to obtain specific numbers such as “success or time on task”, with with “rigorous well-controlled conditions” (Meyer). In other words, while qualitative studies usually “tell stories”, quantitative “gives contexts” that its feedback “allows you to understand your site’s usability in the context of a much bigger picture” (Trymyui).
Qualitative and quantitative studies are supplements to each other. When quantitative studies have a great strength of providing descriptive data (Madrigal, et. al), qualitative research fulfill its difficulties of interpretation. However, in reality, with a small budget, companies usually conduct only qualitative studies for its lower cost and direct fruit of users’ insight that provide better investment returns, and the quantitative study is often been neglected (Nielsen, 2001).
Introduction of System Usability Scale
When most quantitative study methods are considerably expensive, the System Usability Scale (SUS) was developed as a quick and efficient way of testing the usability of a user interface. As a fairly short quiz, it doesn’t require a lot of resources to administer (Thomas). In fact, according to John Brooke, the developer of SUS, intended to be a “quick and dirty” methodology. It is “quick” for the reason that it “allows us to do so in the very short time available to us during an evaluation session”; And it is “dirty” because this method “provides us with a measure of people’s subjective perceptions of the usability of a system” (Brooke, 2013, pp. 33).
Moreover, as a tool that measures only users “subjective view” on a system’s usability, SUS has been proved “valid and reliable” (Brooke, 2013, pp. 33), and that it is comparable to other standardized usability questionnaires (Sauro, 2011, pp. 72). SUS has become an industry standard with references in over 600 publications (Sauro, Feb 2011) and has become a part of ISO 9241-11 (usabilityscale.com) in the year 1998.
How to Conduct a System Usability Scale
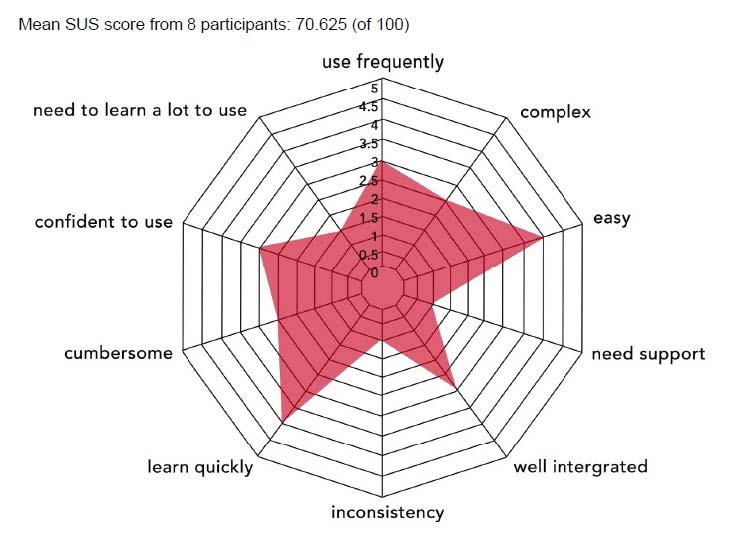
To conduct a System Usability Scale, you will need participants to answer 10 questions on a Likert Scale (Thomas). Participants will rank each question from 1 to 5 based on how much they agree with the statement they are reading. 5 means they agree completely, 1 means they strongly disagree (similar to Pratt’s course evaluation form).
The 10 questions are:
- I think that I would like to use this system frequently.
- I found the system unnecessarily complex.
- I thought the system was easy to use.
- I think that I would need the support of a technical person to be able to use this system.
- I found the various functions in this system were well integrated.
- I thought there was too much inconsistency in this system.
- I would imagine that most people would learn to use this system very quickly.
- I found the system very cumbersome to use.
- I felt very confident using the system.
- I needed to learn a lot of things before I could get going with this system.
and each question should be answered in the format as below:
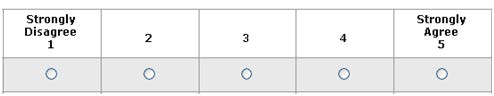
With a simple strategy like this, SUS is cheap to start using, particularly online, and it’s still one of the “most efficient ways of gathering statistically valid data and … a clear and reasonably precise score.” (Thomas)
Thomas has concluded the calculation of three simple rules from John Brooke’s 1996 revised version of SUS (Thomas; Brooke, 1996, pp. 6).
“Your users will have ranked each of the 10 templates questions above from 1 to 5, based on their level of agreement.
-
-
- For each of the odd-numbered questions, subtract 1 from the score.
- For each of the even numbered questions, subtract their value from 5.
- Take these new values which you have found, and add up the total score. Then multiply this by 2.5.
-
The result of all these tricky calculations is that you now have your score out of 100. This is NOT a percentage, but it is a clear way of seeing your score.”
The calculation became even easier when an Excel spreadsheet has been created to help us calculate the SUS result automatically, which can be easily found on the web.
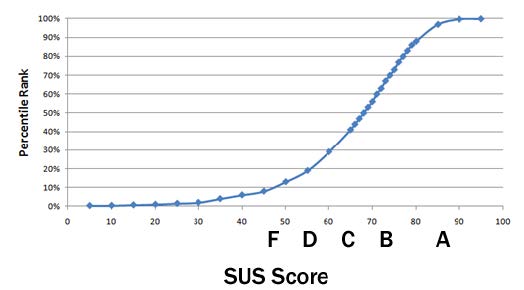
After we generate a system’s score, the number itself has no meaning without interpretation. After a 500 of evaluation with over 5000 users, Jeff Sauro provided a simple and quick method for us to interpret the SUS score that has been generated (Sauro, Feb, 2011). If the system gets an 80.3 or higher is an A, which means the system is good and will be recommended to others; 68 is the average score among all 500 tests that Sauro has run; and 51 is about the F, which means usability is the priority problem (see fig. 4).
Conclusion
In summation, on the one hand, as Sauro has indicated, “data from over 5000 users and almost 500 different studies suggest that SUS is far from dirty” (Sauro, Feb 2011). On the other hand, to gain a valid and fairly accurate result with only a 10-question scale, SUS is surely a “quick” method of the usability study. What’s more, with the tools developed in the 30 years after SUS’s release, such as the SUS calculator and Sauro’s interpretation diagram, this method became even quicker. Therefore, I would conclude that compare with the other quantitative method (which might have other advantages), SUS is a quick and “quick” usability scale.
References
Brooke, John, SUS: A Retrospective, Journal of Usability Studies, Vol. 8, Issue 2, February 2013, pp. 29-40. Retrieved on April 10th, 2018, http://uxpajournal.org/wp-content/uploads/pdf/JUS_Brooke_February_2013.pdf
Brooke, John, SUS – A quick and dirty usability scale, Usability evaluation in industry, Vol. 189, Issue 194, June 11, 1996, pp. 4-7. Retrieved April 10, 2018. https://hell.meiert.org/core/pdf/sus.pdf
Budiu, Raluca, Quantitative vs. Qualitative Usability Testing, www.nngroup.com, October 1, 2017. https://www.nngroup.com/articles/quant-vs-qual/
Erickson, Jenna, UX Designers: Do Not Be Scared Of Quantitative Data, usabilitygeek.com, April 10, 2017. https://usabilitygeek.com/ux-designers-quantitative-data/
Madrigal, Demetrius, and Bryan McClain, Strengths and Weaknesses of Quantitative and Qualitative Research, www.uxmatters.com, https://www.uxmatters.com/mt/archives/2012/09/strengths-and-weaknesses-of-quantitative-and-qualitative-research.php
Meyer, Kate, Writing Tasks for Quantitative and Qualitative Usability Studies, www.nngroup.com, January 21, 2018. https://www.nngroup.com/articles/test-tasks-quant-qualitative/
Mortensen, Ditte, Best Practices for Qualitative User Research, www.interaction-design.org, March, 2018. https://www.interaction-design.org/literature/article/best-practices-for-qualitative-user-research
Nielsen, Jakob, Quantitative Studies: How Many Users to Test?, www.nngroup.com, June 26, 2006. https://www.nngroup.com/articles/usability-metrics/
Nielsen, Jakob, Usability Metrics, www.nngroup.com, January 21, 2001. https://www.nngroup.com/articles/usability-metrics/
NNgroup, Analytics vs. Quantitative Usability Testing, Youtube.com, July 14, 2017. https://www.youtube.com/watch?v=YWCfjy1BeA8
Qualitativeataanalysis, Qualitative and Quantitative Data Analysis: 7 Differences and the Common Sense, www.qualitativedataanalysis.net. http://www.qualitativedataanalysis.net/qualitative-and-quantitative-data-analysis/
Rohrer, Christian, When to Use Which User-Experience Research Methods, www.nngroup.com, October 12, 2014. https://www.nngroup.com/articles/which-ux-research-methods/
Sauro, Jeff, Measuring Usability with The System Usability Scale (SUS), MeasuringUsability.com. February 2, 2011. https://measuringu.com/sus/
Sauro, Jeff, A Practical Guide to the System Usability Scale (SUS), MeasuringUsability.com.2011. Retrieved on April 17, 2018, https://lms.pratt.edu/pluginfile.php/784763/mod_resource/content/0/practicalGuidetoSUS.pdf
Thomas, Nathan, How To Use The System Usability Scale (SUS) To Evaluate The Usability Of Your Website, usabilitygeek.com, July 13, 2015. https://usabilitygeek.com/how-to-use-the-system-usability-scale-sus-to-evaluate-the-usability-of-your-website/\
Trymyui, Quantitative and Qualitative testing, www.trymyui.com. https://www.trymyui.com/quantitative-and-qualitative-testing
Usabilityscale, Methodology, usabilityscale.com. https://usabilityscale.com/methodology/